

Abstract
Objective:
To assess volume loss and flortaucipir uptake in patients with semantic dementia (SD) over time.
Methods:
Eight SD patients (3 female) underwent clinical evaluations, flortaucipir PET, and brain MRI at two visits. Voxel-level comparisons of MRI gray and white matter volume loss and flortaucipir PET uptake were performed in SPM12, comparing SD patients to controls at each visit. T-tests on difference images and paired t-tests of flortaucipir uptake were also performed.
Results:
At the voxel level, SD patients showed asymmetric, bilateral gray volume loss in the temporal lobes, which, via visual inspection, extended posteriorly at follow-up. White matter loss and flortaucipir uptake were noted in SD patients in the left temporal lobe only, which appeared to extend posteriorly, without involvement of the right hemisphere at follow-up. Longitudinal analyses did not support significant changes in flortaucipir uptake between visits.
Conclusions:
The biological mechanisms of flortaucipir signal in suspected underlying TDP-43 pathology are unknown. A one year interval is not sufficient time to demonstrate significant longitudinal flortaucipir uptake changes in SD.
Keywords: semantic dementia, primary progressive aphasia, tau, PET, MRI
1.0. Introduction
Semantic dementia (SD) results from degeneration of the anteromedial temporal lobes and is clinically characterized by progressive loss of conceptual (i.e. semantic) knowledge (Warrington, 1975). If language is the preferentially affected semantic network, the clinical syndrome is referred to as the semantic variant of Primary Progressive Aphasia (Gorno-Tempini et al., 2011). Generally, SD is associated with abnormal amounts of TAR-DNA binding protein 43 (TDP-43) type C in the anteromedial temporal lobes regions at autopsy (Davies et al., 2005; Hodges et al., 2010; Josephs et al., 2011; Leyton, Britton, Hodges, Halliday, & Kril, 2016; Mesulam et al., 2014; Snowden, Neary, & Mann, 2007; Spinelli et al., 2017), although other disease mechanisms (i.e. Alzheimer’s disease, Picks disease and primary age-related tauopathy) have also been reported (Davies et al., 2005; Harris et al., 2013; Mesulam et al., 2008; Spinelli et al., 2017).
Advances in neuroimaging have allowed us to make better predictions about underlying pathology during a patient’s life. Tau positron emission tomography (PET) ligands, such as flortaucipir ([18F]AV-1451), have demonstrated elevated uptake in patients with SD in vivo (Bevan-Jones et al., 2018; Cho et al., 2019; Josephs et al., 2018; Makaretz et al., 2018; Whitwell et al., 2019). Interestingly, this is despite being designed to detect 3R+4R tau, reflecting Alzheimer’s disease pathology (Xia et al., 2013). In autoradiography studies, there is little binding of flortaucipir to TDP-43 (Lowe et al., 2016; Marquie et al., 2015; Sander et al., 2016). Notwithstanding, flortaucipir uptake has been reported in regions associated with atrophy on brain magnetic resonance imaging (MRI) in patients with SD (Bevan-Jones et al., 2018; Makaretz et al., 2018). In a recent study, flortaucipir uptake was noted bilaterally, left greater than right, in the temporal lobes in patients with SD, with additional uptake noted in the orbitofrontal cortex, insula, and entorhinal cortex (Josephs et al., 2018). In another study, it was demonstrated that the level of flortaucipir uptake is lower than that seen in Alzheimer’s disease, but still meaningfully associated with the clinical presentation and regions of neurodegeneration (Whitwell et al., 2019). It is unclear how changes in flortaucipir correspond to changes in atrophy and clinical progression.
This study evaluated longitudinal change in neurodegeneration and flortaucipir uptake in patients with SD. To accomplish this, 1) voxel-based morphometry was performed to evaluate change in gray matter and white matter volume, and flortaucipir uptake at the group level, and 2) annualized changes in cortical thickness and flortaucipir uptake were calculated in regions of interest at the individual level. Changes in clinical measures of interest were also measured.
2.0. Methods
2.1. Patients
Between November 2017 and May 2019, eight patients (3 female) with SD were recruited by the Neurodegenerative Research Group (NRG) and underwent flortaucipir PET imaging at two visits, approximately one year apart. They were all native English speakers. Seven patients were right handed; one was ambidextrous. Seven patients were beta-amyloid negative, per Pittsburgh compound B (PiB) PET scan. A global PiB ratio > 1.48, calculated with an updated pipeline in SPM12, was deemed beta-amyloid positive (Jack et al., 2017; Knopman et al., 2019). Each patient underwent a standard protocol of neurologic, and speech and language assessments, a 3-tesla volumetric MRI, and flortaucipir PET scan. Clinical and demographic information is reported in Table 1. Clinical measures included: The Montreal Cognitive Assessment (MoCA), a test of general cognition (Nasreddine et al., 2005); Neuropsychiatric Inventory Questionnaire (NPI-Q) (Kaufer et al., 2000), as a measure of psychiatric features; the Western Aphasia Battery-Revised Aphasia Quotient (WAB AQ) (Kertesz, 2007), as a composite measure of global language ability; and the Peabody Picture Vocabulary Test (PPVT) and Sydney Language Battery (SYBAT) (Savage et al., 2013) Naming and Association tests, as measures of single-word processing.
Table 1. Clinical and demographic information.
Median (interquartile range: quartile 1, quartile 3) for each clinical measure of interest. Uncorrected non-parametric p values are reported. Note: MoCA = Montreal Cognitive Assessment Battery; NPI-Q = Neuropsychiatric Inventory Questionnaire; WAB-AQ = Western Aphasia Battery Aphasia Quotient; PPVT = Peabody Picture Vocabulary Test; SYDBAT = Sydney Language Battery.
| Visit 1 | Visit 2 | Difference (N=8) | p value | |
|---|---|---|---|---|
| Age at MRI | 64 (61, 68) | 65 (62, 69) | 1 (1, 1) | |
| MoCA (/30) | 20 (20, 24) | 18 (15, 19) | −4 (−8, −2) | 0.035 |
| NPI-Q (/36) | 7 (6, 13) | 5 (5, 8) | −2 (−4, 1) | 0.353 |
| WAB-AQ (/100) | 86 (82, 90) | 77 (73, 87) | −8 (−12, −2) | 0.055 |
| PPVT (standard score) | 66 (62, 74) | 58 (50, 71) | −4 (−10, −3) | 0.008 |
| SYDBAT Naming (/30) | 8 (4, 11) | 3 (1, 8) | −3 (−4, −1) | 0.093 |
| SYDBAT Association (/30) | 18 (16, 20) | 18 (8, 19) | −2 (−6, 1) | 0.469 |
The patients with SD were each age and sex matched to three beta-amyloid negative clinically unimpaired controls who also had two visits approximately one year apart, for a total of 24 controls. This data was collected as part of the Mayo Clinic Study of Aging (MCSA) (Petersen et al., 2010; Roberts et al., 2008).
All participants underwent identical neuroimaging protocols, described below. All participants consented to having their data used for this Mayo Clinic institutional review board approved study.
2.2. Clinical Data
Wilcoxon signed-rank tests were used to assess the annualized change in clinical measures in the SD group.
2.3. Imaging
2.3.1. Imaging acquisition
Patients and controls underwent an MRI and flortaucipir PET scan at each visit. MRI segmentations were performed using SPM12 (Ashburner & Friston, 2005), using MCALT (Schwarz et al., 2017) (https://www.nitrc.org/projects/mcalt/). Flortaucipir PET scans were acquired using PET/CT scanners (GE Healthcare, Milwaukee, WI) operating in 3-dimensional mode. [18F]AV-1451 was administered via IV bolus, followed by a 20-minute PET acquisition performed 80 minutes after injection. Tau PET standard uptake value ratio (SUVr) images using the cerebellar crus gray matter as the reference region were calculated, with and without two-compartment partial volume-correction (Meltzer, Leal, Mayberg, Wagner, & Frost, 1990).
2.3.2. Voxel Based Morphometry
Voxel-level comparisons of MRI gray and white matter volumes and flortaucipir PET uptake were performed with voxel based morphometry (VBM) (Ashburner & Friston, 2000) using SPM12 at both baseline and follow-up visits, comparing SD patients to matched controls. Family-Wise Error (FWE) correction for multiple comparisons was done at the cluster level. We first estimated the smoothness and spatial autocorrelation in the data with the AFNI program 3dFWHMx applied to the residuals from the VBM analyses. The autocorrelation-function variables were then entered into AFNI’s 3dClustSim with the ‘-2difMAD’ setting and the mask used in the VBM analysis. Monte Carlo simulations were run (10 000) estimating the cluster sizes that arise by chance in our data, which yielded a cluster-size threshold corresponding to a FWE-corrected p-value of 0.05 (Cox, Reynolds, & Taylor, 2016; Eklund, Nichols, & Knutsson, 2016). Paired t-tests and t-tests of difference images (time 2 – time 1) of flortaucipir uptake within each group (SD and control) were also conducted. Statistical significance for each was assessed with a FWE-corrected p-value of 0.05.
2.3.3. Cortical thickness
MRI-based cortical thickness was computed using DiReCT (Das, Avants, Grossman, & Gee, 2009) with SPM12 tissue segmentations in a pipeline that has been previously described (Schwarz et al., 2016).
2.3.4. Individual change
Cortical thickness and flortaucipir uptake were calculated in pre-selected regions of interest (ROIs) for each imaging visit, then subtracted and annualized to visualize change for each individual patient. ROIs were selected based on areas of atrophy and flortaucipir uptake noted in previous literature (Bevan-Jones et al., 2018; Josephs et al., 2018; Makaretz et al., 2018; Whitwell et al., 2019). The following ROIs were selected from the MCALT-ADIR122 atlas: amygdala, entorhinal cortex, fusiform gyrus, insula, temporal pole (merged temporal pole mid and temporal pole sup), inferior temporal gyrus, middle temporal gyrus, Broca’s area (merged inferior frontal operculum and inferior frontal triangularis), prefrontal cortex (merged middle and superior frontal), and orbitofrontal cortex (merged inferior frontal orbital, mid frontal orbital, superior frontal orbital, and medial frontal orbital).
3.0. Results
3.1. Clinical Change
See Table 1. Median age was 64 years, with a median of 2 years disease duration at initial testing. Statistically significant changes in the MoCA and PPVT, with borderline-significant changes in the WAB-AQ, were noted between visits.
3.2. MRI
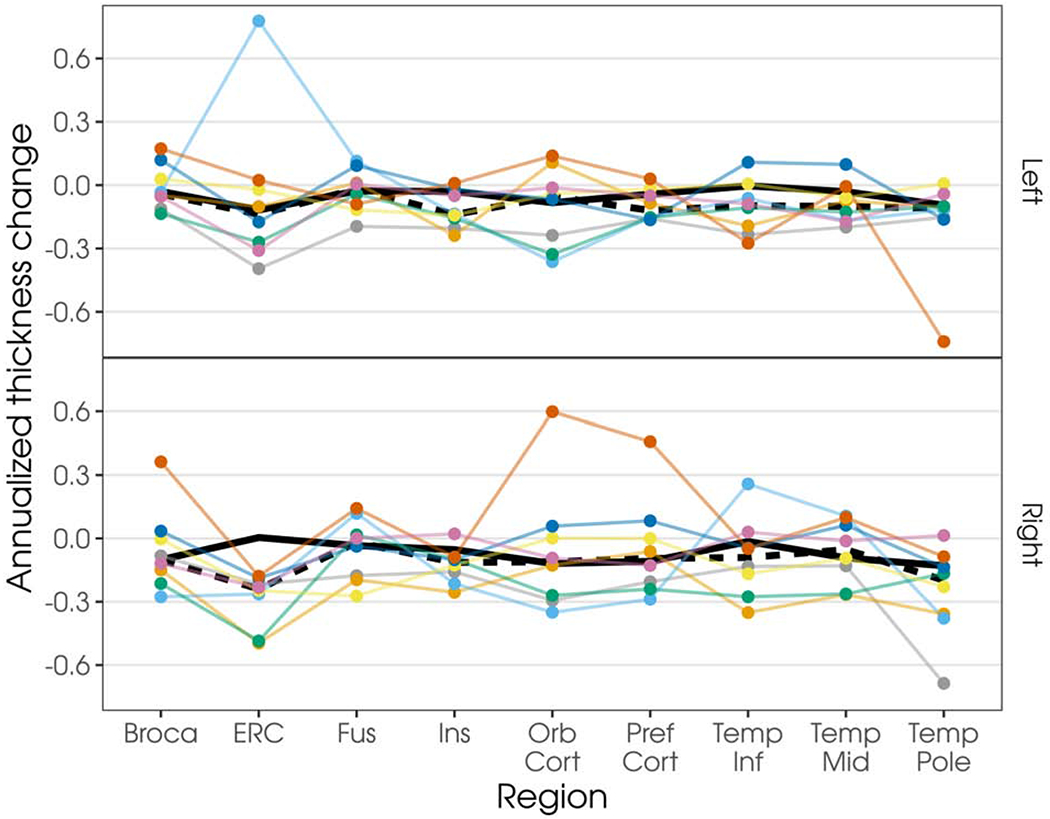
At the first visit, bilateral, left greater than right, gray matter volume loss was observed in the temporal lobes, which visually appeared to extend posteriorly and with additional change in the right hemisphere at follow-up (see Figure 1). Compared to controls at the voxel level, the SD patients showed reduced white matter volume in the left temporal lobe only at first visit, which extended slightly posteriorly at follow-up (see Figure 1). Gray and white matter volumes were never less in controls than in patients (data not presented). Annualized changes in cortical thickness for each individual patient in regions of interest are shown in Figure 2. Seven patients showed the expected progression of atrophy in the left temporal regions, with 5 showing atrophy in the right homologous regions. All patients demonstrated atrophy in the right entorhinal cortex, but only half had atrophy in the left homologous regions. Four patients showed additional atrophy in the left and right orbitofrontal cortex. Similarly, half of the cohort showed additional atrophy in Broca’s area bilaterally. Additional visualization of this data, as percentage of change including individual controls, is shown in Supplementary Figure 1.
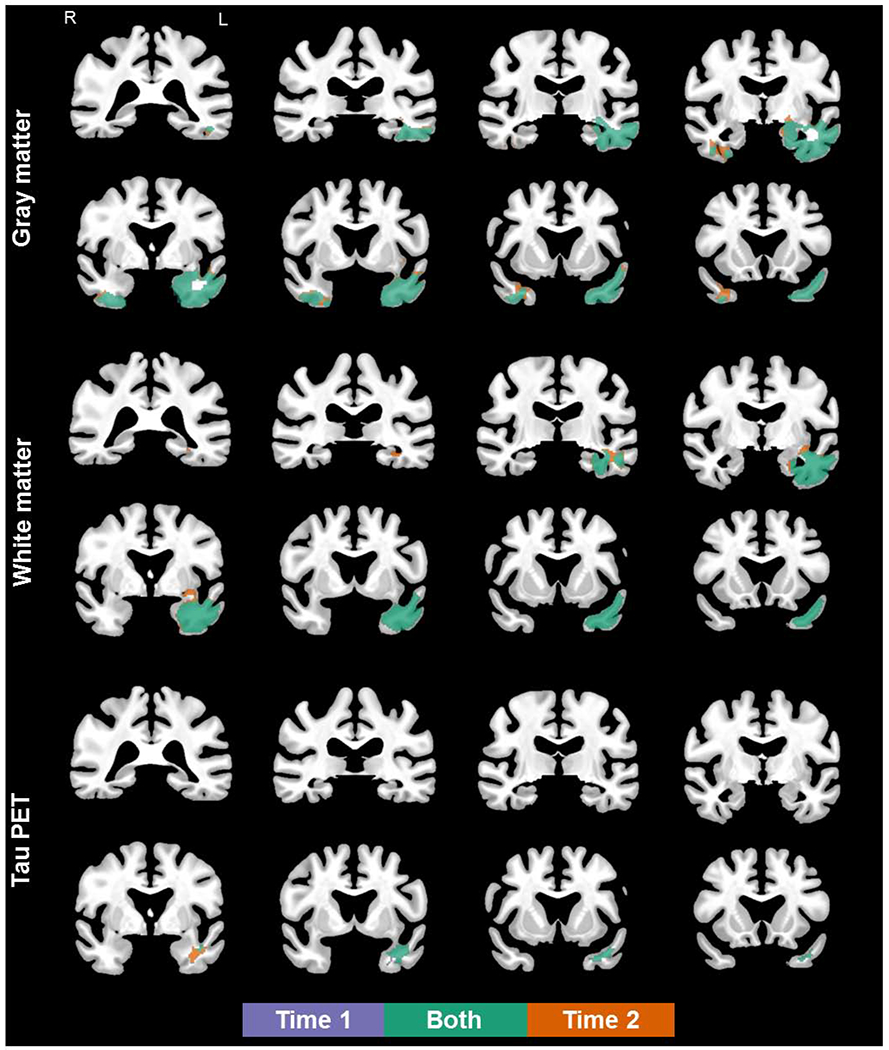
Figure 1.
Coronal views of gray matter loss (top), white matter loss (middle), and flortaucipir uptake (bottom) in semantic dementia patients, compared to age- and sex- matched controls (FWEc, p < .05; details provided in Supplementary Table 1). Results shown in MCALT space.
Figure 2.
Plot of annualized change in cortical thicknesses by region and hemisphere. Each colored line represents an individual patient; values are connected to facilitate visualization. Dark underlaid black line represents the median change in the control cohort (solid line) or SD cohort (dashed line). Note: Broca = Broca’s area, ERC = entorhinal cortex, Fus = fusiform gyrus, Ins = insula, Orb Cort = orbitofrontal cortex, Pref Cort = prefrontal cortex, Temp Inf = inferior temporal gyrus, Temp Mid = middle temporal gyrus, and Temp Pole = temporal pole.
3.3. Flortaucipir PET
At the voxel level, the SD patients showed increased flortaucipir uptake in the anterior portion of the temporal lobe at first visit, which visually appeared to extend posteriorly at follow-up (see Figure 1). Flortaucipir uptake was never greater in controls than in patients. The aforementioned descriptions reflect comparison of SD patients to age- and sex- matched controls at each time point (Figure 1). Neither paired t-tests nor t-tests of difference images yeilded significant differences in flortaucirpit uptake between visits.
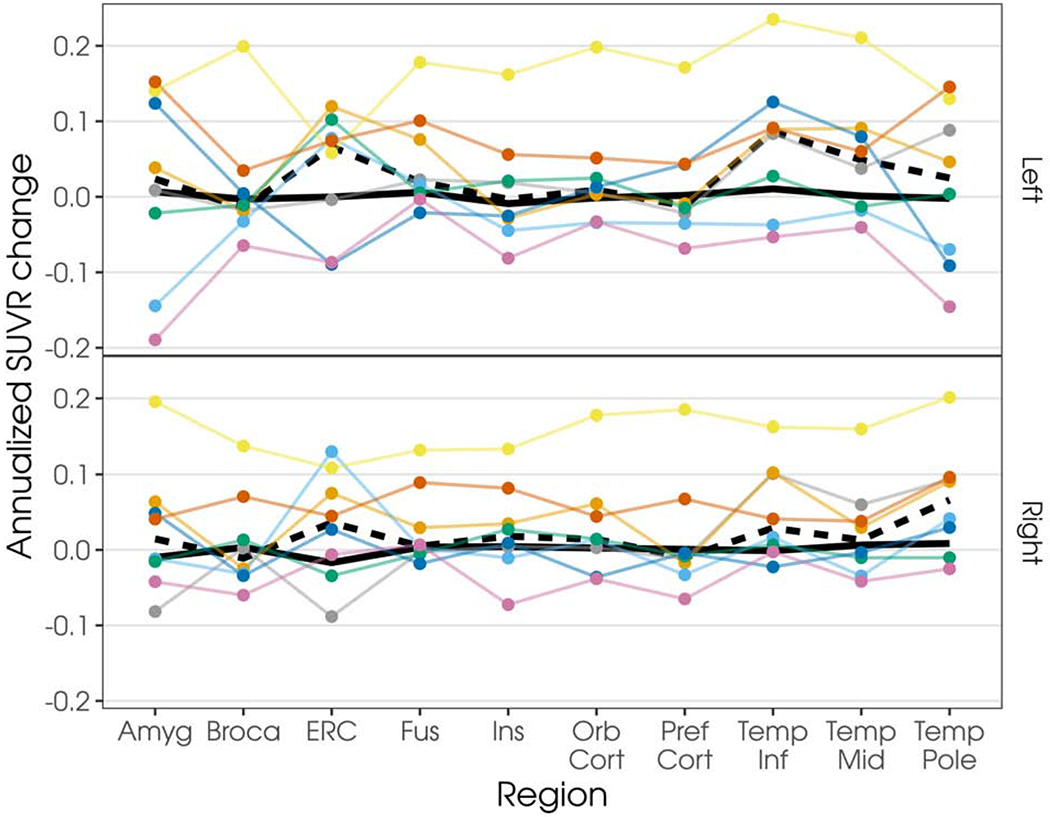
Annualized changes in flortaucipir uptake for each individual patient in regions of interest are shown in Figure 3; data without partial volume correction shown in Supplementary Figure 2. Most patients showed increased flortaucipir uptake over time in all regions across both hemispheres. However, there were two patients who did not show an increase in flortaucipir utpake between visits, despite evidence of increased atrophy. Additional visualization of this data, as percentage of change including individual controls, is shown in Supplementary Figures 3 and 4 (with and without partial volume correction, respectively).
Figure 3.
Plot of annualized change in flortaucipir SUVR, with two-compartment partial volume-correction, by region and hemisphere. Each colored line represents an individual patient; values are connected to facilitate visualization. Patients are represented as the same color as in Figure 2. Dark underlaid black line represents the median change in the control cohort (solid line) or SD cohort (dashed line). Note: Amyg = Amygdala, Broca = Broca’s area, ERC = entorhinal cortex, Fus = fusiform gyrus, Ins = insula, Orb Cort = orbitofrontal cortex, Pref Cort = prefrontal cortex, Temp Inf = inferior temporal gyrus, Temp Mid = middle temporal gyrus, and Temp Pole = temporal pole.
4.0. Discussion
The current study is the first to evaluate flortaucipir uptake over time in patients with semantic dementia. The cohort had a median of two years disease duration at initial testing, suggesting they were early in the disease’s clinical course. Despite the short time interval (approximately one year), clinical change was noted between visits, with statistically significant changes noted in tests of general cognitive functioning (MoCA) and vocabulary (PPVT), and borderline-significant changes in overall language functioning (WAB-AQ). Even early within the clinical course, performance on the SYDBAT naming and association tests, sensitive to deficits in semantic knowledge, reflected pronounced deficits at the first visit. In addition to the small sample size, this may have contributed to the lack of significant “change” in clinical performance on the second evaluation.
At the group level relative to controls, the SD patients showed bilateral, left greater than right, reduction in gray matter volumes in the temporal lobes at first visit, which visually appeared to extended posteriorly and with additional changes in the right hemisphere at follow-up. This is consistent with past research that has shown progressive, posterior temporal extension of gray matter atrophy, with ultimate contralteral involvement (Kumfor et al., 2016; Landin-Romero, Tan, Hodges, & Kumfor, 2016; Rogalski et al., 2014; Rosen et al., 2002). Reduced white matter volumes were noted in the left temporal lobe only at the first visit. These findings also largely replicate those of past studies of white matter change, albeit with different methodological appraoches (Elahi et al., 2017; Tu, Leyton, Hodges, Piguet, & Hornberger, 2016). These patterns raise the question of whether white matter degeneration occurs later in the disease course, possibly as a consequence of gray matter loss. Longitudinal, regional reductions in cortical thickness were visible at the individual level, suggesting that the group voxel-level analysis did not fully capture some affected regions. This may be due to the fact that only half of the cohort showed atrophy in the orbitofrontal cortex and Broca’s area. There are small effects with high variance. It may also be related to methodology; the ROI data expresses cortical thickness, whereas the voxel-level analyses represent volume loss.
Consistent with past studies (Bevan-Jones et al., 2018; Josephs et al., 2018; Makaretz et al., 2018; Whitwell et al., 2019), the SD patients showed increased flortaucipir uptake in the anterior portion of the temporal lobe at first visit. Neither paired t-tests nor tests of difference images yeilded significant differences in flortaucirpir uptake between visits. At the individual level, most patients showed increased flortaucipir uptake in all regions across both hemispheres. This visualization of the data reflects flortaucipir uptake in regions beyond those noted to have flortaucipir uptake in the cross-sectional analysis. The annual percent change in some regions is comparable to the known changes in Alzheimer’s disease dementia (Jack et al., 2018) (see Supplementary Figure 3). Interestingly, there were two patients who did not show an increase (or showed a slight decrease) in flortaucipir uptake between visits, despite evidence of increased neurodegeneration. Such biologically-implausible trajectories may be due to noise or a number of other technical factors (Devous et al., 2018). We also examined the data relative to two-compartment partial volume correction and it appeared qualitatively similar with and without, suggesting that these implausible trajectories were not solely driven by atrophy (see Supplementary Figures 2 and 4).
This study offers novel contributions to the literature and will help build our understanding of the pathophysiology underlying semantic dementia. In the same cohort of patients, there is change in white matter loss, gray matter loss, and flortaucipir uptake that appears to from anterior to posterior and on the right later than on the left, when there was bilateral involvement. However, there are also limitations to this study. One limitation is the unknown biological mechanisms of flortaucipir uptake in these patients. The literature suggests that flortaucipir signal occurs in regions that likely contain TDP-43 (Bevan-Jones et al., 2018), but it is unlikely to be binding to TDP-43 itself (Josephs et al., 2018). This uptake more likely reflects off-target binding. Other recent studies have shown that off-target binding of flortaucipir is at least partially attributable to monoamine oxidase (MAO) (Drake et al., 2019), which has been associated with inflammation. These findings may reflect binding to MAO due to inflammation as a consequence of TDP-43 pathology, as there was flortaucipir signal adjacent to the clinically-expected locations of underlying pathology. It may also be the case that there is variable sensitity and specificty for varieties of TDP-43, as there was limited flortaucipir uptake in recent studies of C9orf72 and MAPT mutation carriers, also associated with TDP-43 pathology (Smith et al., 2019; Tsai et al., 2019). Future studies should explore other measures of inflammation in these patients, paying particular attention to those who do and do not show flortaucipir uptake in areas of neurodegeneration, and accounting for TDP-43 type at autopsy.
There are statistical limitations to this study. While the individuals’ data suggest the SD patients have a small, consistent increase over controls, 8 patients is not sufficient power to detect such a small increase in a voxelwise analysis. Neither paired t-tests nor tests of difference images yeilded significant differences in flortaucirpit uptake between visits. At the same time, the fact that the patients have larger cross sectional uptake than controls implies that, over some unspecified time-interval, the binding had to increase more than expected for age. This suggests that a one year interval is not sufficient time to demonstrate these changes, especially in a sample this size. Further statistical evaluation over longer intervals in larger sample sizes is recommended.
Another limitation is that there is no gold standard of methodology to assess flortaucipir uptake, especially in non-Alzheimer’s disease pathologies. The methodological decisions in this study were intended to allow for comparison with previous work; however, they may have influenced results. Results are therefore provided with and without partial volume correction. Further work is necessary to determine the relationship between in vivo imaging, including FDG-PET and diffusion tensor imaging, and underlying pathology. Future studies should directly relate clinical and neuroimaging changes in a larger sample over a longer disease course, across the disease and severity spectrum.
5.0. Conclusions
The biological mechanisms of flortaucipir signal in likely TDP-43 pathology are unknown. MRI robustly reflects the neurodegeneration underlying the clinical presentation. The difference between white matter and gray matter findings may have implications for the pathophysiology, or the cascade of pathophysiological events, underlying semantic dementia. Overall, a one year interval is not sufficient time to demonstrate significant changes in flortaucipir uptake, especially in a sample this size. A better understanding of the association between flortaucipir uptake and neurodegeneration, beyond the intended detection of Alzheimer’s disease pathology, is critical before utilizing flortaucipir PET scans in the clinical evaluation of dementia.
Supplementary Material
Supplementary Figure 1. Box-plots, with individual data points, of percentage of change in cortical thicknesses for individual patients and controls. Patients are represented as the same color as in other figures. Beta-amyloid positive patient is noted with an open circle. Note: Amyg = Amygdala, Broca = Broca’s area, ERC = entorhinal cortex, Fus = fusiform gyrus, Ins = insula, Orb Cort = orbitofrontal cortex, Pref Cort = prefrontal cortex, Temp Inf = inferior temporal gyrus, and Temp Mid = middle temporal gyrus.
Supplementary Figure 2. Plot of annualized change in flortaucipir SUVR, without partial volume-correction, by region and hemisphere. Each colored line represents an individual patient; values are connected to facilitate visualization. Patients are represented as the same color as in Figure 2. Dark underlaid black line represents the median change in the control cohort (solid line) or SD cohort (dashed line). Note: Amyg = Amygdala, Broca = Broca’s area, ERC = entorhinal cortex, Fus = fusiform gyrus, Ins = insula, Orb Cort = orbitofrontal cortex, Pref Cort = prefrontal cortex, Temp Inf = inferior temporal gyrus, Temp Mid = middle temporal gyrus, and Temp Pole = temporal pole.
Supplementary Figure 3. Box-plots, with individual data points, of percentage of change in flortaucipir SUVR for individual patients and controls. Data presented with two-compartment partial volume-correction. Patients are represented as the same color as in other figures. Beta-amyloid positive patient is noted with an open circle. Note: Amyg = Amygdala, Broca = Broca’s area, ERC = entorhinal cortex, Fus = fusiform gyrus, Ins = insula, Orb Cort = orbitofrontal cortex, Pref Cort = prefrontal cortex, Temp Inf = inferior temporal gyrus, Temp Mid = middle temporal gyrus, and Temp Pole = temporal pole.
Supplementary Figure 4. Box-plots, with individual data points, of percentage of change in flortaucipir SUVR for individual patients and controls, without partial volume correction. Patients are represented as the same color as in other figures. Beta-amyloid positive patient is noted with an open circle. Note: Amyg = Amygdala, Broca = Broca’s area, ERC = entorhinal cortex, Fus = fusiform gyrus, Ins = insula, Orb Cort = orbitofrontal cortex, Pref Cort = prefrontal cortex, Temp Inf = inferior temporal gyrus, Temp Mid = middle temporal gyrus, and Temp Pole = temporal pole.
Highlights.
Highlights are a short collection of bullet points that convey the core findings of the article. Highlights are mandatory and should be submitted in a separate file in the online submission system. Please use ‘Highlights’ in the file name and include 3 to 5 bullet points (maximum 85 characters, including spaces, per bullet point). See https://www.elsevier.com/highlights for examples.
Mechanisms of flortaucipir (FTP) signal in suspected TDP-43 pathology are unknown.
Significant changes in FTP PET are not seen in semantic dementia over one-year.
MRI robustly reflects neurodegeneration underlying the clinical presentation.
6.0. Acknowledgments
We thank AVID Radiopharmaceuticals, Inc., for their support in supplying [18F]AV-1451 precursor, chemistry production advice and oversight, and FDA regulatory cross-filing permission and documentation needed for this work.
7.0 Funding
This study was supported by the National Institutes of Health grants R21 NS94684 (Josephs) and U01 AG006786 (Petersen), and support from the Elsie and Marvin Dekelboum Family Foundation.
8.0 Disclosure Statement
All authors receive research support from the National Institutes of Health. Dr. Jack consults for Lily and serves on an independent data monitoring board for Roche but he receives no personal compensation from any commercial entity; he receives research support from the NIH and the Alexander Family Alzheimer’s Disease Research Professorship of the Mayo Clinic. Dr. Lowe serves on scientific advisory boards for Bayer Schering Pharma, Piramal Life Sciences and receives research support from GE Healthcare, Siemens Molecular Imaging, AVID Radiopharmaceuticals and the NIH (NIA, NCI). Matthew L. Senjem owns or has owned stock and/or stock options of the following medical related companies, unrelated to the current work, within past three years: Align Technology, Inc., CRISPR Therapeutics, Gilead Sciences, Inc., Globus Medical Inc., Inovio Biomedical Corp., Ionis Pharmaceuticals, Johnson & Johnson, LHC Group, Inc., Medtronic, Inc., Mesa Laboratories, Inc., Natus Medical Incorporated, Parexel International Corporation, Varex Imaging Corporation.
Footnotes
Publisher's Disclaimer: This is a PDF file of an unedited manuscript that has been accepted for publication. As a service to our customers we are providing this early version of the manuscript. The manuscript will undergo copyediting, typesetting, and review of the resulting proof before it is published in its final form. Please note that during the production process errors may be discovered which could affect the content, and all legal disclaimers that apply to the journal pertain.
References
- Ashburner J, & Friston KJ (2000). Voxel-Based Morphometry—The Methods. Neuroimage, 11(6), 805–821. [DOI] [PubMed] [Google Scholar]
- Ashburner J, & Friston KJ (2005). Unified segmentation. Neuroimage, 26(3), 839–851. [DOI] [PubMed] [Google Scholar]
- Bevan-Jones WR, Cope TE, Jones PS, Passamonti L, Hong YT, Fryer TD, … Rowe JB (2018). [(18)F]AV-1451 binding in vivo mirrors the expected distribution of TDP-43 pathology in the semantic variant of primary progressive aphasia. J Neurol Neurosurg Psychiatry, 89(10), 1032–1037. doi: 10.1136/jnnp-2017-316402 [DOI] [PMC free article] [PubMed] [Google Scholar]
- Cho H, Kim HJ, Choi JY, Ryu YH, Lee MS, Na DL, … Lyoo CH (2019). 18F-flortaucipir uptake patterns in clinical subtypes of primary progressive aphasia. Neurobiol Aging, 75, 187–197. doi: 10.1016/j.neurobiolaging.2018.11.017 [DOI] [PubMed] [Google Scholar]
- Cox RW, Reynolds RC, & Taylor PA (2016). AFNI and Clustering: False Positive Rates Redux. bioRxiv, 065862. doi: 10.1101/065862 [DOI] [Google Scholar]
- Das SR, Avants BB, Grossman M, & Gee JC (2009). Registration based cortical thickness measurement. Neuroimage, 45(3), 867–879. doi : 10.1016/j.neuroimage.2008.12.016 [DOI] [PMC free article] [PubMed] [Google Scholar]
- Davies RR, Hodges JR, Kril JJ, Patterson K, Halliday GM, & Xuereb JH (2005). The pathological basis of semantic dementia. Brain, 128(Pt 9), 1984–1995. doi: 10.1093/brain/awh582 [DOI] [PubMed] [Google Scholar]
- Devous MD Sr., Joshi AD, Navitsky M, Southekal S, Pontecorvo MJ, Shen H, … Mintun MA (2018). Test-Retest Reproducibility for the Tau PET Imaging Agent Flortaucipir F 18. J Nucl Med, 59(6), 937–943. doi: 10.2967/jnumed.117.200691 [DOI] [PubMed] [Google Scholar]
- Drake LR, Pham JM, Desmond TJ, Mossine AV, Lee SJ, Kilbourn MR, … Scott PJH (2019). Identification of AV-1451 as a Weak, Nonselective Inhibitor of Monoamine Oxidase. ACS Chemical Neuroscience, 10(8), 3839–3846. doi: 10.1021/acschemneuro.9b00326 [DOI] [PubMed] [Google Scholar]
- Eklund A, Nichols TE, & Knutsson H (2016). Cluster failure: Why fMRI inferences for spatial extent have inflated false-positive rates. Proceedings of the National Academy of Sciences, 113(28), 7900–7905. doi: 10.1073/pnas.1602413113 [DOI] [PMC free article] [PubMed] [Google Scholar]
- Elahi FM, Marx G, Cobigo Y, Staffaroni AM, Kornak J, Tosun D, … Rosen HJ (2017). Longitudinal white matter change in frontotemporal dementia subtypes and sporadic late onset Alzheimer’s disease. Neuroimage Clin, 16, 595–603. doi: 10.1016/j.nicl.2017.09.007 [DOI] [PMC free article] [PubMed] [Google Scholar]
- Gorno-Tempini M, Hillis AE, Weintraub S, Kertesz A, Mendez M, Cappa SE, & Manes F (2011). Classification of primary progressive aphasia and its variants. Neurology, 76(11), 1006–1014. [DOI] [PMC free article] [PubMed] [Google Scholar]
- Harris JM, Gall C, Thompson JC, Richardson AMT, Neary D, du Plessis D, … Jones M (2013). Classification and pathology of primary progressive aphasia. Neurology, 81(21), 1832–1839. doi: 10.1212/01.wnl.0000436070.28137.7b [DOI] [PubMed] [Google Scholar]
- Hodges JR, Mitchell J, Dawson K, Spillantini MG, Xuereb JH, McMonagle P, … Patterson K (2010). Semantic dementia: demography, familial factors and survival in a consecutive series of 100 cases. Brain, 133(Pt 1), 300–306. doi: 10.1093/brain/awp248 [DOI] [PubMed] [Google Scholar]
- Jack CR, Wiste HJ, Schwarz CG, Lowe VJ, Senjem ML, Vemuri P, … Petersen RC (2018). Longitudinal tau PET in ageing and Alzheimer’s disease. Brain, 141(5), 1517–1528. doi: 10.1093/brain/awy059 [DOI] [PMC free article] [PubMed] [Google Scholar]
- Jack CR, Wiste HJ, Weigand SD, Therneau TM, Lowe VJ, Knopman DS, … Petersen RC (2017). Defining imaging biomarker cut points for brain aging and Alzheimer’s disease. Alzheimer’s & Dementia, 13(3), 205–216. doi: 10.1016/j.jalz.2016.08.005 [DOI] [PMC free article] [PubMed] [Google Scholar]
- Josephs KA, Hodges JR, Snowden JS, Mackenzie IR, Neumann M, Mann DM, & Dickson DW (2011). Neuropathological background of phenotypical variability in frontotemporal dementia. Acta Neuropathol, 122(2), 137–153. Retrieved from http://www.ncbi.nlm.nih.gov/entrez/query.fcgi?cmd=Retrieve&db=PubMed&dopt=Citation&list_uids=21614463 [DOI] [PMC free article] [PubMed] [Google Scholar]
- Josephs KA, Martin PR, Hugo B, G. SC, R. DJ, M. CH, … L. WJ (2018). [18F]AV-1451 tau-PET and primary progressive aphasia. Annals of Neurology, 83(3), 599–611. doi:: 10.1002/ana.25183 [DOI] [PMC free article] [PubMed] [Google Scholar]
- Kaufer D, Cummings J, Ketchel P, Smith V, MacMillan A, Shelley T, … DeKosky S (2000). Validation of the NPI-Q, a brief clinical form of the Neuropsychiatric Inventory. The Journal of neuropsychiatry and clinical neurosciences, 12, 233–239. [DOI] [PubMed] [Google Scholar]
- Kertesz A (2007). Western Aphasia Battery (Revised). San Antonio, TX: PsychCorp. [Google Scholar]
- Knopman DS, Lundt ES, Therneau TM, Vemuri P, Lowe VJ, Kantarci K, … Jack CR Jr. (2019). Entorhinal cortex tau, amyloid-β, cortical thickness and memory performance in non-demented subjects. Brain, 142(4), 1148–1160. doi : 10.1093/brain/awz025 [DOI] [PMC free article] [PubMed] [Google Scholar]
- Kumfor F, Landin-Romero R, Devenney E, Hutchings R, Grasso R, Hodges JR, & Piguet O (2016). On the right side? A longitudinal study of left- versus right-lateralized semantic dementia. Brain, 139(Pt 3), 986–998. doi: 10.1093/brain/awv387 [DOI] [PubMed] [Google Scholar]
- Landin-Romero R, Tan R, Hodges JR, & Kumfor F (2016). An update on semantic dementia: genetics, imaging, and pathology. Alzheimers Res Ther, 8(1), 52–52. doi: 10.1186/s13195-016-0219-5 [DOI] [PMC free article] [PubMed] [Google Scholar]
- Leyton CE, Britton AK, Hodges JR, Halliday GM, & Kril JJ (2016). Distinctive pathological mechanisms involved in primary progressive aphasias. Neurobiol Aging, 38, 82–92. doi: 10.1016/j.neurobiolaging.2015.10.017 [DOI] [PubMed] [Google Scholar]
- Lowe V, Curran G, Fang P, Liesinger AM, Josephs KA, Parisi JE, … Murray ME (2016). An autoradiographic evaluation of AV-1451 Tau PET in dementia. Acta Neuropathol Commun, 4(1), 58. doi: 10.1186/s40478-016-0315-6 [DOI] [PMC free article] [PubMed] [Google Scholar]
- Makaretz SJ, Quimby M, Collins J, Makris N, McGinnis S, Schultz A, … Dickerson BC (2018). Flortaucipir tau PET imaging in semantic variant primary progressive aphasia. J Neurol Neurosurg Psychiatry, 59(10), 1024–1031. doi: 10.1136/jnnp-2017-316409 [DOI] [PMC free article] [PubMed] [Google Scholar]
- Marquie M, Normandin MD, Vanderburg CR, Costantino IM, Bien EA, Rycyna LG, … Gomez-Isla T (2015). Validating novel tau positron emission tomography tracer [F-18]-AV-1451 (T807) on postmortem brain tissue. Ann Neurol, 75(5), 787–800. doi : 10.1002/ana.24517 [DOI] [PMC free article] [PubMed] [Google Scholar]
- Meltzer CC, Leal JP, Mayberg HS, Wagner HN, & Frost JJ (1990). Correction of PET data for partial volume effects in human cerebral cortex by MR imaging. Journal of computer assisted tomography, 14(4), 561–570. Retrieved from http://europepmc.org/abstract/MED/2370355 [DOI] [PubMed] [Google Scholar]
- Mesulam MM, Weintraub S, Rogalski EJ, Wieneke C, Geula C, & Bigio EH (2014). Asymmetry and heterogeneity of Alzheimer’s and frontotemporal pathology in primary progressive aphasia. Brain, 137(Pt 4), 1176–1192. doi: 10.1093/brain/awu024 [DOI] [PMC free article] [PubMed] [Google Scholar]
- Mesulam MM, Wicklund A, Johnson N, Rogalski E, Leger GC, Rademaker A, … Bigio EH (2008). Alzheimer and frontotemporal pathology in subsets of primary progressive aphasia. Ann Neurol, 63(6), 709–719. doi: 10.1002/ana.21388 [DOI] [PMC free article] [PubMed] [Google Scholar]
- Nasreddine Z, Phillips N, Bedirian V, Charbonneau S, Whitehead V, Collin I, … Chertkow H (2005). The Montreal Cognitive Assessment, MoCA: a brief screening tool for mild cognitive impairment. Journal of the American Geriatrics Society, 53, 695–669. [DOI] [PubMed] [Google Scholar]
- Petersen RC, Roberts RO, Knopman DS, Geda YE, Cha RH, Pankratz VS, … Petersen RC (2010). The Mayo Clinic Study of Aging: prevalence of mild cognitive impairment is higher in men. Neurology, 75, 889–897. [DOI] [PMC free article] [PubMed] [Google Scholar]
- Roberts RO, Geda YE, Knopman DS, Cha RH, Pankratz VS, Boeve BF, … Rocca WA (2008). The Mayo Clinic Study of Aging: design and sampling, participation, baseline measures and sample characteristics. Neuroepidemiology, 30(1), 58–69. doi: 10.1159/000115751 [DOI] [PMC free article] [PubMed] [Google Scholar]
- Rogalski E, Cobia D, Martersteck A, Rademaker A, Wieneke C, Weintraub S, & Mesulam MM (2014). Asymmetry of cortical decline in subtypes of primary progressive aphasia. Neurology, 53(13), 1184–1191. doi: 10.1212/wnl.0000000000000824 [DOI] [PMC free article] [PubMed] [Google Scholar]
- Rosen HJ, Gorno-Tempini ML, Goldman WP, Perry RJ, Schuff N, Weiner M, … Miller BL (2002). Patterns of brain atrophy in frontotemporal dementia and semantic dementia. Neurology, 55(2), 198–208. doi: 10.1212/wnl.58.2.198 [DOI] [PubMed] [Google Scholar]
- Sander K, Lashley T, Gami P, Gendron T, Lythgoe MF, Rohrer JD, … Arstad E (2016). Characterization of tau positron emission tomography tracer [18F]AV-1451 binding to postmortem tissue in Alzheimer’s disease, primary tauopathies, and other dementias. Alzheimers Dement, 12(11), 1116–1124. doi: 10.1016/j.jalz.2016.01.003 [DOI] [PubMed] [Google Scholar]
- Savage S, Hsieh S, Leslie F, Foxe D, Piguet O, & Hodges JR (2013). Distinguishing subtypes in primary progressive aphasia: application of the Sydney language battery. Dement Geriatr Cogn Disord, 35(3-4), 208–218. doi: 10.1159/000346389 [DOI] [PubMed] [Google Scholar]
- Schwarz CG, Gunter JL, Ward CP, Vemuri P, Senjem ML, Wiste HJ, … Jack CR (2017). The Mayo Clinic Adult Lifespan Template (MCALT): Better Quantification across the Lifespan. Paper presented at the Alzheimer’s Association International Conference. [Google Scholar]
- Schwarz CG, Gunter JL, Wiste HJ, Przybelski SA, Weigand SD, Ward CP, … Jack CR Jr. (2016). A large-scale comparison of cortical thickness and volume methods for measuring Alzheimer’s disease severity. Neuroimage Clin, 77, 802–812. doi: 10.1016/j.nicl.2016.05.017 [DOI] [PMC free article] [PubMed] [Google Scholar]
- Smith R, Santillo AF, Waldo ML, Strandberg O, Berron D, Vestberg S, … Hansson O (2019). (18)F-Flortaucipir in TDP-43 associated frontotemporal dementia. Sci Rep, 9(1), 6082. doi: 10.1038/s41598-019-42625-9 [DOI] [PMC free article] [PubMed] [Google Scholar]
- Snowden J, Neary D, & Mann D (2007). Frontotemporal lobar degeneration: clinical and pathological relationships. Acta Neuropathol, 774(1), 31–38. doi: 10.1007/s00401-007-0236-3 [DOI] [PubMed] [Google Scholar]
- Spinelli EG, Mandelli ML, Miller ZA, Santos-Santos MA, Wilson SM, Agosta F, … Gorno-Tempini ML (2017). Typical and atypical pathology in primary progressive aphasia variants. Ann Neurol, 81(3), 430–443. doi: 10.1002/ana.24885 [DOI] [PMC free article] [PubMed] [Google Scholar]
- Tsai RM, Bejanin A, Lesman-Segev O, LaJoie R, Visani A, Bourakova V, … Rabinovici GD (2019). (18)F-flortaucipir (AV-1451) tau PET in frontotemporal dementia syndromes. Alzheimers Res Ther, 11(1), 13. doi: 10.1186/s13195-019-0470-7 [DOI] [PMC free article] [PubMed] [Google Scholar]
- Tu S, Leyton CE, Hodges JR, Piguet O, & Hornberger M (2016). Divergent Longitudinal Propagation of White Matter Degradation in Logopenic and Semantic Variants of Primary Progressive Aphasia. J Alzheimers Dis, 49(3), 853–861. doi: 10.3233/jad-150626 [DOI] [PubMed] [Google Scholar]
- Warrington EK (1975). The selective impairment of semantic memory. Q J Exp Psychol, 27(4), 635–657. doi: 10.1080/14640747508400525 [DOI] [PubMed] [Google Scholar]
- Whitwell JL, Martin PR, Duffy JR, Clark HM, Machulda MM, Schwarz CG, … Josephs KA (2019). The influence of beta-amyloid on [(18)F]AV-1451 in semantic variant of primary progressive aphasia. Neurology. doi: 10.1212/wnl.0000000000006913 [DOI] [PMC free article] [PubMed] [Google Scholar]
- Xia CF, Arteaga J, Chen G, Gangadharmath U, Gomez LF, Kasi D, … Kolb HC (2013). [(18)F]T807, a novel tau positron emission tomography imaging agent for Alzheimer’s disease. Alzheimers Dement, 9(6), 666–676. doi: 10.1016/j.jalz.2012.11.008 [DOI] [PubMed] [Google Scholar]
Associated Data
This section collects any data citations, data availability statements, or supplementary materials included in this article.
Supplementary Materials
Supplementary Figure 1. Box-plots, with individual data points, of percentage of change in cortical thicknesses for individual patients and controls. Patients are represented as the same color as in other figures. Beta-amyloid positive patient is noted with an open circle. Note: Amyg = Amygdala, Broca = Broca’s area, ERC = entorhinal cortex, Fus = fusiform gyrus, Ins = insula, Orb Cort = orbitofrontal cortex, Pref Cort = prefrontal cortex, Temp Inf = inferior temporal gyrus, and Temp Mid = middle temporal gyrus.
Supplementary Figure 2. Plot of annualized change in flortaucipir SUVR, without partial volume-correction, by region and hemisphere. Each colored line represents an individual patient; values are connected to facilitate visualization. Patients are represented as the same color as in Figure 2. Dark underlaid black line represents the median change in the control cohort (solid line) or SD cohort (dashed line). Note: Amyg = Amygdala, Broca = Broca’s area, ERC = entorhinal cortex, Fus = fusiform gyrus, Ins = insula, Orb Cort = orbitofrontal cortex, Pref Cort = prefrontal cortex, Temp Inf = inferior temporal gyrus, Temp Mid = middle temporal gyrus, and Temp Pole = temporal pole.
Supplementary Figure 3. Box-plots, with individual data points, of percentage of change in flortaucipir SUVR for individual patients and controls. Data presented with two-compartment partial volume-correction. Patients are represented as the same color as in other figures. Beta-amyloid positive patient is noted with an open circle. Note: Amyg = Amygdala, Broca = Broca’s area, ERC = entorhinal cortex, Fus = fusiform gyrus, Ins = insula, Orb Cort = orbitofrontal cortex, Pref Cort = prefrontal cortex, Temp Inf = inferior temporal gyrus, Temp Mid = middle temporal gyrus, and Temp Pole = temporal pole.
Supplementary Figure 4. Box-plots, with individual data points, of percentage of change in flortaucipir SUVR for individual patients and controls, without partial volume correction. Patients are represented as the same color as in other figures. Beta-amyloid positive patient is noted with an open circle. Note: Amyg = Amygdala, Broca = Broca’s area, ERC = entorhinal cortex, Fus = fusiform gyrus, Ins = insula, Orb Cort = orbitofrontal cortex, Pref Cort = prefrontal cortex, Temp Inf = inferior temporal gyrus, Temp Mid = middle temporal gyrus, and Temp Pole = temporal pole.