Abstract
Objectives:
This study evaluated taurine (TAU) effects on autophagy, apoptosis and oxidative stress in mice Leydig TM3 cells.
Methods:
We treated TM3 cells with TAU (100 µg/mL) or 3-Methyladenine (3-MA, an autophagy inhibitor) for 24 h, and assessed cell viability, testosterone level, oxidative stress, apoptosis, and autophagy.
Results:
The results showed that TAU markedly increased cell viability, testosterone levels, expression of autophagy-related genes and percentage of LC3-II-positive cells. TAU significantly reduced malondialdehyde (MDA) contents and reactive oxygen species (ROS) levels and increased the activities of SOD (superoxide dismutase) and CAT (Catalase) enzymes in the TM3 cells. TAU in the presence of autophagy inhibitor (3-MA) increased oxidative stress and decreased testosterone levels.
Conclusion:
The results showed that autophagy might be involved in TAU-increased testosterone levels in mice Leydig TM3 cells.
Keywords: Leydig cells, taurine, autophagy, oxidative stress, testosterone
INTRODUCTION
Taurine (TAU) is a free amino acid that is present in several mammalian tissues (De Luca et al., 2015; Park et al., 2002; Yang et al., 2010). TAU is present in some foodstuff, such as fish and meat and often added to energy drinks. TAU has several physiological functions including energy storage, membrane stabilization, antioxidation and xenobiotic conjugation (Huxtable, 1992). In male reproductive organs, TAU is present in Leydig cells, and in some other cells (Yang et al., 2010). Lobo et al. (2000) reported that TAU stimulated testosterone secretion in vivo and in vitro. Despite its importance, we still do not know the impact of TAU in Leydig cells.
Leydig cells produce testosterone in testicular tissues, where autophagy is active (Yi & Tang, 1999). In autophagy, microtubule-associated protein-1 light chain (LC3-I) converts to a lipid form, termed LC3-II, by a complex of Atg5, Atg12, and Atg16 proteins to induce autophagosome. Mammalian rapamycin (mTOR) regulates autophagy by activating several autophagy-related proteins, including Beclin-1, Atg1, Atg5, and Atg7 (He & Klionsky, 2009). Autophagy regulates ROS buildup by increasing the clearance of damaged organelles and activating antioxidant enzymes in the Leydig cells (Li et al., 2011).
In the present study we investigated the TAU effect on oxidative stress, autophagy, apoptosis, and testosterone level in the mouse Leydig TM3 cells.
MATERIALS AND METHODS
Experimental design
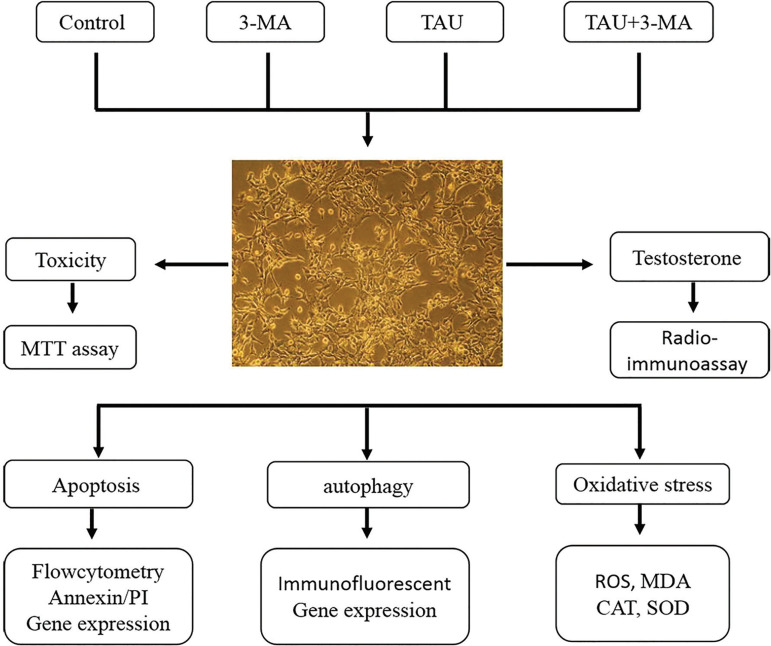
The mice Leydig TM3 cell line was bought through the National Center for Genetic and Biological Reserves in Iran. We cultured the cells in DMEM medium, complemented with 10% fetal bovine serum and 1% penicillin/streptomycin at 37ºC within a moist atmosphere with 5% CO2. The cells were incubated with TAU (Sigma) at various concentrations for 12, 24, 48 and 72h, as a pilot study (Table 1). The cells were grouped into 4 categories (Figure 1):
Table 1.
Viability percentage in TM3 cells at different doses and duration times of TAU treatment (pilot study).
| Treatments | 12 h | 24 h | 48 | 72 |
|---|---|---|---|---|
| 12.5µg/mL | 99.4 ± 4.5 | 98.7 ± 4.7 | 98.6 ± 2.2 | 100.4 ± 3.2 |
| 25 µg/mL | 98.3 ± 4.8 | 101.5 ± 3.2 | 102.2 ± 5.3 | 102.6 ± 5.1 |
| 50 µg/mL | 99.2 ± 3.5 | 105.7 ± 6.9 | 105.6 ± 4.2 | 104.3 ± 6.4 |
| 100 µg/mL | 98.6 ± 5.5 | 135.2 ± 11.2* | 138.1 ± 9.3* | 132.8 ± 9.8* |
| 150 µg/mL | 98.8 ± 4.3 | 136.4 ± 12.2* | 137.3 ± 10.7* | 134.6 ± 12.3* |
| 200 µg/mL | 99.2 ± 3.6 | 136.7 ± 10.7* | 137.8 ± 11.3* | 135.1 ± 10.7* |
Values are expressed as mean ± SD (n=6).
p<0.05 *symbol indicates comparison to 12h in each row
Figure 1.
Schematic illustration of the study design
Control: received only media for 24h
3-MA (3-Methyladenine, an autophagy inhibitor): received 10 mmol 3-MA for 24h
TAU: received 100 µg/mL TAU for 24h
TAU + 3-MA: received 10 mmol 3-MA and 100 µg/mL TAU for 24h
Cell viability
We cultured the TM3 (1 × 10⁴ cells/well) cells in 96-well plates. After treating them, the supernatants were disposed of and we added 20 µL of MTT solution (5 mg/ml) to all of the wells and incubated for four hours at 37ºC. Upon completion of incubation, the medium was eliminated, and we added 100 µL of DMSO to all of the wells. We used a micro-plate reader (BioRad, USA) to measure absorbance at 570 nm.
Testosterone assay
We incubated the cell suspensions with TAU or 3-MA in the presence of hCG (0.05IU/ml) at 37ºC for 24h. We measured the testosterone concentration in culture media via a radio-immunoassay, complying with the manufacturer`s guidelines (Monobind, USA).
Annexin V-FITC/propidium iodide apoptosis assay
We seeded the TM3 cells (1.0×10⁶/mL) in a six-well culture plate, and normal, apoptotic and necrotic cells were distinguished using an Annexin V-FITC/propidium iodide assay kit (Ebioscience™ Annexin V Kit, USA) according to the manufacturer’s instruction. We analyzed the samples using a flow cytometer (BD Facscalibur, USA). We analyzed the data using the FlowJo V10.
Immunocytochemistry
After treating the TM3 cells, we deposited them over a glass coverslip and let it stabilize for fifteen minutes in a 4% para-formaldehyde in PBS at 4ºC. Then, we washed them in PBS. We used anti-LC3-II antibody (sc-16755, Santa Cruz) at 1/100 dilution overnight at 4ºC. After washing twice in PBS, we incubated the section with FITC-conjugated anti-mice secondary anti-body (sc-2356, Santa Cruz) for one hour at room temperature. The fluorescence pictures were captured by a fluorescence microscope (Olympus, Japan).
Real-Time Polymerase Chain Reaction
The whole RNA was drawn out from the cells via the RNeasy Mini kit (Qiagen) in accordance with the Company's guidelines. We synthesized cDNA using a cDNA synthesis kit from total RNA regarding the manufacturer's instruction. About 2 µL of cDNA boosted in each 25 µL PCR reaction mix, which contains 10.1 µl DEPC water, 0.2 µL of each 10pM forward and reverse primers, and 12.5 µL of 2x SYBR Green Master Mix [Fermentas, Canada] (Table 2). PCR was amplified in forty cycles through this protocol: 95ºC for ten minutes, 95ºC for fifteen seconds, 95ºC for thirty seconds, and 60ºC for thirty-four seconds. We used the 2ΔΔCT method to analyze the data.
Table 2.
Primer sequences.
| Groups | Forward | Reverse |
|---|---|---|
| Bax | GCTGGACATTGGACTTCCTC | ACCACTGTGACCTGCTCCA |
| Bcl-2 | GGATGCCTTTGTGGAACTGT | TCACTTGTGGCCCAGATAGG |
| Beclin-1 | CGGTTTTTCTGGGACAACAA | AAAAACGTGTCTCGCCTTTC |
| mTOR | TATTCACCTCCTGCCTCACC | TGTGATGGCTGTGAAGATCC |
| Atg5 | CCAGAAAAAGACCTTCTGCACT | CAATCCCATCCAGAGTTGCT |
| LC3-II | GATAATCAGACGGCGCTTGC | ACTTCGGAGATGGGAGTGGA |
| GAPDH | ACCCAGAAGACTGTGGATGG | TTCTAGACGGCAGGTCAGGT |
Determining MDA content, ROS level and anti-oxidant enzyme activity
We treated the TM3 cells with TAU or 3-MA for 24h. Afterwards, we performed the lysis of the gathered specimens, and the protein contents of the TM3 cells we identified via a BCA protein assay kit (Pierce Biotechnology Inc. IL). Upon having the cell lysates centrifuged, we assessed the contents of malondialdehyde (MDA), Catalase (CAT), and super-oxide dismutase (SOD) activity on the basis of the related guidelines (ZellBio, GmbH, Germany). With regards to the Company's guidelines, we measured the reactive oxygen species (ROS) using a dichloro-dihydrofluorescein diacetate (DCFH-DA) determination kit (Sigma, St. Louis, MO). We measured the ROS via a spectrofluorometer (LS50B, Waltham, USA; Ex: 490 nm, Em: 570 nm).
Statistical analyses
We used the ANOVA SPSS 21.0 (Chicago, IL, USA) to analyze the data. Then, we carried out a post-hoc pair-wise comparison using the Bonferroni technique. We considered the p value ˂0.05 as statistically significant. Each experiment were done in quadruplicates.
RESULTS
Cell viability
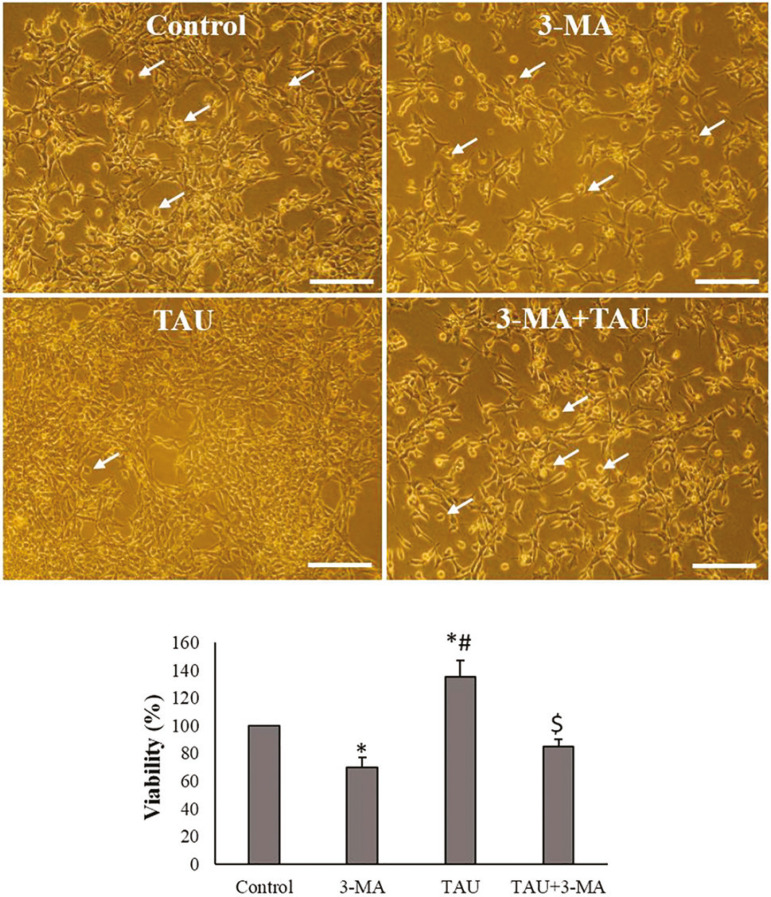
The cell viability percentage significantly decreased in 3-MA exposed TM3 cells, compared to the control cells (p<0.05). The cell viability significantly increased in TAU-treated cells, compared to the control cells (p<0.05). In the TAU + 3-MA group, the cell viability of TM3 cells significantly decreased in comparison with the TAU and 3-MA groups (Figure 2).
Figure 2.
Morphology (above images) and viability (the following pictures) of TM3 cells in experimental and control groups (Scale bar: 100 µm). The arrows indicate apoptotic morphology. The values are expressed as mean ± SD. *p<0.05, # p<0.05, $ p<0.05; *, # and the $ symbols respectively indicate comparison to the control, 3-MA and TAU groups.
Testosterone assay
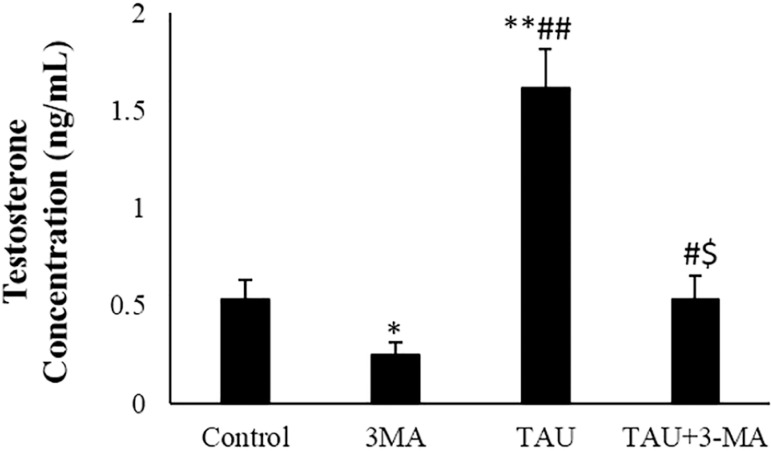
The testosterone level significantly decreased in 3-MA exposed TM3 cells when compared to the control cells (p<0.05). The testosterone concentration significantly increased in TAU-treated cells, compared to the control and 3-MA groups (p<0.01). In the TAU + 3-MA group, the testosterone level of the TM3 cells significantly decreased in comparison with the TAU-treated cells (Figure 3).
Figure 3.
Testosterone concentration in the control and experimental groups. The arrows indicate apoptotic morphology. The values are expressed as mean ± SD. *p<0.05, **P<0.01, # p<0.05, ## p<0.01, $ p<0.05; *, # and the $ symbols respectively indicates comparison to the control, 3-MA and TAU groups.
Annexin V-FITC/propidium iodide apoptosis assay
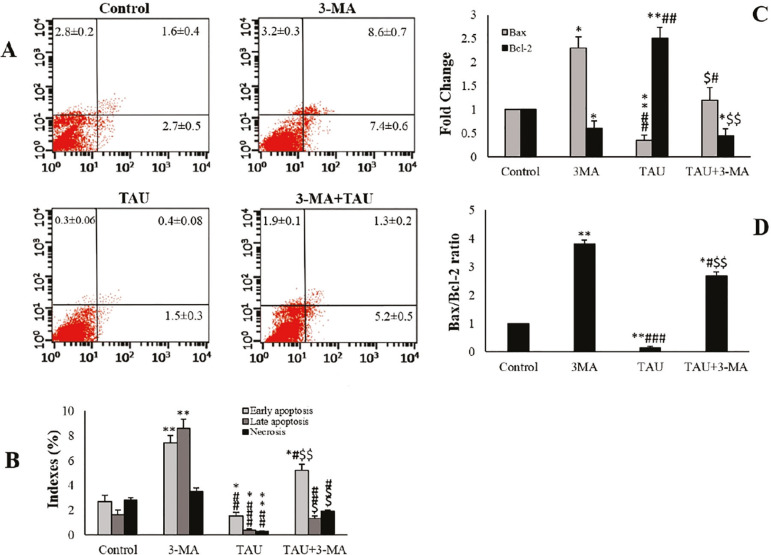
In 3-MA exposed TM3 cells, necrotic and apoptotic indices were significantly higher than those from control cells. TAU decreased the late apoptosis, necrosis, and early apoptosis percentages in TM3 cells in comparison with the control and 3-MA groups (p<0.01). In the TAU + 3-MA group, the apoptotic and necrotic indices significantly increased in comparison with TAU-treated cells (Figure 4), and significantly reduced when compared to the 3-MA-treated cells.
Figure 4.
Flow cytometry of Annexin / PI staining in the experimental & control groups. Lower left quadrant: live cells; Lower right quadrant: initial apoptosis; Upper right quadrant: late apoptosis; Upper left quadrant: necrotic cells (A and B). The relative level of mRNA expression of Bax and Bcl-2 genes and Bax/Bcl-2 ratio (C and D). The values are expressed as mean±SD. *p<0.05, **p<0.01, # p<0.05, ## p<0.01, ### p<0.001, $ p<0.05, $$ p<0.01; *, # and the $ symbols respectively indicate comparison to the control, 3-MA and TAU groups.
Quantitative Real-time RT-PCR
In 3-MA exposed TM3 cells, the expression of Bax and Bcl-2 considerably changed in comparison to the control group. In the TAU-treated cells, the expression of the Bax was considerably higher, while the expression of the Bcl-2 significantly diminished compared to the control and 3-MA groups. There was a significant increase in the expression of the Bax gene while there was a significant reduction in the expression of the Bcl-2 gene in TAU+3-MA-treated cells, compared with the controls and TAU-treated cells (Figure 4). In 3-MA exposed TM3 cells, the Bax/Bcl-2 ratio significantly increased in comparison with the control group. In the TAU-treated cells, the Bax/Bcl-2 ratio significantly decreased compared to the control and 3-MA groups. The Bax/Bcl-2 ratio significantly increased, compared with the control and TAU-treated cells (Figure 4).
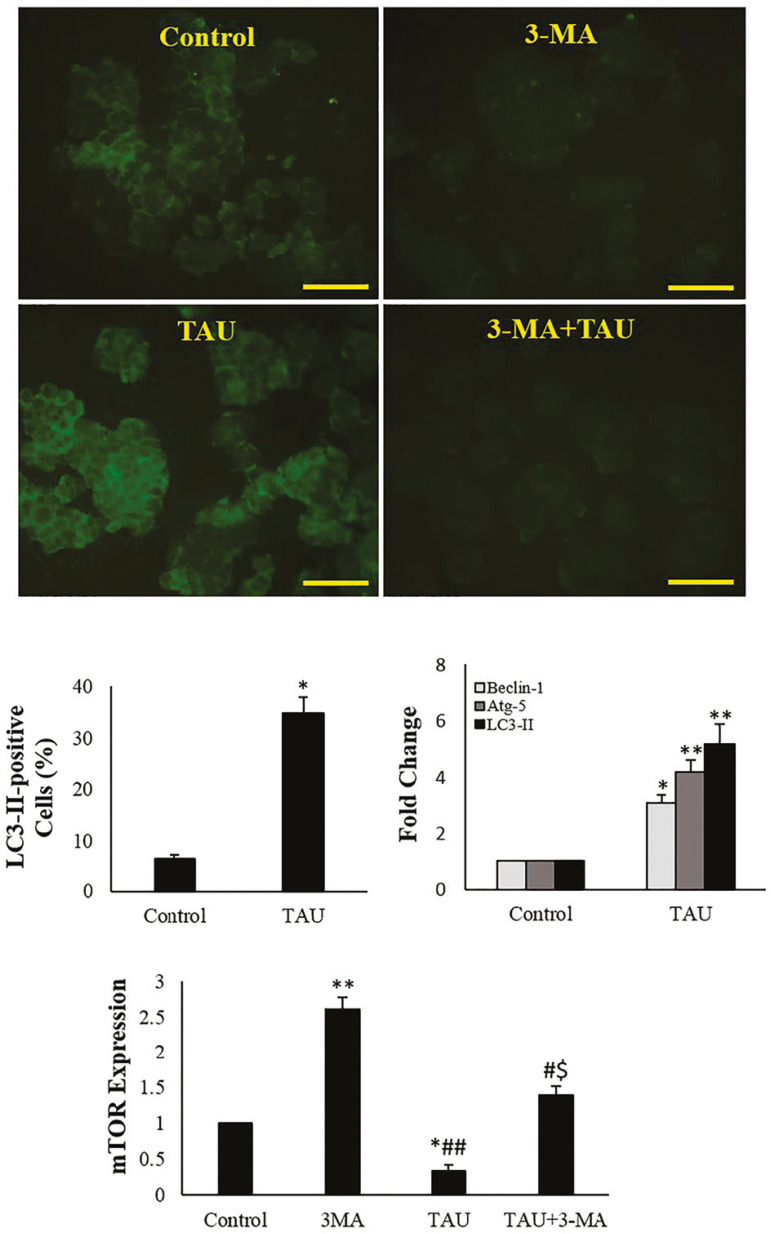
In 3-MA-treated cells, the LC3-II, Atg5 and Beclin1 genes were not expressed while the mTOR expression was significantly higher. In TAU-treated cells, the mTOR gene expression was significantly reduced while the expression of the LC3-II, Atg5 and Beclin1 genes experienced a significant increase, compared to that of control cells. In TAU+3-MA-treated cells, the mTOR expression showed a significant increase in comparison with those from the TAU-treated cells. While there was a significant reduction in mTOR expression in comparison with 3-MA-treated cells (Figure 5).
Figure 5.
Immunofluorescent microscopy of the TM3 cells, percentage of LC3-II-positive cells and expression of autophagy-related genes. The bright green staining indicates LC3-II-positive cells (scale bars: 100 µm). The values are expressed as mean±SD; *p<0.05, **p<0.01, #p<0.05, ##p<0.01, $p<0.05; *, # and the $ symbols respectively indicate comparison to the control, 3-MA and TAU groups.
Immunocytochemistry
In the 3-MA exposed TM3 cells, we did not detect LC3-II. There was a significant increase of the percentage of LC3-II-positive cells in comparison with control group (p<0.05) by TAU (p<0.05). Figure 5 depicts these results.
ROS levels, MDA content and antioxidant enzyme activity
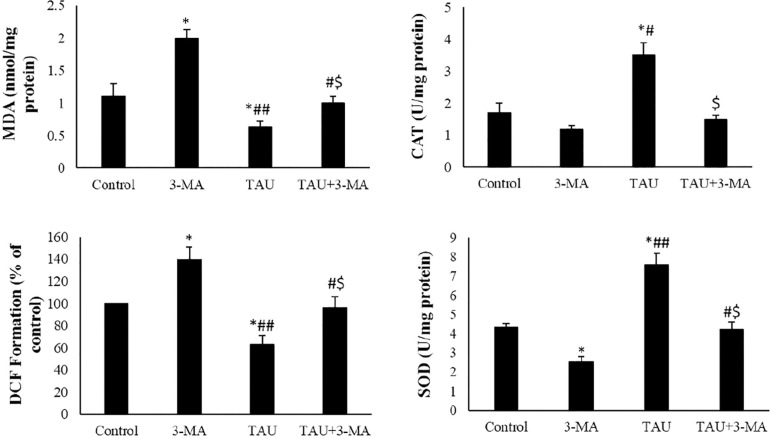
ROS level and MDA content of 3-MA exposed cells were significantly increased in comparison with those from the control group. There was a considerable reduction in MDA contents and levels of ROS in the TAU-treated cells when compared to the 3-MA and control groups (p<0.05). In the TAU+3-MA, the ROS level and MDA content significantly changed in comparison with the TAU and 3-MA groups. In the 3-MA exposed cells, CAT and SOD activity significantly decreased in comparison with the control group. In the TAU-treated cells, the antioxidant activity significantly increased in comparison with the 3-MA and control groups (p<0.05). In the TAU+3-MA, the CAT and SOD activity significantly changed in comparison with the TAU and 3-MA groups (Figure 6).
Figure 6.
MDA contents, levels of ROS (DCF formations) and activities of the anti-oxidant enzyme in the experimental and control groups. The values were expressed as mean ±SD. *p<0.05, #p<0.05, ##p<0.01, $p<0.05; *, # and the $ symbols respectively indicate comparison to the control, 3-MA and TAU groups
DISCUSSION
The present study showed that TAU increased the levels of testosterone, improved antioxidant activity, decreased ROS levels, inhibited apoptosis, and induced autophagy in TM3 Leydig cells. The results show that TAU could increase the viability percentage of TM3 cells. The increasing viability may be associated with the increasing survival of TM3, but not for the proliferation of these cells. Indeed, flow cytometry and morphology evaluations showed that TAU markedly reduced apoptosis in TM3 cells. TAU decreased the Bax/Bcl-2 ratio in the TM3 cells, also showing suppression of apoptosis. Previous studies have also reported anti-apoptotic effects of TAU in noncancerous cells (Takatani et al., 2004; Kim et al., 2009; Das et al., 2012). Aly & Khafagy (2014) showed anti-apoptotic effects of TAU against endosulfan in adult rat testicles. TAU inhibited apoptosis in Thiopurine-induced testicular damages in rats (Ramadan et al., 2018). The expression of autophagy-related genes including Beclin-1, Atg5, and LC3-II was markedly increased in the TAU-treated cells. The percentage of LC3-II-positive cells also increased in the TAU-treated cells. Kaneko et al. (2018) reported that TAU could induce autophagy in adipocytes.
In the presence of 3-MA, TAU increased the Bax/Bcl-2 ratio in comparison with the absence of 3-MA, indicating that TAU may suppress apoptosis by enhancing the autophagy process. 3-MA in the presence of TAU decreased the apoptotic index of TM3 cells, in comparison with the absence of TAU. This finding indicated that TAU could also suppress apoptosis by involving multiple signaling pathways.
In the current study, testosterone levels dramatically increased in the TAU-treated cells, which may be associated with the increasing viability of TM3 cells or the increasing biosynthesis of androgens. Yang et al. (2010) showed that TAU could stimulate testosterone generation in cultured Leydig cells. The reducing testosterone level in 3-MA- treated cells indicated autophagy involved in testosterone production in the TM3 cells. Rapamycin (autophagy stimulator) induced an increase in testosterone concentration in rat Leydig cells, whereas 3-MA had the opposite effect (Yang et al., 2017).
Gao et al. (2018) revealed that autophagy increased cholesterol absorption by the Leydig cells and dysfunction of autophagy leads to insufficient testosterone production. Autophagy activity decreased in aged rat Leydig cells (Li et al., 2011), and testosterone levels reduced in autophagy deficiency in mice (Yoshii et al., 2016). The autophagy inhibition was accompanied by a massive loss of germ cells (González et al., 2018). By contrast, Zhang et al. (2012) showed that heat exposure caused autophagy-induced germ cell death and spermatogenesis defects in mice. In presence of TAU, 3-MA induced a marked increase in testosterone levels in comparison with the absence of TAU. Thus, other mechanisms may also activate testosterone production by TAU.
TAU increases testosterone levels and raises testicular antioxidation in diabetic rats (Liu et al., 2017). In the present study, TAU suppressed oxidative stress by reducing MDA content and ROS levels, and increasing antioxidant enzyme activity. TAU could prevent lipid peroxidation in rabbit sperm (Alvarez & Storey, 1983). TAU reversed SOD activity in oxidative stress induced by cadmium or arsenic (Sinha et al., 2008; Das et al., 2009). Higuchi et al. (2012) found that TAU enhanced SOD activity in the eel testicular tissue. TAU prevented apoptosis and oxidative stress induced by doxorubicin in rat testicles (Das et al., 2012). Reducing cell death by TAU may relate to inhibition of oxidative stress in TM3 cells. ROS generation can stimulate apoptosis signaling pathways (Redza-Dutordoir & Averill-Bates, 2016). Oxidative stress can induce apoptosis in Leydig cells (Wang et al., 2019).
CONCLUSIONS
In summary, this study showed that TAU induces autophagy and suppresses apoptosis in TM3 cells. This increasing autophagy is accompanied by increasing testosterone levels and reducing oxidative stress.
ACKNOWLEDGEMENT
A Grant (CMRC-9707) has been awarded by the research council of Ahvaz Jundishapur. The University of Medical Sciences sponsored this study. This paper is a part of MSc thesis of Shokofeh Yahyavy.
REFERENCES
- Alvarez JG, Storey BT. Taurine, hypotaurine, epinephrine and albumin inhibit lipid peroxidation in rabbit spermatozoa and protect against loss of motility. Biol Reprod. 1983;29:548–555. doi: 10.1095/biolreprod29.3.548. [DOI] [PubMed] [Google Scholar]
- Aly HA, Khafagy RM. Taurine reverses endosulfan-induced oxidative stress and apoptosis in adult rat testis. Food Chem Toxicol. 2014;64:1–9. doi: 10.1016/j.fct.2013.11.007. [DOI] [PubMed] [Google Scholar]
- Das J, Ghosh J, Manna P, Sinha M, Sil PC. Taurine protects rat testes against NaAsO(2)-induced oxidative stress and apoptosis via mitochondrial dependent and independent pathways. Toxicol Lett. 2009;187:201–210. doi: 10.1016/j.toxlet.2009.03.001. [DOI] [PubMed] [Google Scholar]
- Das J, Ghosh J, Manna P, Sil PC. Taurine protects rat testes against doxorubicin-induced oxidative stress as well as p53, Fas and caspase 12-mediated apoptosis. Amino Acids. 2012;42:1839–1855. doi: 10.1007/s00726-011-0904-4. [DOI] [PubMed] [Google Scholar]
- De Luca A, Pierno S, Camerino DC. Taurine: the appeal of a safe amino acid for skeletal muscle disorders. J Transl Med. 2015;13(243) doi: 10.1186/s12967-015-0610-1. [DOI] [PMC free article] [PubMed] [Google Scholar]
- Gao F, Li G, Liu C, Gao H, Wang H, Liu W, Chen M, Shang Y, Wang L, Shi J, Xia W, Jiao J, Gao F, Li J, Chen L, Li W. Autophagy regulates testosterone synthesis by facilitating cholesterol uptake in Leydig cells. J Cell Biol. 2018;217:2103–2119. doi: 10.1083/jcb.201710078. [DOI] [PMC free article] [PubMed] [Google Scholar]
- González CR, Muscarsel Isla ML, Vitullo AD. The balance between apoptosis and autophagy regulates testis regression and recrudescence in the seasonal-breeding South American plains vizcacha, Lagostomus maximus. PLoS One. 2018;13:e0191126. doi: 10.1371/journal.pone.0191126. [DOI] [PMC free article] [PubMed] [Google Scholar]
- He C, Klionsky DJ. Regulation mechanisms and signaling pathways of autophagy. Annu Rev Genet. 2009;43:67–93. doi: 10.1146/annurev-genet-102808-114910. [DOI] [PMC free article] [PubMed] [Google Scholar]
- Higuchi M, Celino FT, Tamai A, Miura C, Miura T. The synthesis and role of taurine in the Japanese eel testis. Amino Acids. 2012;43:773–781. doi: 10.1007/s00726-011-1128-3. [DOI] [PubMed] [Google Scholar]
- Huxtable RJ. Physiological actions of taurine. Physiol Rev. 1992;72:101–163. doi: 10.1152/physrev.1992.72.1.101. [DOI] [PubMed] [Google Scholar]
- Kaneko H, Kobayashi M, Mizunoe Y, Yoshida M, Yasukawa H, Hoshino S, Itagawa R, Furuichi T, Okita N, Sudo Y, Imae M, Higami Y. Taurine is an amino acid with the ability to activate autophagy in adipocytes. Amino Acids. 2018;50:527–535. doi: 10.1007/s00726-018-2550-6. [DOI] [PubMed] [Google Scholar]
- Kim SY, Park T, Kim HW. Inhibition of apoptosis by taurine in macrophages treated with sodium nitroprusside. Adv Exp Med Biol. 2009;643:481–489. doi: 10.1007/978-0-387-75681-3_50. [DOI] [PubMed] [Google Scholar]
- Li WR, Chen L, Chang ZJ, Xin H, Liu T, Zhang YQ, Li GY, Zhou F, Gong YQ, Gao ZZ, Xin ZC. Autophagic deficiency is related to steroidogenic decline in aged rat Leydig cells. Asian J Androl. 2011;13:881–888. doi: 10.1038/aja.2011.85. [DOI] [PMC free article] [PubMed] [Google Scholar]
- Liu H, Lin S, Lv Q, Yang Q, Wu G, Hu J, Yang J. Taurine Recovers Testicular Steroidogenesis and Spermatogenesis in Streptozotocin-Induced Diabetic Rats. Adv Exp Med Biol. 2017;975:801–811. doi: 10.1007/978-94-024-1079-2_62. [DOI] [PubMed] [Google Scholar]
- Lobo MV, Alonso FJ, del Río RM. Immunohistochemical localization of taurine in the male reproductive organs of the rat. J Histochem Cytochem. 2000;48:313–320. doi: 10.1177/002215540004800301. [DOI] [PubMed] [Google Scholar]
- Park E, Park SY, Wang C, Xu J, LaFauci G, Schuller-Levis G. Cloning of murine cysteine sulfinic acid decarboxylase and its mRNA expression in murine tissues. Biochim Biophys Acta. 2002;1574:403–406. doi: 10.1016/s0167-4781(01)00364-5. [DOI] [PubMed] [Google Scholar]
- Ramadan BK, Schaalan MF, Mahmoud ES. Protective effect of taurine on thiopurine-induced testicular atrophy in male albino rats. J Steroids Horm Sci. 2018;9:192–192. doi: 10.4172/2157-7536.1000192. [DOI] [Google Scholar]
- Redza-Dutordoir M, Averill-Bates DA. Activation of apoptosis signalling pathways by reactive oxygen species. Biochim Biophys Acta. 2016;1863:2977–2992. doi: 10.1016/j.bbamcr.2016.09.012. [DOI] [PubMed] [Google Scholar]
- Sinha M, Manna P, Sil PC. Taurine protects the antioxidant defense system in the erythrocytes of cadmium treated mice. BMB Reports. 2008;41:657–663. doi: 10.5483/bmbrep.2008.41.9.657. [DOI] [PubMed] [Google Scholar]
- Takatani T, Takahashi K, Uozumi Y, Shikata E, Yamamoto Y, Ito T, Matsuda T, Schaffer SW, Fujio Y, Azuma J. Taurine inhibits apoptosis by preventing formation of the Apaf-1/caspase-9 apoptosome. Am J Physiol Cell Physiol. 2004;287:C949–C953. doi: 10.1152/ajpcell.00042.2004. [DOI] [PubMed] [Google Scholar]
- Wang S, Ren X, Hu X, Zhou L, Zhang C, Zhang M. Cadmium-induced apoptosis through reactive oxygen species mediated mitochondrial oxidative stress and the JNK signaling pathway in TM3 cells, a model of mouse Leydig cells. Toxicol Appl Pharmacol. 2019;368:37–48. doi: 10.1016/j.taap.2019.02.012. [DOI] [PubMed] [Google Scholar]
- Yang J, Wu G, Feng Y, Sun C, Lin S, Hu J. CSD mRNA expression in rat testis and the effect of taurine on testosterone secretion. Amino Acids. 2010;39:155–160. doi: 10.1007/s00726-009-0388-7. [DOI] [PubMed] [Google Scholar]
- Yang W, Li L, Huang X, Kan G, Lin L, Cheng J, Xu C, Sun W, Cong W, Zhao S, Cui S. Levels of Leydig cell autophagy regulate the fertility of male naked mole-rats. Oncotarget. 2017;8:98677–98690. doi: 10.18632/oncotarget.22088. [DOI] [PMC free article] [PubMed] [Google Scholar]
- Yi J, Tang XM. The convergent point of the endocytic and autophagic pathways in Leydig cells. Cell Res. 1999;9:243–253. doi: 10.1038/sj.cr.7290023. [DOI] [PubMed] [Google Scholar]
- Yoshii SR, Kuma A, Akashi T, Hara T, Yamamoto A, Kurikawa Y, Itakura E, Tsukamoto S, Shitara H, Eishi Y, Mizushima N. Systemic Analysis of Atg5-Null Mice Rescued from Neonatal Lethality by Transgenic ATG5 Expression in Neurons. Dev Cell. 2016;39:116–130. doi: 10.1016/j.devcel.2016.09.001. [DOI] [PubMed] [Google Scholar]
- Zhang M, Jiang M, Bi Y, Zhu H, Zhou Z, Sha J. Autophagy and apoptosis act as patterns to induce germ cell death after heat stress in mice. PLoS One. 2012;7:e41412. doi: 10.1371/journal.pone.0041412. [DOI] [PMC free article] [PubMed] [Google Scholar]


