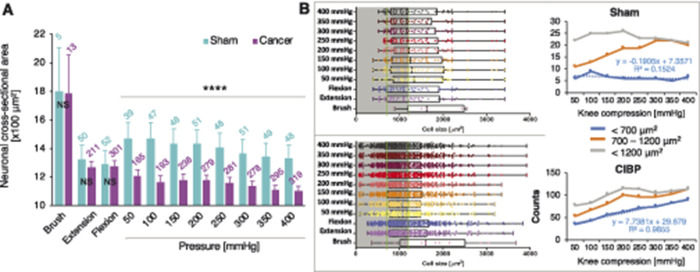
Figure 3.
More small-diameter afferents respond to increasing leg compression. Cell size analysis of all responders during dynamic brushing of the leg surface, leg movement along the body axis (first pull and push shown), and knee compression in sham and cancer animals. Pressure was increased in 50-mm Hg steps every 10 seconds. Data represent the mean ± SEM (shaded areas). Number of cells analysed are above each bar. Brush, extension, and flexion (first pair): unpaired t test: NS, nonsignificant, knee compression: Kruskal–Wallis for independent samples: ****P < 0.0001 (vs sham) (A). Left panels depict cell size distributions in sham (top) and CIBP (bottom) of all responders to different stimuli. Green lines highlight cell size separators used: <700 µm2 (small cells), >700 < 1200 µm2 (medium cells). Right panels show a summary count of responders to the increased knee compression within each cell size range. Sham (top), CIBP (bottom). Note that the number of small-diameter responders increase linearly with the pressure surge (B). CIBP, cancer-induced bone pain.

