Abstract
Covalent adaptable hydrogels (CAHs) reversibly adapt their structure in response to external stimuli, emerging as a new platform for biological applications.Due to the unique and complex nature of these materials, a characterization technique is needed to measure the rheology of these CAHs in biological processes. μ2rheology, microrheology in a microfluidic device, is a technique that can fully characterize real-time CAH degradation in a changing environment, such as the pH environment of the GI tract. This characterization will enable design and tailoring of these materials for controlled and targeted oral drug delivery. Using μ2rheology, we can exchange the fluid environment without sample loss and measure the change in CAH rheological properties. We show degradation kinetics and material property evolution are independent of degradation history. However, the initial cross-link density at each pH exchange can be decreased by degradation history which decreases the time for the CAH to degrade to the gel-sol transition. These results indicate that CAH degradation can be tuned by changing the initial material properties by varying polymer concentration and ratio of functional groups. We also show that μ2rheology will enable the design of new dynamic materials for targeted drug delivery by enabling these materials to be characterized and tailored in vitro.
Graphical Abstract
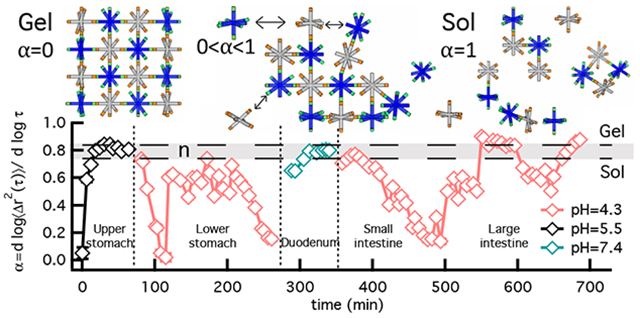
Dynamic covalent chemistry is used in the design of stimuli-responsive scaffolds including covalent adaptable hydrogels (CAHs). In CAHs, these chemistries form covalent network bonds that are remodeled when pushed out of equilibrium in response to external stimuli, such as mechanical forces or environmental conditions1–5. Because of this dynamically evolving structure, CAHs have a wide range of potential applications including biosensors, 3D printed cell culture platforms and vehicles for drug delivery1,2,6–8. For some biological applications, scaffolds are designed to degrade. When these scaffolds degrade, bonds break but they also reform throughout this process. For a drug delivery application, this means active molecules tethered or entrapped in these materials can be released and also protected during network degradation. These dynamically evolving bonds can be exploited in CAH design as therapeutic delivery vehicles, to controllably release molecules at a target during a biological process. To inform this design, the dynamic material evolution and degradation mechanism must be understood. Our work focuses on the characterization of CAH degradation, specifically a poly(ethylene glycol) (PEG)-hydrazone CAH, as the material is degraded in the transient pH environments in the gastrointestinal (GI) tract, which is enabled by a novel characterization technique.
To investigate the material property evolution and degradation mechanism of our CAH, a unique experimental platform μ2rheology, microrheology in a microfluidic device, is used to design experiments that mimic the temporal pH environment in the GI tract. During these experiments, this technique enables precise characterization of the material rheology9,10. We use passive microrheology to characterize CAH scaffold degradation in response to temporal pH changes. These measurements are taken in a microfluidic device that enables consecutive buffer exchange with minimal sample loss. Experiments are designed to characterize CAH degradation in pHs ranging from acidic (pH 4.3) to physiological conditions (pH 7.4) and mimic the average pH in each part of the native GI tract and temporal pH changes to measure CAH degradation as it would move through the digestive process.
As this material is consecutively degraded in each pH environment, we determine the impact of degradation history (whether the material has been previously degraded) on scaffold degradation and re-gelation. From these measurements, we determine that the degradation kinetics (the rate that bonds break and reform) and evolution of material properties (the change in rheology during degradation) are not changed by degradation history. However, the initial cross-link density at each pH exchange can be decreased by degradation history, which decreases the time to reach the gel-sol transition.
The dynamic covalent chemistry in our hydrogel is a hydrazone linkage. We use a PEG-hydrazone scaffold, originally developed by the Anseth group. Their work shows that this CAH scaffold is cytocompatible and is promising for applications including as a 3D cell culture platform and a tissue mimic12,13. Since this is a pH-responsive hydrogel matrix, our work is interested in exploring the viability of this scaffold as a delivery vehicle in the GI tract4,11. Additionally, other work has explored the potential of hydrazone CAHs for injectable drug delivery at different pHs14,15. However to date, there is little work focused on covalent adaptable hydrogels in oral drug delivery. Our CAH is composed of 8-arm star PEG-hydrazine (Mn 10 000 g mol−1) that covalently cross-links with an 8-arm star PEG-aldehyde (Mn 10 000 g mol−1)12,16. The chemical reaction is shown in Figure 1a. All hydrogels are made at a 1:1 stoichiometric ratio of hydrazine to aldehyde. The composition of our material is 4.4 wt% PEG-hydrazine, 4.4 wt% PEG-aldehyde, 0.04% solids per volume of 1 μm fluorescently labeled carboxylated polystyrene probe particles (2a = 1.0 ± 0.02 μm where a is the radius, Polysciences Inc.) and 200 mM pH 7.4 HEPES buffer (4-(2-hydroxyethyl)-1-piperazineethanesulfonic acid, Fisher Scientific). 1 μm probe particles are dispersed in the polymer precursor solution to enable microrheology measurements. The material is a stable covalent cross-linked gel at equilibrium12,13. Cross-links begin to break and reform when the hydrazone reaction is pushed out of chemical equilibrium by a change in pH, this shift is similar to shearing the material resulting in dynamic evolution of the structure. A schematic of PEG-hydrazine degradtaion is shown in Figure 1b. Our work focuses on determining the dynamic rheological properties of the evolving scaffold when the pH environment temporally mimics the GI tract.
Fig. 1.
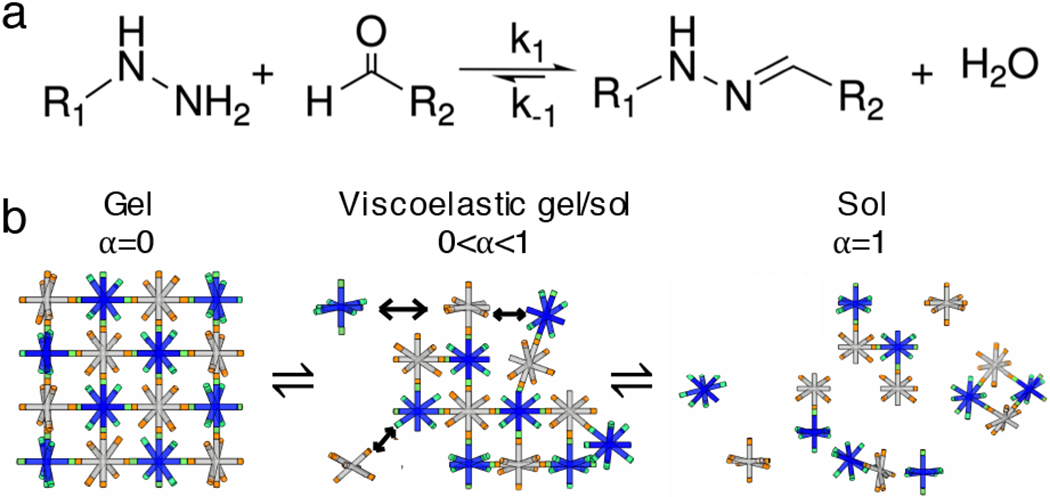
Covalent adaptable hydrazone cross-linked hydrogel. (a) The reaction scheme of hydrazine and aldehyde. (b) Schematics of a self-assembled CAH hydrazone scaffold between 8-arm PEG-aldehyde (grey) and 8-arm PEG-hydrazine (blue) and its dynamic network rearrangement.
To mimic changes in pH of the GI tract and simultaneously characterize CAH degradation, μ2rheology is used. This technique uses multiple particle tracking microrheology (MPT) to characterize material in a microfluidic device. In MPT, fluorescently labeled probe particles are embedded in the material and their Brownian motion is captured using video microscopy17–19. Particle motion can be related to rheological properties, such as the creep compliance, J(t), using the Generalized Stokes-Einstein Relation , where kBT is the thermal energy and a is the particle radius4,20,21. The ensemble-averaged mean-squared displacement (MSD) is calculated from probe particle positions throughout the captured video using 〈Δr2(τ)〉 = 〈Δx2 (τ)〉 + 〈Δy2 (τ)〉 where τ is the lag time. An example of MSDs calculated for the GI tracts are shown in Figure S1 and S2 in the Electronic Supplementary Information (ESI).
The logarithmic slope of the MSD, , identifies the state of the material. When α = 1 particles are freely diffusing in a liquid, α → 0 is a measure of particles immobilized in a gel network. When 0 < α < 1 particles are in a viscoelastic sol or gel 18,19,22. During degradation, the phase transition occurs when the last sample-spanning network cluster breaks. A gel is defined as a sample-spanning network structure. Therefore, when this sample-spanning structure breaks the material transitions from a gel to a sol. The state of the material is quantitatively determined by comparing α to the critical relaxation exponent, n, which is the value of α at the phase transition, n is calculated using time-cure superposition23–27. When α > n the material is a viscoelastic sol and when α < n the material is a viscoelastic gel. When α = n the material is at the phase transition. The average n value for this PEG-hydrazone CAH is navg = 0.79 ± 0.05. This value is calculated from control experiments. In previous work, experiments of CAH degradation at a single pH (pH 4.3 and 7.4) and after a single pH exchange (pH 4.3 to 7.4 and pH 7.4 to 4.3) calculate values of n using time-cure superposition. All values of n in the previous work are found to be within error of each other. In this work, we extend the control experiments to include CAH degradation at pH 5.5, Figure S3 in the ESI. With this additional control experiment, we confirm that the n value is within error for CAH degradation at all pHs and report the average value from these experiments. This also confirms that n is a material property and is independent of degradation pH.
To mimic pH changes in the GI tract, we use a two layer microfluidic device10,11. This device creates equal pressure around the CAH to trap the material during exchange of the incubation fluid with minimal sample loss. To mimic temporal pH changes in the GI tract, multiple buffer exchanges are necessary. Figure 2a is an image of the microfluidic device and an in-depth discussion of the operation of this device is provided in the ESI and previous publications10,28. Briefly, μ2rheology experiments are set up by loading buffer solution into both layers of the device. After the entire device is filled, the CAH precursor solution is injected into the sample chamber (the first layer of the device). This is the first pH change since the CAH is made at pH 7.4 and the device is initially at pH 5.5. μ2rheology data are collected in this incubation pH. The buffer is then exchanged by continually adding new pH buffer to the solvent basin (second layer of the device) and pulling gentle suction through the suction chamber. This draws the old buffer out of the sample chamber while drawing the new buffer into the sample chamber. The entire volume of the device is exchanged 5× with the new pH buffer to ensure CAH degradation is measured at the new incubation pH. All μ2rheology measurements are measured after exchange when there is no flow in the system. Our previous work focused on validating that the use of this device provided the same degradation kinetics and rheological properties during phase transitions that are measured in a static sample chamber. We found that the microfluidic device did not change MPT measurements or material evolution. These control experiments enable the experiments presented here which characterize CAH degradation while the temporal pH environment in the GI tract is mimicked11.
Fig. 2.
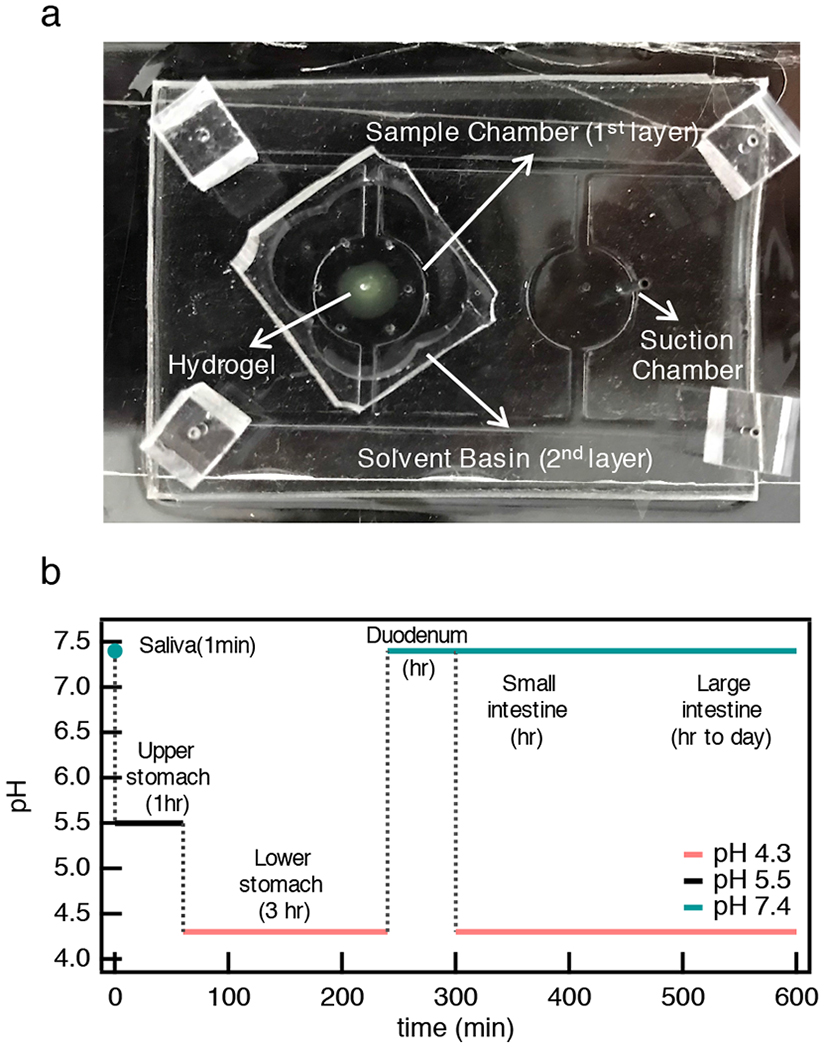
Microfluidic device used for μ2rheology measurements and experimental design. (a) A top view of our microfluidic device. The sample chamber (the first layer of the device) holds the hydrogel sample during incubation and microrheological measurements and the solvent basin (the second layer of the device) is a reservoir for the buffer solution. The sample chamber has six channels that are evenly distributed around the edge of the chamber. The incubation fluid enters the sample chamber through these six channels, creating equal pressure around the hydrogel sample trapping the material in place with minimal sample loss during fluid exchange. (b) Temporal pH changes in the GI tract. Two GI tract schemes have been designed. The color of each curve represents the pH that mimics the pH in each part of the GI tract. Black, red and green indicate pH 5.5, 4.3 and 7.4, respectively. The vertical dotted lines indicate when the buffer is exchanged.
To mimic degradation in the GI tract, we use the average pH of the native environment in each part of the digestive tract29. Similarly, the degradation time used is also the average time in each organ. Because of large variations in pH in normal and pathological conditions in the intestines, two GI tract schemes have been designed and are shown in Figure 2b. Both schemes begin the same way, a CAH is fabricated at pH 7.4 and immediately incubated at pH 5.5 for 1 hr. This mimics the pH change from saliva to the upper stomach. Next, the buffer is exchanged and the scaffold is incubated at pH 4.3 for 3 hr, mimicking the pH in the lower stomach. The next step is exchange to pH 7.4, the pH in the duodenum, for 1 hr. After this point the two degradation schemes differ. In the first scheme, incubation at pH 7.4 is continued until complete degradation. This mimics the higher range of pH in the small and large intestines. The second scheme includes an additional buffer exchange at 5 hr to pH 4.3 to mimic pathological pH conditions in the small and large intestines. Pathological conditions account for disease states such as tumor tissue growth or inflammatory bowel disease30. The scaffold is incubated at this pH until complete degradation. The total time of these experiments are different due to the difference in the time for complete scaffold degradation at pH 4.3 and 7.4.
Figure 3 is the measured degradation profile for GI tract 1. Another experiment and the MSDs are provided in Figure S5 and S1 in the ESI, respectively. The vertical dotted lines are the time when buffer is exchanged and the horizontal dashed lines indicate the gel-sol transition region, defined by the critical relaxation exponent navg = 0.79 ± 0.05. In GI tract 1, buffer is exchanged twice and CAH degradation is measured at each incubation pH. At pH 5.5, α → 0 at t = 0 min indicating the material begins as a gel. As time increases, the slope increases rapidly to α ≈ 0.5 over 6 — 10 mins indicating rapid initial degradation. When the value of α reaches 0.5, the increase in α slows and passes into the gel-sol transition region. In the transition region, there will be loss of polymer due to diffusion out of the scaffold, which results in a lower cross-link density compared to the starting material before pH 4.3 degradation begins. Buffer is then exchanged to pH 4.3, resulting in a decrease in α starting below the sol-gel transition until α ≈ 0.4 within approximate t = 14 mins (exclude the time for buffer exchange). This indicates the scaffold has regelled and undergone a short re-gelation event. After re-gelation, the slope quickly increases, indicating that the material is degrading. Once the scaffold degrades into the gel-sol transition region it then regels. This is a ‘degradation-gelation cycle’, which has been measured in our previous characterization of this CAH at pH 4.34,11. The ‘degradation-gelation cycle’ arises due to pH-dependent reaction kinetics when the scaffold is pushed out of equilibrium. At pH 4.3. the material will undergo hydrazone hydrolysis with very little simultaneous bond re-formation. Once a new equilibrium is reached in the sol phase, the reaction will shift towards hydrazone formation, resulting in the re-gelation of the scaffold4,16. Finally, buffer is exchanged to pH 7.4 at 4 hours. At this buffer exchange the scaffold is a sol. At pH 7.4, the CAH oscillates around the upper limit of the critical transition until complete degradation in three days. This is a decrease in the degradation time scale when compared to control experiments of degradation at only pH 7.4 (Figure S3c) but is the same time scale measured in a consecutively degradation experiment when the scaffold is first degraded at pH 4.3 (Figure S7)11. This result indicates that the gel has a lower cross-link density when degradation at pH 7.4 is begun because polymer has been lost in the first 4 hours of degradation due to diffusion out of the scaffold. The time to complete degradation is now similar to the average time of digestion in the GI tract (24 — 72 hrs).
Fig. 3.
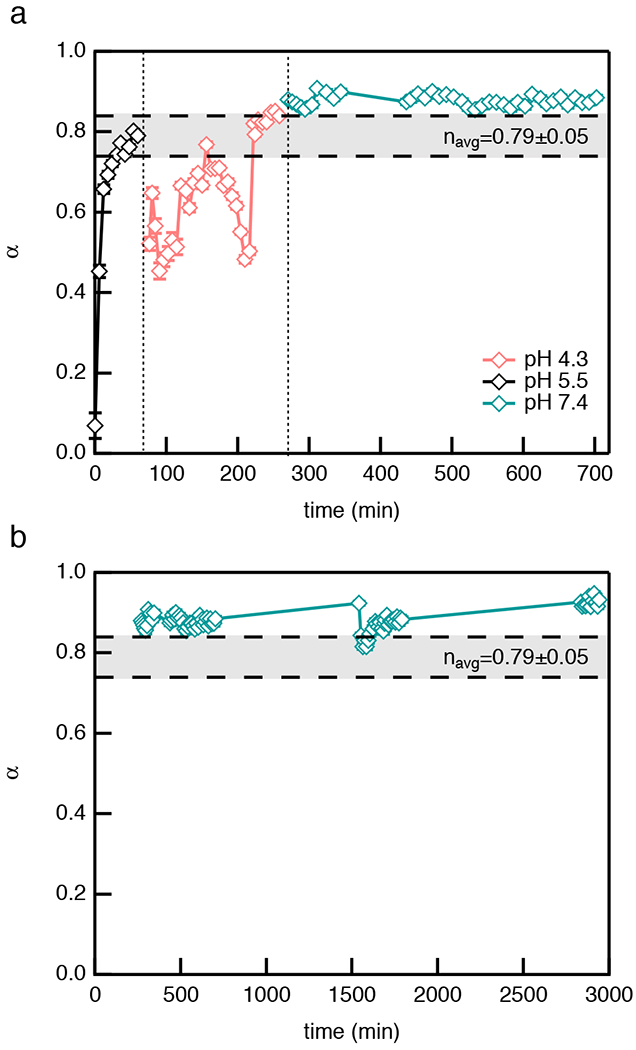
Consecutive degradation with temporal pH changes in GI tract 1. MPT measures the logarithmic slope of the MSD, α, throughout the entire degradation. The vertical dotted lines represent the time when buffer is exchanged. The horizontal dashed lines are the upper and lower n values, which bound the phase transition region determined using time-cure superposition. The plots are separated to better show the microrheological measurements taken on (a) the first and (b) second and third days of the experiment at pH 7.4.
The rheological properties presented in Figure 3a and b are compared to control experiments: (i) degradation at a single pH (control experiments at pH 4.3, 5.5 and 7.4, shown in Figure S3 in the ESI) and (ii) pH 4.3 degradation after a single pH exchange from pH 7.4 (shown in Figure S7 in the ESI). The trend in material property evolution and kinetics are similar between all experiments. Since degradation at pH 5.5 is first in GI tract 1 there is no previous degradation history and there is no change between the control experiments and GI tract 1 measurements. All experiments at pH 4.3 have degradation-gelation cycles. However, our measurements show that in GI tract 1 the time of a complete cycle, defined as the Δt between the two minimum α values, is reduced. Δt ≈ 130 mins (Table S1) in GI tract 1, while in single pH and single pH exchange experiments this value is Δt ≈ 220 mins. In GI tract 1 the time of a complete cycle is approximately 60% that of a single pH or single pH exchange experiment. The maximum α value reached in these cycles is similar in all experiments, indicating a similar amount of degradation regardless of the degradation history. This further confirms that degradation kinetics aren’t changing. The decrease in the complete cycle time is due to the degradation history, which is the previous degradation at pH 5.5. At pH 5.5, the scaffold quickly passes into the gel-sol transition region and polymer loss can occur due to polymer diffusion away from the scaffold and into the incubation fluid. Due to this, when the scaffold is incubated at pH 4.3, fewer polymers participate in bond reformation, resulting in a shorter cycle with a looser cross-linked gel structure. This also explains the shorter time to complete degradation in the final incubation buffer, pH 7.4. Shorter time to complete CAH degradation is due to the starting material at pH 7.4 being a looser cross-linked gel with a lower polymer concentration.
Figure 4 shows degradation of our CAH triggered by pH changes in GI tract 2. A second experiment and the MSDs are provided in Figure S6 and S2 in the ESI, respectively. Again, the three vertical dotted lines represent buffer exchanges and the horizontal dashed lines bound the region where the gel-sol transition occurs. In this scheme, buffer is exchanged three times. At pH 5.5, the material starts as a gel with α →0 and rapid degradation results in a value of α ≈ 0.7, similar to the first tract. Then the CAH passes the gel-sol transition. Like in GI tract 1, the material degrades to a sol resulting in a looser cross-linked scaffold before incubation in pH 4.3 begins. At pH 4.3, the material undergoes a complete degradation-gelation cycle with Δt ≈ 130 mins. The more complete re-gelation event measured in this GI tract is due to slight differences in the initial cross-link density of each scaffold, this results in difference in absolute values of α but the change in rheological properties in each process remains consistent. When buffer is changed to pH 7.4, the scaffold starts as a gel and degrades quickly to the gel-sol transition region and oscillates in this region. The third buffer exchange is to pH 4.3 to characterize degradation in the intestines under acidic conditions. In pH 4.3, the first spontaneous re-gelation event drives the scaffold back to a gel and complete cycles are again measured with Δt ≈ 130 mins, Table S1. In Figure 4, α increases after each re-gelation. This indicates that a weaker gel is forming each time but the same dynamics of material evolution are measured.
Fig. 4.
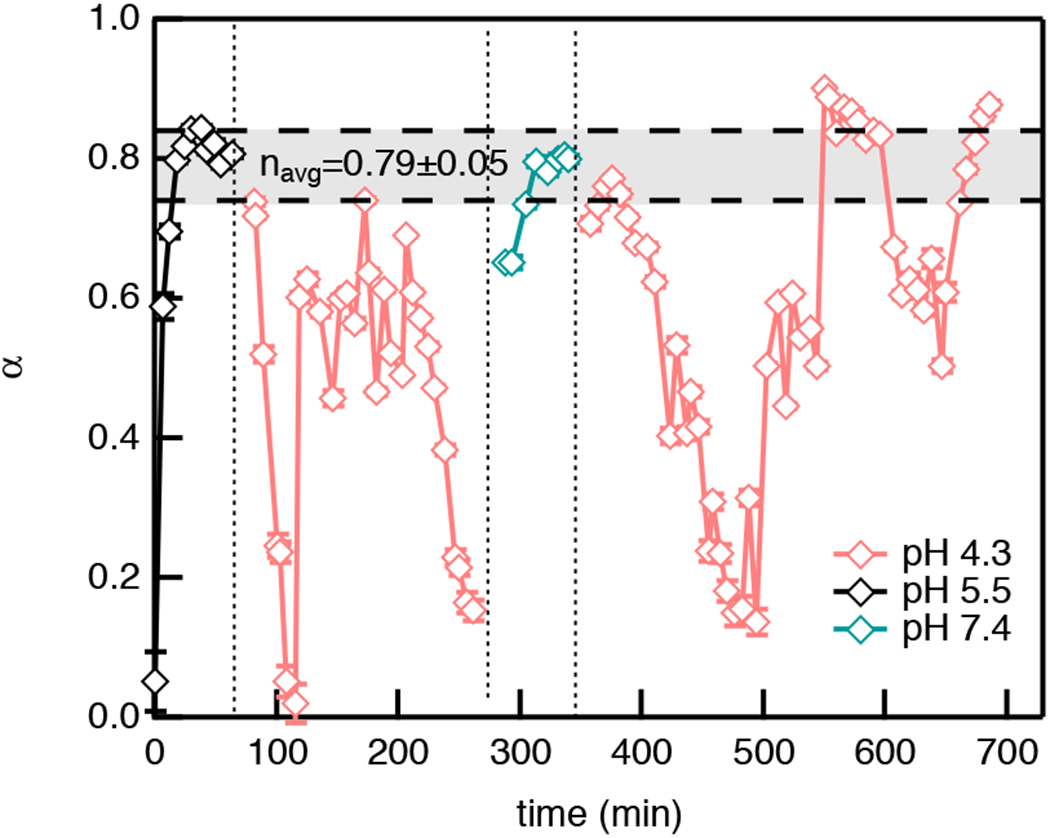
Consecutive degradation with temporal pH changes in GI tract 2. MPT measures the logarithmic slope of the MSD, α, throughout the entire degradation. The vertical dotted lines represent the time when buffer is exchanged. The horizontal dashed lines are the upper and lower n values that bound the phase transition region, which is determined using time-cure superposition.
When comparing GI tract 1 and 2, Figures 3a and 4 respectively, similar trends in CAH degradation are measured. This is not unexpected because the tracts only deviate at the third exchange in GI tract 2. A more quantitative comparison of these experiments shows that the kinetics remain the same between the two tracts prior to the final buffer exchange in GI tract 2. This quantitative analysis finds the slopes in Figure 3a and 4 for each degradation and gelation in each experiment. These slopes are the change in rheological properties over the same time intervals in an experiment, , shown in Figure 5. The error bars represent propagation of the errors for fitting the slope in each experiment. This concept is also illustrated in Figure S8 of the ESI. In Figure 5, comparing these rheological changes over time, which indicate the kinetics of either degradation or gelation, all experiments have good quantitative agreement up to the change in GI tract schemes. Although the kinetics remain the same, within experiments there are changes in the rheological properties measured due to degradation history. Figure 5 shows that degradation kinetics are unaffected by degradation history but that the amount of scaffold degradation can be tailored by changing the initial cross-link density, which would allow this scaffold to be designed for targeted drug delivery.
Fig. 5.
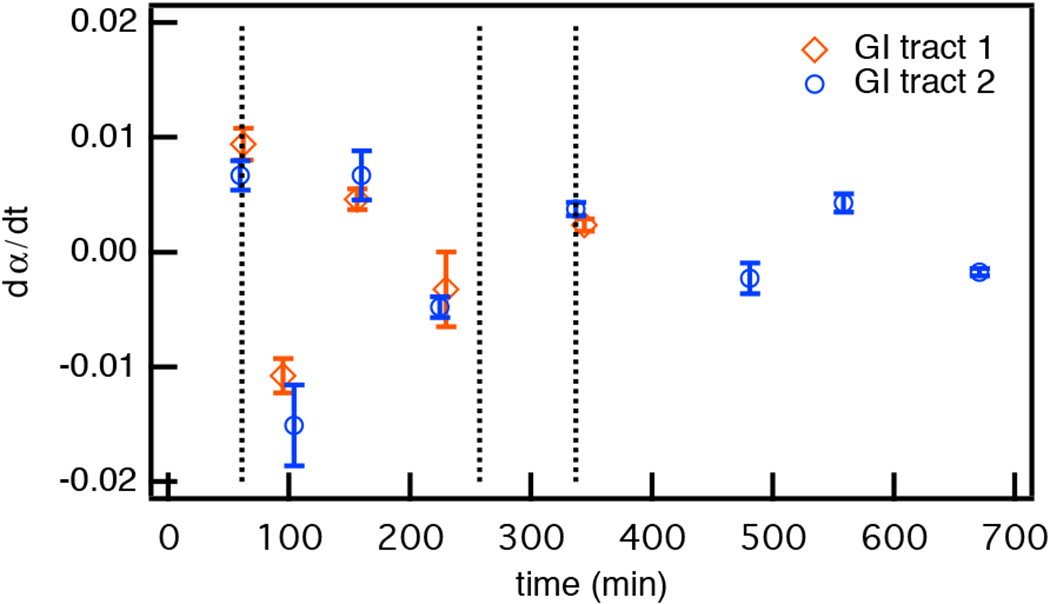
Comparing CAH degradation kinetics in both GI tract schemes. The slopes calculated from the change in rheological properties over the same time intervals during either gelation or degradation in each experiment, , are calculated. The average values of are plotted with the error bars representing the propagation of errors in fitting each segment of the data. The vertical dotted lines represents the time when each buffer is exchanged. Each symbol represents an average of at least three measurements in each tract.
This study characterizes CAH evolution as the pH is mimicked temporally through the entire GI tract. Using μ2rheology the dynamic rheological properties and structure are measured in realtime. For applications in oral drug delivery, specially chemically conjugated release of therapeutics, CAH degradation will directly drive drug release. This in-depth understanding of CAH degradation kinetics in response to pH, an environmental stimuli, will enable the design of this material for site specific drug delivery. These future investigations will tailor scaffold degradation by changing the size and functionality of the polymers and the initial scaffold cross-link density. Additionally, this work provides a technique to mimic the pH environment in a complex biological process, the GI tract, and precisely measure the kinetics and change in rheological properties of this unique material to enable the design of the scaffold for controlled, targeted oral drug delivery. Although we have used this technique for a specific application, it has broad applicability in the characterization of polymeric scaffolds that are designed to evolve during their use.
Supplementary Material
Acknowledgments
The authors would like to thank and acknowledge Prof. Kristi S. Anseth and Dr. Daniel D. McKinnon for providing materials and helpful discussions in interpreting our data. The authors also thank Dr. Matthew D. Wehrman and Dr. Maryam Daviran for helpful discussions. Research reported in this publication was supported in part by National Institute of General Medical Sciences of the National Institutes of Health under award number R15GM119065. The content is solely the responsibility of the authors and does not necessarily represent the official views of the National Institutes of Health.
Footnotes
Electronic Supplementary Information (ESI) available: [details of any supplementary information available should be included here]. See DOI: 10.1039/b000000x/
Conflicts of Interest
There are no conflicts of interest to declare.
Notes and references
- 1.McBride MK, Worrell BT, Brown T, Cox LM, Sowan N, Wang C, Podgorski M, Martinez AM and Bowman CN, Annual review of chemical and biomolecular engineering, 2019, 10, year. [DOI] [PubMed] [Google Scholar]
- 2.Wang H and Heilshorn SC, Advanced Materials, 2015, 27, 3717–3736. [DOI] [PMC free article] [PubMed] [Google Scholar]
- 3.Roberts MC, Hanson MC, Massey AP, Karren EA and Kiser PF, Advanced Materials, 2007, 19, 2503–2507. [Google Scholar]
- 4.Escobar F IV, Anseth KS and Schultz KM, Macromolecules, 2017, 50, 7351–7360. [Google Scholar]
- 5.Rowan SJ, Cantrill SJ, Cousins GR, Sanders JK and Stoddart JF, Angewandte Chemie International Edition, 2002, 41, 898–952. [DOI] [PubMed] [Google Scholar]
- 6.Li Y, Rodrigues J and Tomas H, Chemical Society Reviews, 2012, 41, 2193–2221. [DOI] [PubMed] [Google Scholar]
- 7.Rosales AM and Anseth KS, Nature Reviews Materials, 2016, 1, 15012. [DOI] [PMC free article] [PubMed] [Google Scholar]
- 8.Ulrich S, Accounts of chemical research, 2019. [Google Scholar]
- 9.Schultz KM and Furst EM, Lab on a Chip, 2011, 11, 3802–3809. [DOI] [PubMed] [Google Scholar]
- 10.Wehrman MD, Milstrey MJ, Lindberg S and Schultz KM, Lab on a Chip, 2017, 17, 2085–2094. [DOI] [PubMed] [Google Scholar]
- 11.Wu N and Schultz KM, Soft matter, 2019, 15, 5921–5932. [DOI] [PMC free article] [PubMed] [Google Scholar]
- 12.McKinnon D, Domaille D, Brown T, Kyburz K, Kiyotake E, Cha J and Anseth K, Soft Matter, 2014, 10, 9230–9236. [DOI] [PMC free article] [PubMed] [Google Scholar]
- 13.McKinnon DD, Domaille DW, Cha JN and Anseth KS, Advanced Materials, 2014, 26, 865–872. [DOI] [PMC free article] [PubMed] [Google Scholar]
- 14.Yang X, Liu G, Peng L, Guo J, Tao L, Yuan J, Chang C, Wei Y and Zhang L, Advanced Functional Materials, 2017, 27, 1703174. [Google Scholar]
- 15.Sharma PK, Taneja S and Singh Y, ACS applied materials & interfaces, 2018, 10, 30936–30945. [DOI] [PubMed] [Google Scholar]
- 16.McKinnon DD, Domaille DW, Cha JN and Anseth KS, Chemistry of Materials, 2014, 26, 2382–2387. [DOI] [PMC free article] [PubMed] [Google Scholar]
- 17.Crocker JC and Grier DG, Journal of colloid and interface science, 1996, 179, 298–310. [Google Scholar]
- 18.Mason TG and Weitz D, Physical review letters, 1995, 74, 1250. [DOI] [PubMed] [Google Scholar]
- 19.Furst EM and Squires TM, Microrheology, Oxford University Press, 2017. [Google Scholar]
- 20.Mason TG, Rheologica Acta, 2000, 39, 371–378. [Google Scholar]
- 21.Squires TM and Mason TG, Annual review of fluid mechanics, 2010, 42, year [Google Scholar]
- 22.Schultz KM and Anseth KS, Soft Matter, 2013, 9, 1570–1579. [Google Scholar]
- 23.Adolf D and Martin JE, Macromolecules, 1990, 23, 3700–3704. [Google Scholar]
- 24.Winter HH and Chambon F, Journal of rheology, 1986, 30, 367–382. [Google Scholar]
- 25.Chambon F and Winter HH, Journal of Rheology, 1987, 31, 683–697. [Google Scholar]
- 26.Schultz KM and Furst EM, Soft matter, 2012, 8, 6198–6205. [Google Scholar]
- 27.Larsen TH and Furst EM, Physical review letters, 2008, 100, 146001. [DOI] [PubMed] [Google Scholar]
- 28.Wehrman M, Milstrey M, Lindberg S and Schultz K, Journal of visualized experiments: JoVE, 2018. [DOI] [PMC free article] [PubMed] [Google Scholar]
- 29.Charman WN, Porter CJ, Mithani S and Dressman JB, Journal of pharmaceutical sciences, 1997, 86, 269–282. [DOI] [PubMed] [Google Scholar]
- 30.Holzer P, American Journal of Physiology-Gastrointestinal and Liver Physiology, 2007, 292, G699–G705. [DOI] [PMC free article] [PubMed] [Google Scholar]
Associated Data
This section collects any data citations, data availability statements, or supplementary materials included in this article.


