

Abstract
There is a growing interest for the use of coliphage as an alternative indicator to assess fecal pollution in recreational waters. Coliphage are a group of viruses that infect Escherichia coli and are considered as potential surrogates to infer the likely presence of enteric viral pathogens. We report the use of a dead-end hollow fiber ultrafiltration single agar layer method to enumerate F+ and somatic coliphage from surface waters collected from three Great Lake areas. At each location, three sites (two beaches; one river) were sampled five days a week over the 2015 beach season (n = 609 total samples). In addition, culturable E. coli and enterococci concentrations, as well as 16 water quality and recreational area parameters were assessed such as rainfall, turbidity, dissolved oxygen, pH, and ultra violet absorbance. Overall, somatic coliphage levels ranged from non-detectable to 4.39 log10 plaque forming units per liter and were consistently higher compared to F+ (non-detectable to 3.15 log10 PFU/L), regardless of sampling site. Coliphage concentrations weakly correlated with cultivated fecal indicator bacteria levels (E. coli and enterococci) at 75% of beach sites tested in study (r = 0.28 to 0.40). In addition, ultraviolet light absorption and water temperature were closely associated with coliphage concentrations, but not fecal indicator bacteria levels suggesting different persistence trends in Great Lake waters between indicator types (bacteria versus virus). Finally, implications for coliphage water quality management and future research directions are discussed.
Keywords: Great Lakes, coliphage, fecal indicators
1. INTRODUCTION
Fecal contamination of recreational waters can lead to public health concerns due to the potential presence of enteric pathogens. Fecal indicator bacteria such as E. coli and enterococci are routinely used to monitor fecal contamination in recreational waters, however, research suggests that the causative agent of many waterborne illnesses is likely viral pathogens (Begier et al. 2008, Cabelli et al. 1982, Sinclair et al. 2009, Soller et al. 2010). Considering that persistence of fecal bacteria and viral pathogens can differ in surface water environments (Ashbolt et al. 2001, Vergara et al. 2015), the addition of a virus-based indicator may be more useful for recreational water quality monitoring. Many studies suggest that coliphage, particularly F+ phage, may be a more suitable indicator of human viral pathogens associated with fecal contamination due to similarities in morphology, composition, persistence in the environment, and degradation during waste treatment processes (Gerba 1987, Havelaar et al. 1993, King et al. 2011, Palmateer et al. 1991, Rose et al. 2004). Coliphage are viruses that infect E. coli and are divided into somatic and F+ (male-specific) groups based on the modes of infection of a host bacterial cell. Further subdivisions create seven major morphological groups; four of which contain somatic coliphage and three F+ phages (Cole et al. 2003, Mesquita et al. 2010). Both coliphage types are generally found in the gut of human and other warm-blooded animals (McMinn et al. 2017a) and can be routinely detected in sewage (Ewert and Paynter 1980, Gantzer et al. 1998, Lucena et al. 2004). There are a wide array of simple and reliable culture-based methods to characterize coliphage levels [for a review see (EPA 2015)] and some are already adopted by health organizations such as the U.S. Environmental Protection Agency for microbial monitoring of ground water systems (EPA 2006).
One important factor to consider is coliphage occurrence in recreational water environments. A suitable fecal indicator should occur at concentrations high enough to measure when fecal pollution is present. Many studies report coliphage levels in polluted natural lakes, rivers, streams, and marine waters (Araujo et al. 1997, Griffith et al. 2016, Haramoto et al. 2009, Paul et al. 1997, Payment et al. 1988, Wu et al. 2011). However, many research efforts focus sampling in a single geographic location over a short time period making generalizations challenging. Broader interpretations may be possible by comparing findings from more than one study, however, when any two studies are compared, there are typically differences in detection methods, host strains used, coliphage groups tested, sampling duration, and statistical analyses used, among other important factors (Bonilla et al. 2007, WHO 2001, Wu et al. 2011). In addition, many studies rely on small sample volumes (≤ 100 mL) resulting in a large percentage of samples with low to no detectable coliphage in recreational water samples, especially for F+ phage measurements (Contreras-Coll et al. 2002, Rezaeinejad et al. 2014).
To overcome such limitations, we report the use of a dead-end hollow fiber ultrafiltration combined with single agar layer method (D-HFUF-SAL) to enumerate F+ and somatic coliphage from two-liter recreational water samples collected from three Great Lake areas (McMinn et al. 2017b). At each location, three sites were sampled five days a week (Sunday through Thursday) over the 2015 beach season. In addition, paired measurements of general fecal indicator bacteria (E. coli and enterococci), as well as 16 water quality and recreational area parameters were assessed. These data allowed for(1) simultaneous characterization of the incidence of F+ and somatic coliphage at nine different sites, (ii) evaluation of the range of coliphage measurements within and between sites over an entire beach season, (iii) comparison of coliphage and general fecal indicator bacteria data, as well as (iv) identification of key water quality and recreational area parameters associated with coliphage levels.
2. MATERIALS AND METHODS
2.1. Recreational Area Descriptions
Three Great Lake recreational areas were identified for this study including Edgewater (ED), Grant Park (GP), and Washington Park (WP). All three areas are routinely monitored by local authorities for fecal indicator bacteria throughout the year and are historically known to experience a wide range of E. coli concentrations. At each recreational area, samples were collected at two beach sites designated ‘C = Composite’ and ‘H = Historic,’ and at a nearby discharging river site designated as ‘R = River.’ For additional information on sampling procedures, please refer below.
2.1.1. Edgewater
ED is a 130-acre land area consisting of 1,800 meters of shoreline and 270 meters of swimming beaches situated on Lake Erie in the Cuyahoga Watershed west of Cleveland, Ohio (Fig. 1, Panel A). ED is located about three kilometers west of the mouth of the Cuyahoga River. In 2013, the Northeast Ohio Regional Sewer District reported that 19% of samples collected over the recreational beach season (n = 104) exceeded the Beach Action Value (BAV) for E. coli of 190 CFU per 100 mL (Dorfman and Haren 2014). Potential sources of fecal pollution include combined sewer overflow discharge points, stormwater runoff, as well as local pets (canines) and shore birds (gulls). In addition, there are three wastewater treatment facilities within 32 kilometers of ED serving more than one million residents and treating approximately 245 million gallons per day of raw sewage.
Figure 1:
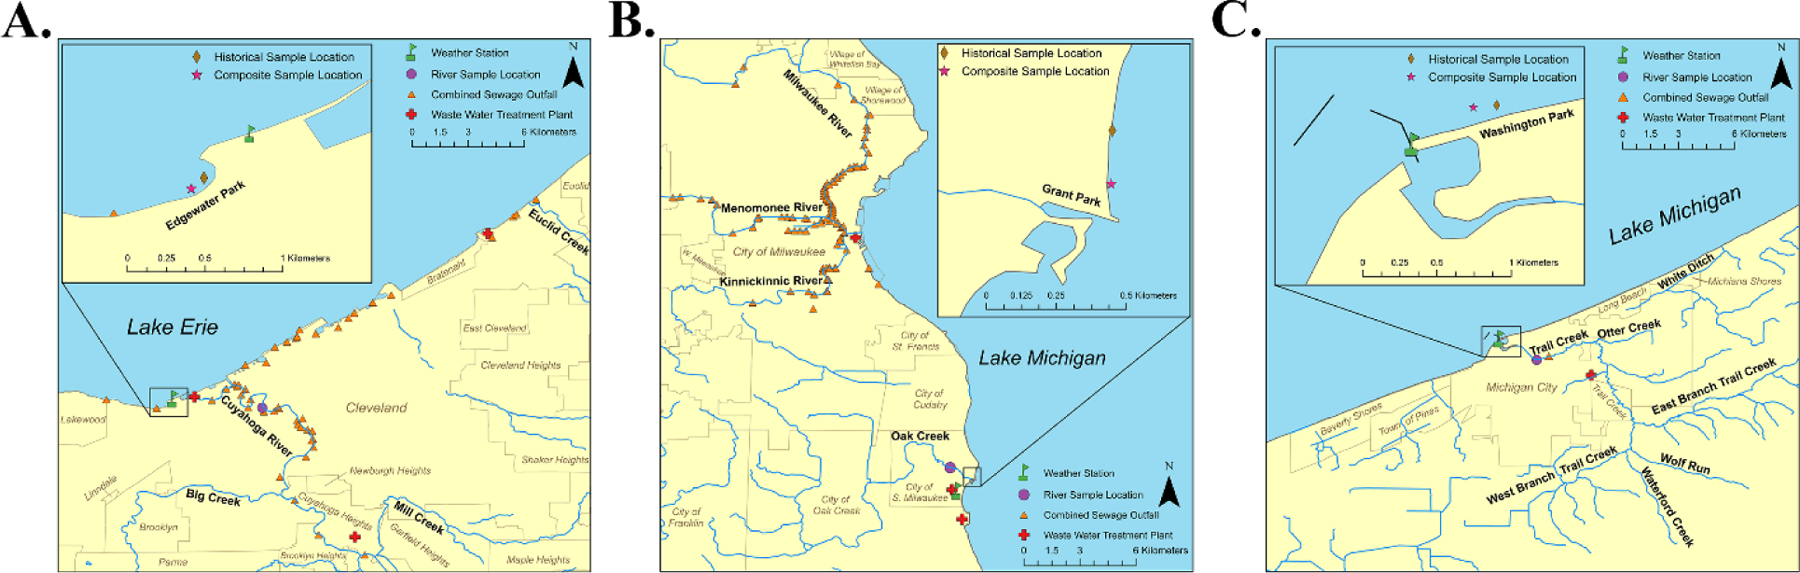
Global information system of map of Edgewater (Panel A), Grant Park (Panel B), and Washington Park (Panel C) study areas. Note that location of composite sampling sites (C) are represented by a single point in each study area.
2.1.2. Grant Park
GP is located on the boundary of the Kinnickinnic River and Oak Creek watershed along the western shore of Lake Michigan in South Milwaukee, Wisconsin (Figure 1, Panel B). GP is situated less than two kilometers south of the mouth of the Kinnickinnic River. In 2013, the National Resources Defense Council (NRDC) reported that 31% of the 42 samples collected at GP during the beach season exceeded BAV (E. coli of 190 CFU per 100 mL) (Dorfman and Haren 2014). Possible sources of fecal pollution include combined sewer overflow discharges, urban stormwater runoff, faulty septic systems, as well as local pets and shore birds (e.g. gulls). In addition, there are four wastewater treatment facilities within 30 kilometers of GP serving a large proportion of the Milwaukee population and treating 200 to 900 million gallons per day of raw sewage.
2.1.3. Washington Park
WP is a public beach area with 1,100 meters of shoreline located along the southern portion of Lake Michigan in Michigan City, Indiana (Fig. 1, Panel C). WP is adjacent to the mouth of Trail Creek and is part of the Trail Creek watershed which empties into Lake Michigan Harbor. In 2013, the NRDC reported that 12% of the 297 samples collected at WP during the beach season exceeded the BAV for E. coli of 190 CFU per 100 mL (Dorfman and Haren 2014). Potential fecal pollution sources include a wastewater treatment facility, agricultural runoff (ruminants), urban stormwater runoff, faulty septic systems, as well as local pets and shore birds.
2.2. Water Sampling
Surface water samples for fecal indicator testing were collected from nine different sites (three per recreational area) and consisted of a beach composite (C; 6 separate 1L grabs), beach historical (H; single 4L grab), and river (R; single 4L grab). All water samples were collected in strict accordance with standard methods recommended in Section 9060 of Standard Methods for the Examination of Water and Wastewater (American-Public-Health-Association 1998). Sampling occurred during the 2015 beach season (June to September) between 8am and 10am, five days a week (Sunday-Thursday) for a period of 14–15 weeks in a given recreational area. Samples were collected by three local laboratories including Northeast Ohio Regional Sewer District (ED), City of Racine Health Department (GP), and Scientific Methods Inc (WP). Each composite sample consisted of six grab samples arranged along two transects parallel to the respective beach shoreline corresponding to two sampling depths including 0.3m (3 grab samples) and 1m (3 grab samples). Transects were arranged in a parallel fashion with each sample location situated 50m apart with the center sample coinciding with the most heavily used swimming area (data not shown). For each composite sample, equal sample volumes were mixed (total volume = 6L) in a sterilized container prior to fecal indicator testing. Beach historical samples (H) were collected at the respective location used by local management groups to monitor recreational water quality (Fig. 1). River samples (R) were collected in each recreational area (Fig. 1) 1m from bank at a depth of 0.3m below the surface. All samples were transported on ice and fecal indicator bacteria enumeration was performed by the three local laboratories within 4 hours of collection. Coliphage C, H, and R water samples (2L each) were transported to the U.S. Environmental Protection Agency research facility (Cincinnati, OH) on ice in sterilized containers. Coliphage samples were eligible for testing only if received within 48-hours of sample collection and shipping temperature was maintained at ≤ 4°C. Shipping temperature was monitored with iButton® temperature loggers DS1920 according to manufacturer’s procedures (Maxim Integrated, San Jose, CA).
2.3. Water Quality and Recreational Area Parameters
Water quality parameters, as well as physical and chemical properties, were measured directly from collected water samples. Water quality parameters included water temperature (°C), turbidity (NTU), dissolved oxygen (DO), conductivity (µmhos/cm), pH, ultraviolet absorbance at 254 nm (UV_254; 1/m) and dissolved organic carbon (DOC; mg-C/L). Recreational area parameters refer to meteorological information, lake water conditions, and beach usage data. These data are not paired with a particular water sample, but instead are representative of all samples collected in a specific recreational area (EW, GP, or WP) on a particular day. Recreational area parameters included wind speed (km/h), wind direction (ø), air temperature (°C), wave height (m), rainfall (mm), as well as total number of humans, birds and dogs at the beach at the time of sampling. Please refer to supplemental material for a complete listing of measuring instruments (Table S1). Solar insolation incident on a horizontal surface (kWh/m2/day) and daylight cloud coverage (%) information was retrieved from the National Aeronautics and Space Administration Atmospheric Science Data Center (http://eosweb.larc.nasa.gov/).
2.4. Fecal Indicator Bacteria Measurements
E. coli counts (most probable number [MPN] per 100 mL of water sample) were obtained using Colilert Quantitray (Idexx, Westbrook, ME). Enterococci concentrations (colony forming unit [CFU] per 100 mL of water sample) were determined by membrane filtration on mEI agar (USEPA 2009). Control tests with double distilled H2O substituted for surface water were conducted every sampling day at each laboratory location.
2.5. Coliphage Measurements
A D-HFUF-SAL method was used to enumerate F+ and somatic coliphage from surface waters (plaque forming units [PFU] per 1L) as described elsewhere (McMinn et al. 2017b). Briefly, 2L of water sample was passed through an Asahi Kasei Rexeed® 15S single-use high-flux dialyzer (Dial Medical Supply, Chester Springs, PA) using peristaltic pump at 300 rpm setting. Filters were eluted with 200 mL of solution (0.01% Tween 80, 0.01% sodium hexametaphosphate, 0.001% Antifoam Y-30; Sigma-Aldrich, St. Louis, MO). Concentrated samples (~200 mL) were heated to 36°C and divided into equal volumes for somatic and F+ coliphage testing. The single agar layer procedure was then performed as reported in EPA method 1602 (USEPA 2001). Positive (MS2 F+ coliphage and ϕX174 for somatic coliphage) and negative controls (method blanks and media sterility checks) were performed each day of testing. In addition, spike and recovery controls were tested with surface water collected from each sampling site yielding an average of 66 ± 13.4% recovery (refer to Supplemental Material for details). Total coliphage (somatic coliphage PFU/L + F+ coliphage PFU/L) was calculated for data analyses, except Zero-inflated poisson (ZIP) regression. All statistical calculations were performed using SAS software (Cary, NC).
2.6. Data Analysis
An analysis of variance (ANOVA) test was used to compare mean indicator concentrations grouped by recreational area and site. A Levene’s test for homogeneity of variance was used to evaluate variability within each group of measurements to determine eligibility for ANOVA testing. Simple linear regression was used to generate correlation coefficients (r) between indicator paired measurements. A t-test was used to compare indicator means for paired data sets organized into groups with E. coli concentrations less than or greater than the U.S. Environmental Protection Agency recommend BAV of 235 MPN/100mL (USEPA 2012). F+ coliphage were not included in ANOVA, simple linear regression, or t-test calculations due to a high frequency of non-detects.
2.6.1. Model Averaging
A model averaging approach was used for E. coli, enterococci, somatic coliphage, and total coliphage (sum of somatic and F+ paired measurements) to investigate trends between indicator concentrations and respective water quality and recreational area parameters using the SAS procedure ‘PROC GLMSELECT’ with adaptive LASSO selection (Zou 2006), and the Schwarz Bayesian information criterion (Judge et al. 1985, Schwarz 1978). Bootstrap sampling was used to draw 100 samples (with replacement) for the first round. If a covariate was selected at least 35% of the time in the first round, it was retained for the second. Resampling was performed without replacement to generate 1,000 samples and the average model was obtained by averaging the ordinary least squares estimates. Model R2 was calculated using the average model parameter estimates.
2.6.2. Zero-Inflated Poisson
ZIP regression was used for F+ coliphage data consisting of a two-component mixture model with one component a Poisson model and the other a distribution concentrated at zero. The ZIP model is given by:
Where, the model parameter ω is the probability that Y is zero, and the parameters β0, β1, β2 … βk are (linear) regression coefficients of ln(λ) against the covariates X1, X2…Xk. SAS procedure ‘PROC FMM’ and a maximum likelihood estimation method were used to estimate the model parameters. For given Y= yi, and provide the unadjusted and adjusted predicted mean estimates (for yi), respectively. Unadjusted and adjusted model R2 were calculated for log10 transformed Y data, i.e total and residual sum of squares were calculated for the log10(yi), and , i = 1,2, …n, data. Note that zero count data (yi = 0) was not included in R2 calculations. For both modeling approaches, all water quality and recreational parameters were examined at beach sites (C and H), while bird, human, and dog counts and wave height were excluded from R sites regardless of the modeling approach as these data sets are specific to the beach setting.
3. RESULTS
3.1. Coliphage and Fecal Indicator Bacteria Measurements
Paired fecal indicator measurements were recorded from 609 water samples collected over a beach season from nine sampling sites in the Great Lakes region (Fig. 2). Somatic and F+ coliphage (log10 PFU/L), as well as E. coli (log10 MPN/L) and enterococci (log10 CFU/L) summary statistics are reported in Table 1. Somatic coliphage concentrations ranged from −0.1 (GP) to 4.39 (WP) log10 PFU/L across sampling sites with the highest average in the ED recreational area (2.63 log10 PFU/L). Average F+ coliphage concentrations were much lower compared to somatic ranging from 0.74 (GP) to 0.93 (ED) log10 PFU/L. The frequency of non-detects across recreational areas ranged from 1% (GP) to 5% (ED) for somatic and 16.3% (WP) to 23.2% (GP) for F+ coliphage. Measurable levels of E. coli and enterococci were present in all samples tested ranging from 1.61 log10 MPN/L (WP) to 5.59 log10 MPN/L (ED) for E. coli and 1.0 log10 CFU/L (ED) to 5.90 log10 CFU/L (WP) for enterococci. A Levene’s test for homogeneity comparing the variance in each indicator measurement type (E. coli, enterococci, or somatic coliphage) grouped by recreational area (WP, ED, or GP) and site (R, C, and H) showed no significant difference across all data combinations (p ≥ 0.125), except for three instances including ED E. coli (MPN/L), ED enterococci (CFU/L), and WP enterococci (CFU/L) (p ≤ 0.0082). For all eligible combinations, an ANOVA revealed that R sampling sites were significantly different (p < 0.05) from beach sites (C and H) and that there was never a significant difference between C and H sites (p > 0.05) regardless of indicator, recreational area and sample site data groupings.
Figure 2:

Scatter plot showing temporal measurements of E. coli (MPN/L), enterococci (CFU/L), somatic coliphage (PFU/L), and F+ coliphage (PFU/L) in the Edgewater (Panel A), Grant Park (Panel B), and Washington Park (Panel C) recreational areas. Shaded black squares indicate a rain event. Red dashed lines represent the U.S. Environmental E. coli beach action value of 235 MPN/100mL (note adjusted to 2,350 MPN/L).
Table 1:
Summary statistics for coliphage and fecal indicator bacteria measurements by study area
| Recreational Area | Indicator | n | % Non-Detects | Min | Max | Mean |
|---|---|---|---|---|---|---|
| Edgewater (ED) | Somatic | 192 | 5.0% | 0.75 | 4.28 | 2.63 |
| F+ | 193 | 18.7% | −0.04 | 3.15 | 0.93 | |
| E. coli | 199 | 0.0% | 1.85 | 5.59 | 3.24 | |
| Enterococci | 199 | 0.0% | 1.00 | 5.49 | 2.83 | |
| Grant Park (GP) | Somatic | 206 | 1.0% | −0.10 | 4.08 | 2.21 |
| F+ | 207 | 23.2% | −0.09 | 3.08 | 0.74 | |
| E. coli | 211 | 0.0% | 2.00 | 5.60 | 3.11 | |
| Enterococci | 219 | 0.0% | 1.30 | 5.24 | 3.00 | |
| Washington Park (WP) | Somatic | 183 | 4.9% | 0.29 | 4.39 | 2.30 |
| F+ | 184 | 16.3% | −0.11 | 2.84 | 0.87 | |
| E. coli | 191 | 0.0% | 1.61 | 5.64 | 3.21 | |
| Enterococci | 191 | 0.0% | 2.00 | 5.90 | 3.35 |
Units of measure include log10 PFU/L (Somatic and F+), log10 MPN/L (E. coli), and log10 CFU/L (enterococci).
‘n’ refers to total number of samples tested.
‘Min’ and ‘Max’ indicate the minimum and maximum concentrations observed, respectively.
3.2. Water Quality and Recreational Area Parameter Measurements
Paired measurements of seven water quality parameters are summarized in Table S2. On average, UV_254 (2.1 1/m), turbidity (28.4 NTU), and water temperature (22.3°C) were largest at the ED recreational area. GP yielded the highest averages for pH (8.4) and conductivity (724.6 µmhos/com), while DOC (10.0 mg/L) and DO (94.4 mg/L) averages were largest at WP. Ten recreational area parameters were also measured over the course of the study (Table S3). Human, birds, and dogs were present at all three recreational areas over the course of the study with the highest average counts at WP for human (643 individuals/day) and birds (259 individuals/day). Average dog counts ranged from 0.1 to 0.5 individuals per day across all recreational areas. Precipitation levels were highest on average at the ED recreational area with a maximum of 35.7 mm of total rainfall over a 72-h period. Wave height at beach sites (C and H) ranged from 0 to 1.2 meters over the course of the study across all recreational areas. In addition, solar radiation averaged from 4.3 to 6.13 kWh/m2/day while average cloud cover ranged from 51.6% to 67.3% across recreational areas.
3.3. Correlations between Fecal Indicators
Correlation coefficients (r) were calculated using simple linear regression for all eligible indicator data combinations (Table 2) to characterize the strength of association between somatic coliphage, total coliphage, E. coli, and enterococci. In all instances correlations were significant (p ≤ 0.034), except for enterococci pairings with somatic coliphage and total coliphage at the WP site (p ≥ 0.061). Correlations were unsurprisingly highest between somatic coliphage and total coliphage (0.99 to 1.00), regardless of recreational area. E. coli and enterococci data combinations were consistently high (0.88 to 0.93) at R sites, but exhibited a wide range at beach sites (0.39 to 0.87). Somatic coliphage and total coliphage followed a similar trend with higher correlations with E. coli and enterococci at R sites (0.55 to 0.79), but much lower associations at beach sites (0.28 to 0.53). The two lowest observed correlation values for somatic coliphage and enterococci were at beach sites from the WP (0.28) and GP (0.35) recreational areas, while the poorest associations between somatic coliphage and E. coli were at WP (0.29) and ED (0.30).
Table 2:
Simple linear regression correlation coefficient values for all coliphage and fecal indicator bacteria pairings
| River Site (R) | Historic Site (H) | Composite Site (C) | ||||||||
|---|---|---|---|---|---|---|---|---|---|---|
| ENT | SC | TC | ENT | SC | TC | ENT | SC | TC | ||
| Edgewater (ED) | EC | 0.90(67) | 0.78(64) | 0.79(64) | 0.87(66) | 0.30(63) | 0.31(63) | 0.76(66) | 0.37(64) | 0.39(64) |
| ENT | --- | 0.69(64) | 0.70(64) | --- | 0.32(63) | 0.33(63) | --- | 0.36(64) | 0.37(64) | |
| SC | --- | --- | 1.00(64 | --- | --- | 1.00(64) | --- | --- | 1.00(64) | |
| Grant Park (GP) | EC | 0.88(68) | 0.70(67) | 0.70(67) | 0.79(70) | 0.52(68) | 0.53(68) | 0.79(71) | 0.44(68) | 0.44(68) |
| ENT | --- | 0.67(66) | 0.67(66) | --- | 0.43(68) | 0.43(68) | --- | 0.35(68) | 0.37(68) | |
| SC | --- | --- | 1.00(68) | --- | --- | 0.99(68) | --- | --- | 0.99(68) | |
| Washington Park (WP) |
EC | 0.94(63) | 0.58(56) | 0.58(56) | 0.39(63) | 0.40(53) | 0.29(55) | 0.57(64) | 0.29(56) | 0.29(56) |
| ENT | --- | 0.55(57) | 0.56(57) | --- | * | * | --- | 0.28(56) | 0.29(56) | |
| SC | --- | --- | 1.00(60) | --- | --- | 1.00(54) | --- | --- | 1.00(56) | |
Values indicate correlation coefficient (r) from simple linear regression modeling. Parentheses show the number of paired measurements.
indicates no significant correlation found (p > 0.05). EC = E. coli (MPN/L), ENT = enterococci (CFU/L), SC = somatic coliphage (PFU/L), and TC = total coliphage (PFU/L).
3.4. E. coli Advisories and Indicator Measurements
There was a total of 230 E. coli advisories across all samples based on the recommended U.S. Environmental Protection Agency 2012 Recreational Water Quality Criteria BAV of 235 MPN/100mL for a single measurement (Table 3). The frequency of site advisories ranged from 9.4 % (WP, site C) to 92.9% (GP, site R). Sixty-nine percent of all E. coli advisories occurred at R sites (n = 130). Comparisons of somatic coliphage, total coliphage, and enterococci mean concentrations in water samples grouped by E. coli advisory status were performed to determine whether the use of these alternative indicators could result in a similar water quality management trend. Findings indicate that mean enterococci concentrations were significantly higher in samples under E. coli advisory, regardless of sampling site (p ≤ 0.026; Table 3). However, a different pattern was observed when a similar comparison was done with somatic coliphage and total coliphage. The somatic and total coliphage concentrations were not significantly higher in samples under E. coli advisory at three sampling sites (p ≥ 0.096; Table 3).
Table 3:
Summary of sampling sites subject to E. coli advisory under the U.S. EPA Recreational Water Quality Criteria Beach Action Value (235 MPN/100mL) and comparison of respective somatic coliphage and enterococci concentrations.
| Site | n | >235 MPN | % Advisories | Somatic (PFU) p-value | Total Coliphage (PFU) p-value | Enterococci (CFU) p-value | |
|---|---|---|---|---|---|---|---|
| Edgewater (ED) | Composite | 66 | 24 | 36.4 | 0.1034 | 0.1027 | 0.0002 |
| Historic | 66 | 11 | 16.7 | 0.0084 | 0.0105 | <.0001 | |
| River | 67 | 35 | 52.2 | < 0.0001 | < 0.0001 | <.0001 | |
| Grant Park (GP) | Composite | 71 | 12 | 16.9 | 0.0129 | 0.0114 | <.0001 |
| Historic | 70 | 9 | 12.9 | 0.0135 | 0.0158 | < 0.0001 | |
| River | 70 | 65 | 92.9 | 0.1109 | 0.1100 | 0.0140 | |
| Washington Park (WP) | Composite | 64 | 6 | 9.4 | 0.0070 | 0.0062 | 0.0041 |
| Historic | 64 | 10 | 15.6 | 0.0965 | 0.4212 | 0.0259 | |
| River | 63 | 58 | 92.1 | 0.0309 | 0.0277 | 0.0030 |
‘n’ refers to total number of samples. ‘> 235 MPN’ indicates number of samples with E. coli concentrations greater than the U.S. EPA Recreational Water Quality Criteria Beach Action Value (235 MPN/100mL). Bolded p-values indicate no significant difference (p > 0.05) between respective mean indicator concentrations.
3.5. Trends in Water Quality and Recreational Area Parameters
Two strategies were employed to identify potential trends between fecal indicator measurements and water quality and recreational area parameters. A model averaging approach was used for E. coli, enterococci, somatic coliphage, and total coliphage, while a ZIP regression approach was used for F+ coliphage.
3.5.1. Model Averaging Approach
After 1,000 iterations for each indicator combination (4 indicator types x 9 sites), a total of 36 models were generated with fitted model metrics (R2) ranging from 0.82 (WP, site R, enterococci) to 0.19 (WP, site H, E. coli) with 61.5% of models (n = 26) exhibiting R2 values greater than 0.6 (Fig. 3). The top seven best fit models were for bacterial indicators (R2 from 0.69 to 0.82). The best fit model employing a coliphage indicator yielded an R2 of 0.68 (GP, site R, somatic coliphage). Of the top 10 best fit models, 70% were from R sites (0.67 to 0.82), while the ten poorest fit models (R2 ≤ 0.41) were all from beach sites (C or H). Across all models, a total of 101 significant covariates (p < 0.05) were identified (Table 4). Overall, rain metrics (n = 27), conductivity (n = 15), and turbidity (n = 14) were the most commonly identified covariates. The most frequent covariates at R sites were rain metrics, conductivity, and DOC (22 of 30). At beach sites, rain metrics and turbidity were the most prevalent covariates (29 of 71). Human counts were a significant covariate in only two instances, both at the GP recreational area (site C for enterococci and E. coli). In addition to human counts at GP, bird counts were also a significant covariate for both beach sites (C and H) across all indicator types. In contrast, bird counts were never a significant covariate at WP, and in only one model at the ED recreational area (enterococci, C site). Patterns also emerged when covariate trends were examined by bacterial and viral indicator groupings. The most common significant covariates for bacterial indicators (enterococci and E. coli) were rain metrics (n = 11), turbidity (n = 10) and conductivity (n = 7). The most prevalent covariates for viral indicators (somatic and total coliphage) exhibited a similar pattern to bacteria with rain metrics (n =16) and conductivity (n = 8), but with one key difference being the influence of UV_254 (n = 6). At beach sites (C and H), UV_254 was a significant covariate in six models for coliphage, but never for bacterial indicators. In addition, water temperature was also only significant for somatic and total coliphage models (n = 4), regardless of site type (C, H, or R).
Figure 3:

Fitted model R2 organized by recreational area and site. A model averaging was used for E. coli, enterococci, somatic coliphage, and total coliphage indicators. A zero-inflated poisson (ZIP) regression strategy was employed for F+ coliphage.
Table 4:
Significant water quality and recreational area parameters (p < 0.05) for E. coli (log10 MPN/L), enterococci (log10 CFU/L), somatic coliphage (log10 PFU/L), and total coliphage (log10 PFU/L).
| Indicator | Recreation Area | Site | Water Quality and Recreational Area Parameters |
|---|---|---|---|
| Enterococci (Log10 CFU/L) |
Edgewater | C | conductivity, turbidity, rainfall (72hr) |
| H | DOC, DO, turbidity, bird count | ||
| R | rainfall (72hr, 48hr), turbidity | ||
| Grant Park | C | rainfall (72hr), bird count, wave height | |
| H | rainfall (48hr, 24hr), turbidity, bird count | ||
| R | DOC, rainfall (48hr), conductivity, wind direction | ||
| Washington Park | C | Air temperature, conductivity, DO, human count | |
| H | turbidity | ||
|
E. coli (Log10 MPN/100L) |
Edgewater | C | turbidity |
| H | conductivity, DO, pH, turbidity | ||
| R | DOC, rainfall (72hr, 48hr), conductivity | ||
| Grant Park | C | bird count, wave height | |
| H | rainfall (48hr), bird count, wave height | ||
| R | DOC, UV_254, conductivity, wind direction | ||
| Washington Park | C | turbidity, human count | |
| H | turbidity | ||
| R | rainfall (72hr), conductivity, turbidity | ||
| Somatic Coliphage (Log10 PFU/L) |
Edgewater | C | UV_254, rainfall (72hr, 24hr), conductivity, water temperature, wave height |
| H | UV_254, rainfall (24hr), DO | ||
| R | rainfall (72hr) | ||
| Grant Park | C | rainfall (72hr), conductivity, bird count | |
| H | rainfall (72hr), bird count | ||
| R | DOC, conductivity, water temperature | ||
| Washington Park | C | DOC, UV_254, turbidity | |
| H | rainfall (72hr), turbidity | ||
| R | rainfall (72hr), pH | ||
| Total Coliphage (Log10 PFU/L) |
Edgewater | C | UV_254, rainfall (72hr, 24hr), conductivity, water temperature, wave height |
| H | UV_254, rainfall (48hr, 24hr), DO | ||
| R | rainfall (72hr), conductivity | ||
| Grant Park | C | rainfall (72hr), conductivity, bird count | |
| H | rainfall (72hr), conductivity, bird count | ||
| R | DOC, conductivity, water temperature | ||
| Washington Park | C | DOC, UV_254, turbidity | |
| H | turbidity | ||
| R | rainfall (72hr) |
Parameters in bold indicate a negative correlation with respective indicator. Sites include composite (C), historic ((H), and river (R). Parameter abbreviations include dissolved organic carbon (DOC) and UV_254 (ultraviolet absorption at 254 nm).
3.5.2. ZIP Regression
ZIP regression modeling for each site exhibited a broad range of adjusted R2 values (Fig. 3). Fig. 4 depicts an example data output for site H in the WP recreational area. The best fit models for F+ coliphage were both at R sites yielding an adjusted R2 value of 0.61 (ED and WP), while all remaining models had much lower correlations with fits less than 0.46 (Table 5). The best fit models at beach sites were found at WP (site H, R2 = 0.46) and ED (site H, R2 = 0.42) recreational areas. Across all F+ models, 79 significant covariates (p < 0.05) were identified with turbidity (n = 7), DOC (n = 7), wind direction (n = 7), and cumulative rain after 72 h (n = 8) occurring the most often (total of 9 models possible; Table 5). UV_254 was a significant covariate in two thirds of F+ models (n = 6), while water temperature was only significant in three models. Dog counts were a significant covariate at WP and ED beach sites, but not at GP. Human counts were significant covariates at GP and ED beach sites, but not WP. Bird counts were significant only in the GP recreational area at the H beach site.
Figure 4:

Example of zero-inflated poisson (ZIP) regression results using the historical beach site (H) in the Washington Park (WP) recreational study area. Shaded circles represent adjusted, predicted F+ coliphage log10 PFU/L incorporating non-detect information. Unshaded circles denote predicted, not adjusted F+ coliphage log10 PFU/L values when non-detects are ignored.
Table 5:
Zero-inflated poisson regression results comparing F+ log10 PFU/L measurements with water quality and recreational area parameter data.
| Recreation Area | Site | n | Fitted Model R2 | Significant Covariates (p < 0.05) | |
|---|---|---|---|---|---|
| Adjusted | Not Adjusted | ||||
| Edgewater | C | 64 | 0.231 | 0.231 | pH, conductivity, turbidity, water temperature, DOC, rainfall (72hr, 48hr, 24hr), dog counts, air temperature, wind direction, wave height |
| H | 63 | 0.419 | 0.365 | DO, turbidity, rainfall (72hr), human count, dog count, air temperature, wave height | |
| R | 65 | 0.612 | 0.591 | pH, conductivity, DO, turbidity, rainfall (72hr, 48hr, 24hr), DOC, UV_254, air temperature, wind direction | |
| Grant Park | C | 66 | 0.356 | 0.349 | pH, conductivity, DO, turbidity, water temperature, DOC, rainfall (72hr, 48hr), UV_254, human count, wind direction, wave height |
| H | 65 | 0.115 | 0.110 | pH, DO, rainfall (72hr, 48hr), DOC, UV_254, bird count, wind direction | |
| R | 64 | 0.388 | 0.355 | pH, conductivity, DO, turbidity, water temperature, DOC, rainfall (72hr, 48hr), UV_254, air temperature, wind direction | |
| Washington Park | C | 53 | 0.228 | 0.261 | pH, DO, turbidity, DOC, UV_254, dog count, wind direction |
| H | 55 | 0.456 | 0.424 | conductivity, rainfall (24hr), dog count | |
| R | 55 | 0.614 | 0.609 | pH, conductivity, turbidity, DOC, rainfall (72hr, 48hr, 24hr), UV_254, wind direction | |
Parameters in bold indicate a negative correlation with respective indicator. Sites include composite (C), historic ((H), and river (R). Parameter abbreviations include dissolved organic carbon (DOC) and UV_254 (ultraviolet absorption at 254 nm).
4. DISCUSSION
4.1. Occurrence of Fecal Indicators at Great Lake Sites
To characterize the incidence of coliphage in freshwater samples from the Great Lakes region, three recreational areas were selected for study based on historic E. coli levels (Dorfman and Haren 2014). Systematic testing of river (R) and beach (C and H) samples collected from nine locations confirmed the presence of fecal pollution with E. coli concentrations greater than the U.S. Environmental Protection Agency BAV of 235 MPN/100mL in 38.3% of samples tested (Fig. 2 and Table 3). A larger proportion of E. coli advisories originated from R sites (79%) compared to beach sites (18.0%) suggesting that fecal waste transported and discharged by chronically polluted nearby rivers do not continually impact water quality at nearby beach sites. Instead, it is likely that beach site impairment is only intermittently influenced by adjacent river discharge depending on local flow and meteorological conditions. A high incidence of fecal pollution was further supported by high detection frequencies of enterococci (100%), somatic coliphage (97.9%), and F+ coliphage (80.5%) across tested sites. In general, fecal indicator bacterial concentrations were higher than coliphage regardless of recreational area or sample site (Fig. 2). In addition, when present at measurable levels, F+ coliphage were always found at a lower concentration than somatic coliphage. These trends align with other freshwater studies reporting lower concentrations of coliphage compared to fecal indicator bacteria from other geographic regions [for review see (McMinn et al. 2017a)].
4.2. Site-Dependent Relationships between Coliphage and Fecal Indicator Bacteria
Correlation analyses between fecal indicator bacteria and coliphage paired measurements suggests that local water quality and recreational area conditions may play a key role in the occurrence and persistence of fecal indicator bacteria and coliphage (Table 2). It is important to note that correlation values observed in this study should not be influenced by discrepancies in sample collection practices, time of sampling, sample number, or laboratory procedures because data were generated from the same water sample(s) using standardized procedures. Instead, differences are likely due to site-specific factors such as variations in water physical and chemical properties, source(s) of fecal indicators and persistence, and/or local recreational area parameters. In addition, correlations between bacterial indicator paired measurements (E. coli and enterococci) were almost always higher than correlations with somatic and total coliphage, supporting the notion that viral indicators exhibit different occurrence trends and may be influenced by different local factors.
Even though a wide range of correlations was observed across sites, R sites consistently yielded higher correlations between fecal indicator pairings compared to beach sites (C and H). Indicator concentrations were also consistently higher in river samples and may account for these stronger associations (Fig. 3). However, other factors could also play a key role. River waters represent a mixture of potential pollutants collected from a large drainage area consisting of different sources such as fecal waste from surface run-off, local wildlife activities, agricultural practices, and waste management operations (e.g. wastewater treatment facilities or onsite septic systems). Unlike the Great Lake beach sites, rivers are natural flowing systems providing a different set of chemical and physical parameters that could influence the concentration and persistence of fecal indicators. Different patterns of fecal indicator occurrence could suggest the need for alternative water quality management practices for river and beach locations in the Great Lake region.
4.3. Key Water Quality and Recreational Area Parameter Trends
To explore the association of water quality and recreational parameters with fecal indicator measurements, two strategies were utilized based on the frequency of non-detects in data sets. Efforts indicated a wide range of model fits (Fig. 3) and a broad spectrum of water quality and recreational area covariates significantly associated with fecal indicators (Tables 4 and 5). A close examination of findings reveals several interesting trends highlighting key differences between indicator types (bacteria versus virus) and the potential importance of the pollution source(s).
Indicator bacteria and viruses are found in fecal waste (McMinn et al. 2017b), however different occurrence trends observed between E. coli and enterococci compared to somatic, F+, and total coliphage resulted in variable association patterns with water quality and recreational area parameters tested in this study. For instance, no coliphage indicator yielded a R2 ≥ 0.70 and no bacterial indicator exhibited a R2 ≤ 0.30 suggesting that water quality and recreational area parameters are consistently better predictors of bacterial indicators compared to coliphage. Several parameters were significant regardless of indicator type such as rainfall, DOC, turbidity, and conductivity suggesting that surface run-off plays an important role in fecal pollution transport in the Great Lakes region for both bacterial and viral agents. In contrast, water temperature and UV_254 were almost exclusively associated with coliphage models (exception E. coli MPN/L at GP, R site; Table 4) supporting previous research reporting the strong influence of water temperature (Lee and Sobsey 2011, Long and Sobsey 2004, Wu et al. 2016) and exposure to sunlight (Silverman et al. 2013, Sinton et al. 2002, Wanjugi et al. 2016, Wu et al. 2016) on the survival of coliphage in the environment. Additional research is warranted to further characterize potential mechanisms by which UV_254 can influence coliphage persistence in freshwater systems and the role of other water quality conditions such as turbidity and DOC.
Another interesting factor to consider is the source(s) of fecal pollution in the Great Lake regions. Like E. coli and enterococci, somatic and F+ coliphage are shed by a broad range of animal groups (Ervin et al. 2013, McMinn et al. 2014). The total number of dogs, shore birds, and humans present at beach sites (C and H) each day at the time of sampling were recorded to identify any potential associations between fecal indicators and fecal pollution sources. Findings suggest variable fecal pollution source trends at different recreational beach locations. For example, the number of shorebirds and humans present at time of sampling was significantly associated with select fecal indicators at the GP and ED recreational beach locations, but not at WP (Table 4). In contrast, total dog counts were associated with WP and ED samples, but not GP providing valuable clues about potential sources of fecal pollution. Evidence that more than one animal fecal pollution source may be influencing water quality at these sites suggests that future fecal source identification testing could improve water quality management in these study areas.
4.4. Water Quality Management Implications
Findings also provide many insights to consider for the application of a coliphage recreational water quality indicator in the Great Lakes region ranging from sampling strategies to future research directions. Single grab or composite water sampling strategies are typically used for recreational water monitoring (USEPA 2012). In this study, both single and composite samples were collected side-by-side at each recreational beach sampling location and subject to paired measurements of four fecal indicators. A statistical comparison of indicator concentrations showed no significant difference between single grab (H) and composite (C) beach samples (p > 0.05) within a recreational area for qualifying data sets, suggesting that these different sampling strategies may likely yield similar water quality management outcomes.
In addition to sample collection practice implications, trends in coliphage occurrence suggest that any future coliphage-based water quality monitoring scenario may lead to occasionally different management outcomes compared to current E. coli fecal indicator bacteria approach employed in Great Lakes waters. This notion is supported based on direct comparisons of bacterial and coliphage indicator paired measurements (Fig. 4) and data grouping analyses based on the U.S. Environmental Protection Agency recommended E. coli BAV of 235 MPN/100mL (Table 3). However, it is important to note that variable outcomes are expected due to potentially different indicator (bacteria versus coliphage) shedding patterns in animal sources (McMinn et al. 2014,2017b) combined with variable fate and transport behaviors (Wanjugi et al. 2016, Wu et al. 2016). Furthermore, it will be interesting to consider whether coliphage are a better predictor for the presence of disease causing enteric viruses compared to fecal bacterial indicators. To date, there are conflicting reports on the association between coliphage and enteric viruses in surface waters (Baggi et al. 2001, Espinosa et al. 2009, Hot et al. 2003, Lodder et al. 2010, Viau et al. 2011) suggesting that additional research may be necessary. It is also interesting to note that total coliphage (sum of somatic and F+ measurements) was strongly correlated with somatic coliphage (r ≥ 0.99; Table 2) resulting in similar outcomes in data grouping analyses based on the U.S. Environmental Protection Agency recommended E. coli BAV of 235 MPN/100mL (Table 3) and predictive modeling with water quality and recreational parameters (Table 4) suggesting additional research is warranted.
Finally, perhaps the largest contribution of this study is the generation of an immense data framework consisting of paired measurements of fecal indicators, water quality physical and chemical properties, as well as recreational area parameters across three Great Lake recreational areas sampled five days a week over an entire beach season. This high-resolution water quality information system generated with standardized procedures not only provides constructive insights on the incidence of coliphage in the Great Lake region, but also will serve as a foundation for future research on related public health impacts, forecast modeling, and fecal source identification.
5. CONCLUSIONS
We describe paired culture-based measurements of somatic coliphage, F+ coliphage, E. coli, and enterococci fecal indicators along with 16 water quality and recreational area parameters across nine sites situated in the Great Lakes region over a 15-week beach season. Key findings include:
D-HFUF-SAL allowed for simultaneous measurement of somatic and F+ coliphage in Great Lake recreational water samples.
E. coli and enterococci indicator levels were consistently higher than coliphage concentrations across all samples.
Great Lake recreational areas tested in this study river and beach sites exceeded the U.S. Environmental Protection Agency single sample BAV E. coli advisory threshold of 235 MPN/100mL in almost 40% of samples.
Coliphage concentrations weakly correlated with fecal indicator bacteria levels (r ≤ 0.40) at 75% of beach sites tested in study.
Rivers sites consistently yielded higher concentrations of all fecal indicators compared to beach sites.
Recreational beach water ultraviolet light absorption (UV_254) and water temperature were closely associated with coliphage concentrations, but not fecal indicator bacteria levels.
In general, water quality and recreational parameters were better predictors of bacterial indicators compared to coliphage at Great Lake recreational sites tested in this study. However, further research is needed to determine whether bacterial or viral indicators are better predictors for the presence of enteric pathogens in such waters.
Supplementary Material
Footnotes
Publisher's Disclaimer: 6. DISCLAIMER
A special thanks to Ariela Topper, Lucas Bertaux-Skeirik, and Brad Acrey for laboratory support. Information has been subjected to U.S. EPA peer and administrative review and has been approved for external publication. Any opinions expressed in this paper are those of the authors and do not necessarily reflect the official positions and policies of the U.S. EPA. Any mention of trade names or commercial products does not constitute endorsement or recommendation for use.
REFERENCES:
- American-Public-Health-Association (1998) Standard Methods for the Examination of Water and Wastewater, American Public Health Association, Washington DC. [Google Scholar]
- Araujo RM, Puig A, Lasobras J, Lucena F and Jofre J (1997) Phages of enteric bacteria in fresh water with different levels of faecal polltuion. Journal of Applied Microbiology 82, 281–286. [DOI] [PubMed] [Google Scholar]
- Ashbolt NJ, Grabow OK and Snozzi M (2001) Indicators of microbial water quality, International Water Association, London, UK. [Google Scholar]
- Baggi FA, Demarta A and Peduzzi R (2001) Persistence of viral pathogens and bacteriophages during sewage treatment: lack of correlation with indicator bacteria. Research in Microbiology 152, 743–751. [DOI] [PubMed] [Google Scholar]
- Begier EM, Obserste MS, Landry ML, Brennan T, Mlynarski D, Mshar PA, Frenette K, Rabatsky-Ehr T, Purviance K, Neapul A, Nix WA, Pallasnsch MA, Perguson D, Cartter ML and Hadler JL (2008) An outbreak of concurrent echovirus 30and coxsackievirusA1 infections associated with sea swimming among a group of travelers to Mexico. Clinical Infectious Diseases 47, 616–623. [DOI] [PubMed] [Google Scholar]
- Bonilla TD, Nowosielski K, Cuvelier M, Hartz A, Green M, Esiobu N, McCorquodale DS, Fleisher JM and Rogerson A (2007) Prevalence and distribution of fecal indicator organisms in South Florida beach sand and preliminary assessment of health effects associated with beach sand exposure. Marine Pollution Bulletin 54, 1472–1482. [DOI] [PubMed] [Google Scholar]
- Cabelli VJ, Dufour AP, McCabe LJ and Levin MA (1982) Swimming-associated gastroenteritis and water quality. American Journal of Epidemiology 115, 606–616. [DOI] [PubMed] [Google Scholar]
- Cole D, Long SC and Sobsey MD (2003) Evaluation of F-i-RNA and DNA coliphages as source-specific indicators of fecal contamination in surface waters. Applied and Environmental Microbiology 69, 6507–6514. [DOI] [PMC free article] [PubMed] [Google Scholar]
- Contreras-Coll N, Lucena F, Mooijman K, Havelaar A, Pierz V, Boque M, Gawler A, Holler C, Lambiri M, Mirolo G, Moreno B, Niemi M, Sommer R, Valentin B, Wiedenmann A, Young V and Jofre J (2002) Occurrence and levels of indicator bacteriophages in bathing waters throughout Europe. Water Research 36(4963–4974). [DOI] [PubMed] [Google Scholar]
- Dorfman M and Haren A (2014) Testing the Waters. Devine J (ed), Natural Resources Defense Council. [Google Scholar]
- EPA, U.S. (2006) National Primary Drinking Water Regulations: Ground Water Rule: Final Rule.
- EPA, U.S. (2015) Review of coliphages as possible indicators of fecal contamination from ambient water quality. Harwood VJ, Jiang S and Sobsey MD (eds), Washington D.C. [Google Scholar]
- Ervin JS, Russell TL, Layton BA, Yamahara KM, Wang D, Sassoubre LM, Cao Y, Kelty CA, Sivaganesan M, Boehm AB, Holden PA, Weisberg SB and Shanks OC (2013) Characterization of fecal concentrations in human and other animal sources by physical, culture-based, and quantitative real-time PCR methods. Water Research 47(18), 6873–6882. [DOI] [PubMed] [Google Scholar]
- Espinosa AC, Arias CF, Sanchez-Colon S and Mazari-Hiriart M (2009) Comparative study of enteric viruses, coliphages and indicator bacteria for evaluating water quality in a tropical high-altitude system. Environmental Health 8, 49. [DOI] [PMC free article] [PubMed] [Google Scholar]
- Ewert DL and Paynter MJ (1980) Enumeration of bacteriphages and host bacteria in sewage and the activated-sludge treatment process. Applied and Environmental Microbiology 39, 576–583. [DOI] [PMC free article] [PubMed] [Google Scholar]
- Gantzer C, Maul A, Audic JM and Schwartzbrod L (1998) Detection of infectious enteroviruses, enterovirus genomes, somatic coliphages, and Bacteroides fragilis phages in treated wastewater. Applied and Environmental Microbiology 64, 4307–4312. [DOI] [PMC free article] [PubMed] [Google Scholar]
- Gerba CP (1987) Phage as indicators of fecal pollution, Wiley Interscience, New York, NY. [Google Scholar]
- Griffith JF, Weisberg SB, Arnold BF, Cao Y, Schiff KC and Colford JM (2016) Epidemiologic evaluation of multiple alternate microbial water quality monitoring indicators at three California beaches. Water Research 94, 371–381. [DOI] [PubMed] [Google Scholar]
- Haramoto E, Kitajima M, Katayama H, Asami M, Akiba M and Kunikane S (2009) Application of real-time PCR assays for genotyping F-specific phages in river water and sediments in Japan. Water Research 43, 3759–3764. [DOI] [PubMed] [Google Scholar]
- Havelaar A, van Olphen M and Drost YC (1993) F-specific RNA bacteriophages are adequate model organisms for enteric viruses in freshwater. Applied and Environmental Microbiology 59, 2956–2962. [DOI] [PMC free article] [PubMed] [Google Scholar]
- Hot D, Legeay O, Jacques J, Gantzer C, Caudrelier Y, Guyard K, Lange M and Andreoletti L (2003) Detection of somatic phages, infectious enteroviruses and enterovirus genomes as indicators of human enteric viral polltuion in surface water. Water Research 37, 4703–4710. [DOI] [PubMed] [Google Scholar]
- Judge GG, Griffiths WE, Hill RC, Lutkepohl H and Lee TC (1985) The Theory and Practice of Econometrics, John Wiley & Sons, New York. [Google Scholar]
- King AMQ, Adams MJ, Carstens EB and Lefkowitz WJ (2011) Virus taxonomy: classification and nomenclature of viruses, Elsevier Academic Press, London, UK. [Google Scholar]
- Lee HS and Sobsey MD (2011) Survival of prototype strains of somatic coliphage families in environmental waters and when exposed to UV low-pressure monochromatic radiation or heat. Water Research 45, 3723–3734. [DOI] [PubMed] [Google Scholar]
- Lodder WJ, van den Berg HH, Rutjes SA and de Roda Husman AM (2010) Presence of enteric viruses in source waters for drinking water production in the Netherlands. Applied and Environmental Microbiology 76, 5965–5971. [DOI] [PMC free article] [PubMed] [Google Scholar]
- Long SC and Sobsey MD (2004) A comparison of the survivalof F+RNA and F-t-DNA coliphages in lake water microcosms. Water Health 2, 15–22. [PubMed] [Google Scholar]
- Lucena F, Duran AE, Moron A, Calderon E, Campos C, Gantzer C, Skraber S and Jofre J (2004) Reduction of bacterial indicators and bacteriophages infecting faecal bacteria in primary and secondary wastewater treatments. Journal of Applied Microbiology 97, 1069–1076. [DOI] [PubMed] [Google Scholar]
- McMinn BR, Ashbolt NJ and Korajkic A (2017a) Bacteriophages as indicators of faecal pollution and enteric virus removal. Letters in Applied Microbiology 65, 11–26. [DOI] [PMC free article] [PubMed] [Google Scholar]
- McMinn BR, Korajkic A and Ashbolt NJ (2014) Evaluation of Bacteroides fragilis GB-124 bacteriophages as novel human-associated faecal indicators inthe United States. Letters in Applied Microbiology 59, 115–121. [DOI] [PubMed] [Google Scholar]
- McMinn BR, Korajkic A, Huff EM and Rhodes ER (2017b) Enumeration of somatic and F+ coliphage with dead-end hollow-fiber ultrafiltrationand single agar overlay for recreational freshwater applications. Journal of Applied Microbiology In Press.
- Mesquita MMF, Stimson J, Chae GT, Tufenkji N, Ptacek CJ, Blowes DW and Emelko MB (2010) Optimal preparation and purification of PRD1-like bacteriophages for use in environmental fate and transport studies. Water Research 44, 1114–1125. [DOI] [PubMed] [Google Scholar]
- Palmateer GA, Dutka BJ, Janzen EM, Meissner SM and Sakeelaries MG (1991) Coliphage and bacteriophage as indicators of recreational water quality. Water Research 25, 355–357. [Google Scholar]
- Paul JH, Rose JB, Jiang S, London P, Xhou X and Kellogg C (1997) Coliphage and indigenous phage in Mamala Bay, Oahu, Hawaii. Applied and Environmental Microbiology 63, 133–138. [DOI] [PMC free article] [PubMed] [Google Scholar]
- Payment P, Morin E and Trudel M (1988) Coliphages and enteric viruses in the particulate phase of river water. Canadian Journal of Microbiology 34, 907–910. [DOI] [PubMed] [Google Scholar]
- Rezaeinejad S, Vergara GG, Woo CH, Lim TT, Sobsey MD and Gin KY (2014) Surveillance of enteric viruses and coliphages in a tropical urban catchment. Water Research 58, 122–131. [DOI] [PubMed] [Google Scholar]
- Rose JB, Farrah SR, Harwood VJ, Levine AD, Lukaskik J, Menendez P and Scott TM (2004) Reduction of pathogens, indicator bacteria, and alternative indicators by wastewater treatment and reclamation processes.
- Schwarz G (1978) Estimating the dimension of a model. Annals of Statistics 6, 461–464. [Google Scholar]
- Silverman AI, Peterson BM, Boehm AB, McNeill K and Nelson KL (2013) Sunlight inactivation of human viruses and bacteriophages in coastal waters containing natural phtosensitizers. Environmental Science & Technology 47, 1870–1878. [DOI] [PubMed] [Google Scholar]
- Sinclair RG, Jones EL and Gerba CP (2009) Viruses in recreational water-borne disease outbreaks: a review. Journal of Applied Microbiology 107, 1769–1780. [DOI] [PubMed] [Google Scholar]
- Sinton LW, Hall CH, Lynch PA and Davies-Colley RJ (2002) Sunlight and inactivation of fecal indicator bacteria and bacteriophages from waste stabilization pond effluent in fresh and saline waters. Applied and Environmental Microbiology 68, 1122–1131. [DOI] [PMC free article] [PubMed] [Google Scholar]
- Soller JA, Schoen ME, Bartrand T, Ravenscroft JE and Ashbolt NJ (2010) Estimated human health risks from exposure to recreational waters impacted by human and non-human sources of faecal contamination. Water Research 44, 4674–4691. [DOI] [PubMed] [Google Scholar]
- USEPA (2001) Method 1602: Male-specific (F+) and somatic coliphage in water by single agar layer (SAL) procedure, Washington, D.C. [Google Scholar]
- USEPA (2009) Method 1600: Enterococci in water by membrane filtration using membrane-Enterococcus indoxyl-B-D-glucoside agar (mEI). Oshiro R (ed), Washington, DC. [Google Scholar]
- USEPA (2012) Recreational Water Quality Criteria, Office of Water. [Google Scholar]
- Vergara GG, Goh SG, Rezaeinejad S, Chang SY, Sobsey MD and Gin KY (2015) Evaluation of FRNA coliphages as indicators of human enteric viruses in a tropical urban freshwater catchment. Water Research 79, 39–47. [DOI] [PubMed] [Google Scholar]
- Viau EJ, Goodwin KD, Yamahara KM, Layton BA, Sassoubre LM, Burns SL, Tong HI, Wong SH, Lu Y and Boehm AB (2011) Bacterial pathogens in Hawaiian coastal streams - associations with fecal indicators, land cover, and water quality. Water Research 45, 3279–3290. [DOI] [PubMed] [Google Scholar]
- Wanjugi P, Sivaganesan M, Korajkic A, Kelty CA, McMinn BR, Ulrich R, Harwood VJ and Shanks OC (2016) Differential decomposition of bacterial and viral fecal indicators in common human pollution types. Water Research 105, 591–601. [DOI] [PMC free article] [PubMed] [Google Scholar]
- WHO (2001) Water Quality: Guidelines, Standards and Health, IWA Publishing, London, UK. [Google Scholar]
- Wu J, Cao Y, Young B, Yuen Y, Jiang S, Melendez D, Griffith JF and Stewart JR (2016) Decay of coliphages in sewage-contaminated freshwater: uncertainty and seasonal effects. Environmental Science & Technology 50, 11593–11601. [DOI] [PubMed] [Google Scholar]
- Wu J, Long SC, Das D and Dorner SM (2011) Are microbial indicators and pathogens correlated? A statistical analysis of 40 years of research. Journal of Water and Health 9, 265–278. [DOI] [PubMed] [Google Scholar]
- Zou H (2006) The adaptive lasso and its oracle properties. Journal of the American Statistical Association 101, 1418–1429. [Google Scholar]
Associated Data
This section collects any data citations, data availability statements, or supplementary materials included in this article.