

Abstract

Nonlinear molecular interactions with optical fields produce intriguing optical phenomena and applications ranging from color generation to biomedical imaging and sensing. The nonlinear cross-section of dielectric materials is low and therefore for effective utilisation, the optical fields need to be amplified. Here, we demonstrate that two-photon absorption can be enhanced by 108 inside individual plasmonic nanocavities containing emitters sandwiched between a gold nanoparticle and a gold film. This enhancement results from the high field strengths confined in the nanogap, thus enhancing nonlinear interactions with the emitters. We further investigate the parameters that determine the enhancement including the cavity spectral position and excitation wavelength. Moreover, the Purcell effect drastically reduces the emission lifetime from 520 ns to <200 ps, turning inefficient phosphorescent emitters into an ultrafast light source. Our results provide an understanding of enhanced two-photon-excited emission, allowing for optimization of efficient nonlinear light-matter interactions at the nanoscale.
Keywords: nanocavity, plasmonic enhancement, phosphorescence, two-photon absorption, Purcell factor
Nonlinear optics is widely used for the generation of different laser colors, spectroscopy, imaging, optical communications, light modulation devices, and more.1−7 Due to the weak nonlinearities of transparent materials, nonlinear light–matter interactions require high optical intensities and typically demand pulsed lasers1 or resonant cavities.8 The intensity requirement limits their otherwise promising application for probing nanodevices, whose subdiffraction-limited active regions provide faint signals unless high power densities are used that almost inevitably damage the nanostructures.9,10
The solution demonstrated here is to employ closely spaced metallic nanostructures that support coherent collective electron oscillations within localized plasmons.11 Plasmonic nanostructures have been used to enhance fluorescence emission,12−16 surface-enhanced Raman spectroscopy,17−20 and nonlinear light generation.21−25 There has been growing interest in using plasmonic nanostructures to enhance two-photon excited emission where photons with half the energy of an electronic transition, typically in the near-infrared (NIR), excite an emitter which then emits in the visible region.26 Such two-photon excitation has been used for deep tissue penetration,27,28 since both elastic scattering and absorption are reduced at NIR wavelengths. Moreover, two photon absorption has been widely used for optical power limiting,29 optical communications,30 and single photon nonlinear detectors.31
Plasmon enhancement of this two-photon excitation should yield much larger enhancements compared to one-photon excitation, due to the quadratic dependence of emission on local excitation intensity. However, plasmonic nanostructures have so far given two-photon enhancements ranging only from one to four orders of magnitude.32−35 The emission depends on the enhanced optical electric field E in the vicinity of the probed emitter which varies with nanostructure geometry and is maximized for coupled plasmons trapped between two metallic nanocomponents (e.g., dimers33) or at the sharp ends of metallic nanostructures (e.g., nanorods32). To go beyond these previous studies and realize the potential for nanononlinearities, we exploit the extreme confinement recently accessed in sub-nm plasmonic gaps.
Drastically enhanced two-photon-excited emission is obtained from the nanoparticle-on-mirror (NPoM) construct used here, which consists of a Au nanoparticle sitting on top of a monolayer molecular emitter [here, tris(2,2′-bipyridine) ruthenium(II) hexafluorophosphate, known as “Rubpy”, see Methods] assembled on a flat gold film (Figure 1a). Plasmonic modes equivalent to the prototypical plasmon dimer are confined between the nanoparticle and the Au mirror.36−38 The long wavelength coupled plasmon mode position confirms that only a molecular monolayer sits in the ∼1 nm gap (Methods), which results in field enhancements that exceed 280 (see Figure 1b), so that strong two-photon excited emission is expected. The Rubpy chromophore used here is a widely studied phosphorescent emitter that absorbs in the ultraviolet (around 450 nm) and has a large Stokes shift with a phosphorescence peak at 620 nm (Figure 1b). This broad emission couples to the NPoM cavity which possesses a fundamental resonance in the near-infrared. Rubpy has a relatively high nonlinear absorption cross-section, up to 180.10–50 cm4 photon–1 s–1.39,40
Figure 1.

Experimental scheme. (a) Plasmonic nanocavity formed by a Au nanoparticle on a Au film with Rubpy in the gap. The inset shows the chemical structure of the Rubpy emitter and its energy levels excited from the ground singlet state S0 to the first excited singlet S1 via two-photon absorption of near-infrared light. The emitter undergoes ultrafast intersystem crossing (ISC) to the triplet T1 and phosphoresces in the visible wavelength region. (b) Absorption (blue) and emission (green) spectra of Rubpy in solution, with near-field enhancement (brown) calculated for an 80 nm Au nanoparticle with a 20 nm facet width. The NPoM is excited by 120 fs pulses at 920 nm (black). The red-shaded region is the detection window.
Results
Two-Photon Excitation
We perform two-photon excitation from S0 to S1 on Rubpy in NPoMs, and compare to in solution. A 920 nm pump laser with 120 fs pulses elicits phosphorescent emission between 550 and 800 nm (Figure 1b). The emission spectra for increasing excitation powers (Figure 2a,b) show minimal changes in spectral shape but strong differences between NPoM and 80 μM Rubpy solution. The darkfield scattering, which reveals the NPoM cavity mode, remains constant even up to 1 mW average power on the NPoM (Figure 2c), which implies that the NPoM nanoconstruct is stable with no significant damage or migration of Au atoms.41,42 To understand the difference between Rubpy emission from NPoMs and in solution, it is sufficient to account for in-/out-coupling efficiencies using a simple analytical model based on the darkfield scattering multiplied by the solution spectra (Figures 2d, described below). The NPoMs thus simply filter the Rubpy emission spectrum through their fundamental mode.
Figure 2.

Emission and scattering spectra. Phosphorescence spectra of Rubpy (a) in solution and (b) in a nanoparticle-on-mirror (NPoM) nanocavity. (c) Darkfield scattering spectra of the NPoM after each laser illumination, vertically offset for clarity. The dashed curve in (c) is the initial darkfield. (d) Emission and modeled spectra of two different NPoMs.
Emission Enhancement
To further understand how NPoMs modify the emission, the integrated intensity across the emission spectra is extracted for each excitation power. In both NPoMs and in solution, the integrated intensities scale quadratically with power density (Figure 3a), confirming that two-photon absorption drives the observed emission. This behavior persists in all component parts of the spectrum (Figure 3b), showing that they originate from the same state. Analyzing results on more than 40 NPoM cavities shows that the quadratic scaling dominates with variations between powers of 1.6 to 2.3 (Figure 3c). We estimate the experimental enhancement factor per molecule of Rubpy, in NPoMs with respect to in solution, as
| 1 |
where IN and Is are the measured integrated intensity (in counts/seconds/μW) across the detection wavelength range in NPoM (N) and in solution (s), respectively, NN,s are the numbers of molecules, and CN,s are the collection efficiencies to account for the differences in radiation patterns of emitters in NPoM and in solution (for the estimation of these parameters and detailed description of the enhancement calculation, see SI Note 2, and for error analysis, see SI Note 3). We estimate NN using the measured surface coverage of Rubpy on Au43 and the calculated area of the hotspot at the center of the gap which is set by the lateral mode I2(r) profile (since via two-photon absorption) of which 50% is within a radius of 4.7 nm. Similarly Ns uses the 80 μM solution concentration and illuminated volume set by the focused spot size w0 of 0.51 μm (at λ = 0.92, numerical aperture NA = 0.9) and Rayleigh length zR of 0.9 μm. The collection Cs = 0.67 comes from Lambertian emission with 5% losses and the solid angle restricted by total internal reflection at the glass–air interface, while CN = 0.55 is given by the predominantly high angle emission of the NPoM collected by the same NA = 0.9 objective.44,45
Figure 3.
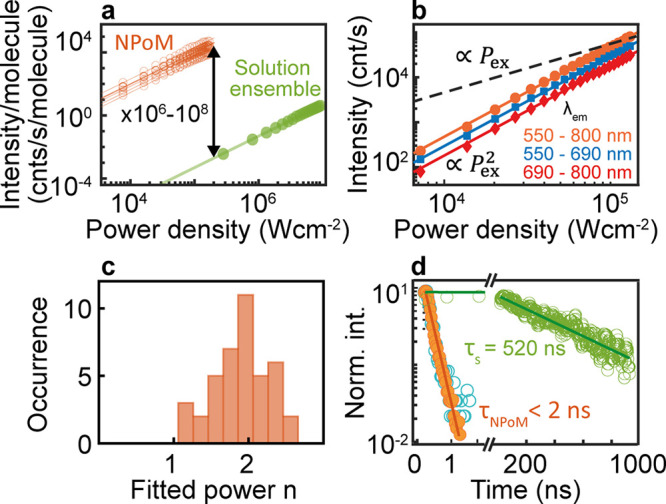
Power dependence of emission. (a) Measured emission per molecule integrated over all detected wavelengths vs power density, for seven different nanoparticle-on-mirror (NPoM) nanocavities with Rubpy spacers (orange) and in solution (green). Solid lines are power law fits with an exponent of two. (b) Intensity vs power density within different spectra regions (as noted). (c) Histogram of power law exponents obtained from power scaling in >40 NPoM cavities. (d) Normalized intensity vs time delay from time-correlated single-photon counting of emission from bulk Rubpy (green open circles), Rubpy in NPoM (orange filled circles), and instrument response function measured with attenuated laser pulses (cyan open circles).
Using eq 1, up to 108 emission enhancement from NPoMs is obtained compared to in solution. This strong enhancement results from the high field confinement in the nanocavity, thereby enhancing the two-photon absorption of the excitation light. We note that other methods can be used to determine the enhancement factor such as considering the ratio of the illuminated areas or volumes rather than the ratio of the number of molecules (for a discussion on this, see SI Note 2). Using the ratio of illuminated areas gives similar results (within a factor of 4, see Table S1) with Ns,N, while using the volume ratio gives erroneously high values (2 orders of magnitude higher), which is a result of the comparison of large volumes in solution with the small volume under the 1 nm NPoM gap. To avoid this exaggeration, we therefore use the estimated ratio of the number of molecules. In comparison with other nanophotonic structures used to enhance two-photon absorption, these NPoMs gives the highest enhancement (see Table 1).
Table 1. Comparison of Two-Photon Excitation Enhanced by Different Nanostructures.
Below saturation, we determine the expected enhancement from simulation as
| 2 |
where
γN and γs are the excitation rates
in NPoM and in solution, respectively,
and ηN,s are the quantum yields (for further details,
see SI Note 2). The ratio between experiments
and simulations  can be accounted for
by less controlled
experimental parameters such as in-/out-coupling efficiencies of the
NPoM, orientation, and spatial distribution of molecules in the gap.44
can be accounted for
by less controlled
experimental parameters such as in-/out-coupling efficiencies of the
NPoM, orientation, and spatial distribution of molecules in the gap.44
To demonstrate the Purcell effect, we measure the emission lifetime using time-correlated single-photon counting (TCSPC, see Methods) and obtain the lifetime for bulk Rubpy as τbulk = 520 ± 10 ns and τNPoM = 0.2 ± 0.1 ns, limited by the instrument response (Figure 3d). This implies that there is a >2600 emission speed-up due to the enhanced local density of optical states in the gap. From finite-difference time domain calculations, the Purcell factor is up to 106 (see Figure S4), and thus, a lifetime of ∼500 fs is expected, well below the detection speed of available single-photon counting modules.
Dependence of emission on cavity resonance and excitation wavelength
We investigate the dependence of the emission enhancement on the cavity resonance and observe that it is maximized when the plasmon peak matches the excitation wavelength (Figure 4a). This can be described using a model that assumes the total two-photon-absorbed in-coupled intensity Ia in the gap is
| 3 |
where the nonlinear absorption cross-section σa ∝ α (λ) tracks the
linear absorption α(λ) as established for Ru(II) complexes,46 η is the in-couping efficiency, and the
excitation laser intensity is I for excitation wavelength
λex. For the in-coupling efficiency we take the darkfield
scattering η ≃ S (λ), which is
modeled as the sum of two Lorentzian functions for each NPoM (Figure 4b) to model the plasmon
transverse and cavity (λpk) modes.45 Taking the out-coupling efficiency also to be η,
the total emitted intensity  where c is a scaling factor, N is the number of molecules in the gap, Is(λ) is the emission spectrum in solution, and {λ1,2} is the detected emission wavelength range. The integrand
of Ie well describes the spectral shape
of the Rubpy emission spectra in NPoMs (Figure 2d). Defining
where c is a scaling factor, N is the number of molecules in the gap, Is(λ) is the emission spectrum in solution, and {λ1,2} is the detected emission wavelength range. The integrand
of Ie well describes the spectral shape
of the Rubpy emission spectra in NPoMs (Figure 2d). Defining  gives the normalized enhancement
| 4 |
This model predicts that the emission is maximized when the cavity mode overlaps with the excitation wavelength, which agrees with our observations (Figure 4a). Different c factors can be attributed to a combination of variations in dipole orientation, molecular packing, diameter, and facet size of the Au nanoparticles.
Figure 4.

Emission dependence on cavity resonance and excitation wavelength. (a) Phosphorescence enhancement vs peak cavity mode for 43 NPoMs at λex = 920 nm (orange circles). Error bar is within the symbol size. Gray curves are analytical predictions for different scaling factors c. (b) Model darkfield spectra showing detuning of λex from λpk. (c) Normalized emitted intensity vs excitation wavelength. Points are measured from a NPoM with peak λ indicated in the purple circle of Figure 4a, α(λex/2) is absorption spectrum of Rubpy at half the excitation wavelength (top axis).
Selecting now a NPoM with long-wavelength scattering peaks around 920 nm (giving the largest enhancements, but in the tail of the NPoM distribution, see Figure S1a), we vary the excitation wavelength and observe that the emission peaks when λex = 920 nm (Figure 4c). As expected, the spectral shape of this excitation curve depends on both the absorption spectrum at 2ω and the scattering resonance S(λ) near 920 nm. The strongest two-photon pumped emission occurs when there is a good overlap between the absorption spectrum, the excitation wavelength, and the plasmonic peak.
In summary, we employ plasmonic nanocavities to greatly enhance two-photon-excited emission by up to 108 and observe that the enhancement depends on tuning the excitation wavelength to both the nanocavity resonance and the molecular absorption. This enhancement, the highest yet reported, is due to the extreme field confinement producing thousand-fold intensity enhancement. Additional considerations to optimize two-photon yield are the position and dipole orientation of molecules in the NPoM gap, which is simplified here using monolayers of spherically symmetric Rubpy but can otherwise be challenging to control. Selective positioning and orienting can be achieved with DNA origami directed-assembly.47−50 Superradiance and other cooperative effects are expected within the NPoM due to the small mode volume; however, we keep the occupancy per excitation low (<10–6 to reduce these effects).51−53 Our results show that NPoMs are excellent nanophotonic constructs to explore nonlinear interactions at the nanoscale. These can open up applications in deep tissue biomedical imaging due to the enhanced emission (using similar NP dimers) as well as photodynamic therapy for efficient generation of singlet oxygen.54
Methods
Optical Setup
A detailed description of the experimental setup is in ref (55). We excite the sample with ∼120 fs pulses, ∼10 nm full width at half-maximum, generated from a tunable optical parametric oscillator (OPO) (Spectra Physics Inspire) pumped at 820 nm with a repetition rate of 80 MHz. The power of the pulses is controlled using a variable neutral density filter mounted on a rotational stage. The attenuated pulses pass through a 90:10 (reflection:transmission) beam splitter and are focused by a microscope objective with a numerical aperture = 0.9 to excite the emitters in the plasmonic nanocavity at high illumination angles (≤64°). Emission light passes through the beam splitter, through short pass filters, and is directed to a grating spectrometer using a removable mirror. The spectral image is also taken by an electron multiplying charged coupled detector (EMCCD) that is cooled to −80 °C. Taking out the removable mirror directs the emission light toward a time-correlated single-photon counting (TCSPC) setup for the lifetime measurement which uses a single-photon avalanche photodiode (SPAD) and trigger SPAD. The output of the two SPADs are connected to a correlation card for histogramming.
Sample Preparation
First, 0.7 mg of tris(2,2′-bipyridine) ruthenium(II) hexa-fluorophosphate or Rubpy (Sigma-Aldrich) is dissolved in 10 mL of deionized water, and the solution is placed in an ultrasonic bath for 10 s to ensure proper dissolution. An atomically flat template-stripped Au on a Si wafer is submerged overnight in 1 mL of the Rubpy stock solution. The preparation of the template-stripped gold is described in ref (56). The substrate is thoroughly rinsed with deionized water and blown dry using nitrogen, leaving behind a self-assembled monolayer (SAM) of Rubpy on the Au film. Next, 200 mL of Au nanospheres (BBI Solutions, diameter 80 nm) that are stabilized in citrate buffer, mixed with a 5 mM of KCl solution (for further charge stabilization), is drop casted onto the Rubpy SAM on the Au substrate for 30 s. The excess Au nanoparticles solution is blown dry using nitrogen, and sparsely spaced Au nanoparticles are deposited on Rubpy on the Au film, forming the NPoM nanoconstuct. Characterization of the self-assembled structure using darkfield scattering spectroscopy reveals a dominant plasmonic mode with a peak at 830 nm (see Figure S1), indicating that the thickness of the nanogap is ∼1 nm, assuming a refractive index of 1.6, as predicted by a plasmonic circuit model and simulations.56,57 A bilayer with a thickness of 2 nm would predict a darkfield scattering peak at 720 nm, far from the observed 830 nm peak, thus confirming that only a monolayer of Rubpy fits in the gap. The facet size ranges from 18–28 nm as seen in scanning electron microscope images of these nanoparticles,58 and this is verified from the position of the quadrupole mode at 600 nm of the scattering spectrum (Figure S1). The surface coverage of a monolayer of Rubpy is estimated to be e 0.4 × 10¹⁴ molecules cm–2 (see ref (43)) to give ∼30 molecules (see SI) under each Au nanoparticle.
Simulations
Details of the simulations are provided in Supplementary Note 4.
Acknowledgments
We acknowledge funding from the EPSRC (Cambridge NanoDTC EP/L015978/1 and EP/S022953/1, EP/L027151/1, EP/P029426/1, and EP/N016920/1). O.S.O. acknowledges the support of Rubicon fellowship from the Netherlands Organisation for Scientific Research. R.C. acknowledges support from Trinity College, University of Cambridge.
Supporting Information Available
The Supporting Information is available free of charge at https://pubs.acs.org/doi/10.1021/acs.nanolett.0c01593.
(Supplementary Note 1) Darkfield scattering and SERS, (Supplementary Note 2) enhancement calculation, (Supplementary Note 3) error analysis on the enhancement factor, and (Supplementary Note 4) finite-difference time domain (FDTD) simulations (PDF)
The authors declare no competing financial interest.
Notes
Source data can be found at DOI link: https://doi.org/10.17863/CAM.52531.
Supplementary Material
References
- Boyd R. W.Nonlinear Optics; Elsevier: 2008. [Google Scholar]
- Garmire E. Nonlinear Optics in Daily Life. Opt. Express 2013, 21 (25), 30532. 10.1364/OE.21.030532. [DOI] [PubMed] [Google Scholar]
- Dudley J. M.; Genty G.; Coen S. Supercontinuum Generation in Photonic Crystal Fiber. Rev. Mod. Phys. 2006, 78 (4), 1135–1184. 10.1103/RevModPhys.78.1135. [DOI] [Google Scholar]
- Zipfel W. R.; Williams R. M.; Webb W. W. Nonlinear Magic: Multiphoton Microscopy in the Biosciences. Nat. Biotechnol. 2003, 21 (11), 1369–1377. 10.1038/nbt899. [DOI] [PubMed] [Google Scholar]
- Gu B.; Zhao C.; Baev A.; Yong K.-T.; Wen S.; Prasad P. N. Molecular Nonlinear Optics: Recent Advances and Applications. Adv. Opt. Photonics 2016, 8 (2), 328. 10.1364/AOP.8.000328. [DOI] [Google Scholar]
- Zhuang L.; Roeloffzen C. G. H.; Hoekman M.; Boller K.-J.; Lowery A. J. Programmable Photonic Signal Processor Chip for Radiofrequency Applications. Optica 2015, 2 (10), 854–859. 10.1364/OPTICA.2.000854. [DOI] [Google Scholar]
- Ctistis G.; Yuce E.; Hartsuiker A.; Claudon J.; Bazin M.; Gérard J.-M.; Vos W. L. Ultimate Fast Optical Switching of a Planar Microcavity in the Telecom Wavelength Range. Appl. Phys. Lett. 2011, 98 (16), 161114. 10.1063/1.3580615. [DOI] [Google Scholar]
- Kavokin A. V.; Baumberg J. J.; Malpuech G.; Laussy F. P.. Microcavities, 2nd ed.; Series on Semiconductor Science and Technology; Oxford University Press: Oxford, NY, 2017. [Google Scholar]
- Chang S.-S.; Shih C.-W.; Chen C.-D.; Lai W.-C.; Wang C. R. C. The Shape Transition of Gold Nanorods. Langmuir 1999, 15 (3), 701–709. 10.1021/la980929l. [DOI] [Google Scholar]
- Albrecht W.; Deng T.-S.; Goris B.; van Huis M. A.; Bals S.; van Blaaderen A. Single Particle Deformation and Analysis of Silica-Coated Gold Nanorods before and after Femtosecond Laser Pulse Excitation. Nano Lett. 2016, 16 (3), 1818–1825. 10.1021/acs.nanolett.5b04851. [DOI] [PMC free article] [PubMed] [Google Scholar]
- Novotny L.; Hecht B.. Principles of Nano-Optics; Cambridge University Press: 2006. [Google Scholar]
- Barnes W. L. Fluorescence near Interfaces: The Role of Photonic Mode Density. J. Mod. Opt. 1998, 45 (4), 661–699. 10.1080/09500349808230614. [DOI] [Google Scholar]
- Pelton M. Modified Spontaneous Emission in Nanophotonic Structures. Nat. Photonics 2015, 9 (7), 427–435. 10.1038/nphoton.2015.103. [DOI] [Google Scholar]
- Muskens O. L.; Giannini V.; Sánchez-Gil J. A.; Gómez Rivas J. Strong Enhancement of the Radiative Decay Rate of Emitters by Single Plasmonic Nanoantennas. Nano Lett. 2007, 7 (9), 2871–2875. 10.1021/nl0715847. [DOI] [PubMed] [Google Scholar]
- Kinkhabwala A.; Yu Z.; Fan S.; Avlasevich Y.; Müllen K.; Moerner W. E. Large Single-Molecule Fluorescence Enhancements Produced by a Bowtie Nanoantenna. Nat. Photonics 2009, 3 (11), 654–657. 10.1038/nphoton.2009.187. [DOI] [Google Scholar]
- Akselrod G. M.; Argyropoulos C.; Hoang T. B.; Ciracì C.; Fang C.; Huang J.; Smith D. R.; Mikkelsen M. H. Probing the Mechanisms of Large Purcell Enhancement in Plasmonic Nanoantennas. Nat. Photonics 2014, 8 (11), 835–840. 10.1038/nphoton.2014.228. [DOI] [Google Scholar]
- Jeanmaire D. L.; Van Duyne R. P. Surface Raman Spectroelectrochemistry: Part I. Heterocyclic, Aromatic, and Aliphatic Amines Adsorbed on the Anodized Silver Electrode. J. Electroanal. Chem. Interfacial Electrochem. 1977, 84 (1), 1–20. 10.1016/S0022-0728(77)80224-6. [DOI] [Google Scholar]
- Nie S.; Emory S. R. Probing Single Molecules and Single Nanoparticles by Surface-Enhanced Raman Scattering. Science 1997, 275 (5303), 1102–1106. 10.1126/science.275.5303.1102. [DOI] [PubMed] [Google Scholar]
- Langer J.; Jimenez de Aberasturi D.; Aizpurua J.; Alvarez-Puebla R. A.; Auguié B.; Baumberg J. J.; Bazan G. C.; Bell S. E. J.; Boisen A.; Brolo A. G.; Choo J.; Cialla-May D.; Deckert V.; Fabris L.; Faulds K.; García de Abajo F. J.; Goodacre R.; Graham D.; Haes A. J.; Haynes C. L.; Huck C.; Itoh T.; Käll M.; Kneipp J.; Kotov N. A.; Kuang H.; Le Ru E. C.; Lee H. K.; Li J.-F.; Ling X. Y.; Maier S.; Mayerhoefer T.; Moskovits M.; Murakoshi K.; Nam J.-M.; Nie S.; Ozaki Y.; Pastoriza-Santos I.; Perez-Juste J.; Popp J.; Pucci A.; Reich S.; Ren B.; Schatz G. C.; Shegai T.; Schlücker S.; Tay L. L.; Thomas K. G.; Tian Z.-Q.; Van Duyne R. P.; Vo-Dinh T.; Wang Y.; Willets K. A.; Xu C.; Xu H.; Xu Y.; Yamamoto Y. S.; Zhao B.; Liz-Marzán L. M. Present and Future of Surface Enhanced Raman Scattering. ACS Nano 2020, 14 (1), 28–117. 10.1021/acsnano.9b04224. [DOI] [PMC free article] [PubMed] [Google Scholar]
- Timmermans F. J.; Lenferink A. T. M.; van Wolferen H. A. G. M.; Otto C. Correlative SEM SERS for Quantitative Analysis of Dimer Nanoparticles. Analyst 2016, 141 (23), 6455–6462. 10.1039/C6AN01648K. [DOI] [PubMed] [Google Scholar]
- Danckwerts M.; Novotny L. Optical Frequency Mixing at Coupled Gold Nanoparticles. Phys. Rev. Lett. 2007, 98 (2), 1. 10.1103/PhysRevLett.98.026104. [DOI] [PubMed] [Google Scholar]
- Ginzburg P.; Orenstein M.. Nonlinear Effects in Plasmonic Systems. In Active Plasmonics and Tuneable Plasmonic Metamaterials; Zayats A. V., Maier S. A., Eds.; John Wiley & Sons, Inc.: Hoboken, NJ, USA, 2013; pp 41–67. [Google Scholar]
- Butet J.; Brevet P.-F.; Martin O. J. F. Optical Second Harmonic Generation in Plasmonic Nanostructures: From Fundamental Principles to Advanced Applications. ACS Nano 2015, 9 (11), 10545–10562. 10.1021/acsnano.5b04373. [DOI] [PubMed] [Google Scholar]
- Genevet P.; Tetienne J.-P.; Gatzogiannis E.; Blanchard R.; Kats M. A.; Scully M. O.; Capasso F. Large Enhancement of Nonlinear Optical Phenomena by Plasmonic Nanocavity Gratings. Nano Lett. 2010, 10 (12), 4880–4883. 10.1021/nl102747v. [DOI] [PubMed] [Google Scholar]
- Ko K. D.; Kumar A.; Fung K. H.; Ambekar R.; Liu G. L.; Fang N. X.; Toussaint K. C. Nonlinear Optical Response from Arrays of Au Bowtie Nanoantennas. Nano Lett. 2011, 11 (1), 61–65. 10.1021/nl102751m. [DOI] [PubMed] [Google Scholar]
- Rumi M.; Perry J. W. Two-Photon Absorption: An Overview of Measurements and Principles. Adv. Opt. Photonics 2010, 2 (4), 451. 10.1364/AOP.2.000451. [DOI] [Google Scholar]
- Helmchen F.; Denk W. Deep Tissue Two-Photon Microscopy. Nat. Methods 2005, 2 (12), 932. 10.1038/nmeth818. [DOI] [PubMed] [Google Scholar]
- Waterhouse D. J.; Fitzpatrick C. R. M.; Pogue B. W.; O’Connor J. P. B.; Bohndiek S. E. A Roadmap for the Clinical Implementation of Optical-Imaging Biomarkers. Nat. Biomed. Eng. 2019, 3 (5), 339–353. 10.1038/s41551-019-0392-5. [DOI] [PubMed] [Google Scholar]
- Girardot C.; Cao B.; Mulatier J.-C.; Baldeck P. L.; Chauvin J.; Riehl D.; Delaire J. A.; Andraud C.; Lemercier G. Ruthenium(II) Complexes for Two-Photon Absorption-Based Optical Power Limiting. ChemPhysChem 2008, 9 (11), 1531–1535. 10.1002/cphc.200800186. [DOI] [PubMed] [Google Scholar]
- Hayat A.; Nevet A.; Ginzburg P.; Orenstein M. Applications of Two-Photon Processes in Semiconductor Photonic Devices: Invited Review. Semicond. Sci. Technol. 2011, 26 (8), 083001. 10.1088/0268-1242/26/8/083001. [DOI] [Google Scholar]
- Boitier F.; Dherbecourt J.-B.; Godard A.; Rosencher E. Infrared Quantum Counting by Nondegenerate Two Photon Conductivity in GaAs. Appl. Phys. Lett. 2009, 94 (8), 081112. 10.1063/1.3089380. [DOI] [Google Scholar]
- Zhang W.; Caldarola M.; Lu X.; Orrit M. Plasmonic Enhancement of Two-Photon-Excited Luminescence of Single Quantum Dots by Individual Gold Nanorods. ACS Photonics 2018, 5 (7), 2960–2968. 10.1021/acsphotonics.8b00306. [DOI] [PMC free article] [PubMed] [Google Scholar]
- Jensen R. A.; Huang I.-C.; Chen O.; Choy J. T.; Bischof T. S.; Lončar M.; Bawendi M. G. Optical Trapping and Two-Photon Excitation of Colloidal Quantum Dots Using Bowtie Apertures. ACS Photonics 2016, 3 (3), 423–427. 10.1021/acsphotonics.5b00575. [DOI] [Google Scholar]
- Liu W.; Li X.; Song Y.; Zhang C.; Han X.; Long H.; Wang B.; Wang K.; Lu P. Cooperative Enhancement of Two-Photon-Absorption-Induced Photoluminescence from a 2D Perovskite-Microsphere Hybrid Dielectric Structure. Adv. Funct. Mater. 2018, 28 (26), 1707550. 10.1002/adfm.201707550. [DOI] [Google Scholar]
- Marin B. C.; Hsu S.-W.; Chen L.; Lo A.; Zwissler D. W.; Liu Z.; Tao A. R. Plasmon-Enhanced Two-Photon Absorption in Photoluminescent Semiconductor Nanocrystals. ACS Photonics 2016, 3 (4), 526–531. 10.1021/acsphotonics.6b00037. [DOI] [Google Scholar]
- Lassiter J. B.; Aizpurua J.; Hernandez L. I.; Brandl D. W.; Romero I.; Lal S.; Hafner J. H.; Nordlander P.; Halas N. J. Close Encounters between Two Nanoshells. Nano Lett. 2008, 8 (4), 1212–1218. 10.1021/nl080271o. [DOI] [PubMed] [Google Scholar]
- Sun G.; Khurgin J. B. Comparative Study of Field Enhancement between Isolated and Coupled Metal Nanoparticles: An Analytical Approach. Appl. Phys. Lett. 2010, 97 (26), 263110. 10.1063/1.3532101. [DOI] [Google Scholar]
- Ringler M.; Schwemer A.; Wunderlich M.; Nichtl A.; Kürzinger K.; Klar T. A.; Feldmann J. Shaping Emission Spectra of Fluorescent Molecules with Single Plasmonic Nanoresonators. Phys. Rev. Lett. 2008, 100 (20), 203002. 10.1103/PhysRevLett.100.203002. [DOI] [PubMed] [Google Scholar]
- Humphrey M. G.; Lockhart-Gillett B.; Samoc M.; Skelton B. W.; Tolhurst V.-A.; White A. H.; Wilson A. J.; Yates B. F. Synthesis, Structure and Optical Limiting Properties of Organoruthenium-Chalcogenide Clusters. J. Organomet. Chem. 2005, 690 (6), 1487–1497. 10.1016/j.jorganchem.2004.12.018. [DOI] [Google Scholar]
- Roberts R. L.; Schwich T.; Corkery T. C.; Cifuentes M. P.; Green K. A.; Farmer J. D.; Low P. J.; Marder T. B.; Samoc M.; Humphrey M. G. Organometallic Complexes for Nonlinear Optics. 45. Dispersion of the Third-Order Nonlinear Optical Properties of Triphenylamine-Cored Alkynylruthenium Dendrimers. Adv. Mater. 2009, 21 (22), 2318–2322. 10.1002/adma.200803669. [DOI] [Google Scholar]
- Mertens J.; Kleemann M.-E.; Chikkaraddy R.; Narang P.; Baumberg J. J. How Light Is Emitted by Plasmonic Metals. Nano Lett. 2017, 17 (4), 2568–2574. 10.1021/acs.nanolett.7b00332. [DOI] [PubMed] [Google Scholar]
- Inasawa S.; Sugiyama M.; Yamaguchi Y. Laser-Induced Shape Transformation of Gold Nanoparticles below the Melting Point: The Effect of Surface Melting. J. Phys. Chem. B 2005, 109 (8), 3104–3111. 10.1021/jp045167j. [DOI] [PubMed] [Google Scholar]
- de la Llave E.; Herrera S. E.; Méndez De Leo L. P.; Williams F. J. Molecular and Electronic Structure of Self-Assembled Monolayers Containing Ruthenium(II) Complexes on Gold Surfaces. J. Phys. Chem. C 2014, 118 (37), 21420–21427. 10.1021/jp507199z. [DOI] [Google Scholar]
- Horton M. J.; Ojambati O. S.; Chikkaraddy R.; Deacon W. M.; Kongsuwan N.; Demetriadou A.; Hess O.; Baumberg J. J. Nanoscopy through a Plasmonic Nanolens. Proc. Natl. Acad. Sci. U. S. A. 2020, 117 (5), 2275–2281. 10.1073/pnas.1914713117. [DOI] [PMC free article] [PubMed] [Google Scholar]
- Baumberg J. J.; Aizpurua J.; Mikkelsen M. H.; Smith D. R. Extreme Nanophotonics from Ultrathin Metallic Gaps. Nat. Mater. 2019, 18, 668. 10.1038/s41563-019-0290-y. [DOI] [PubMed] [Google Scholar]
- Four M.; Riehl D.; Mongin O.; Blanchard-Desce M.; Lawson-Daku L. M.; Moreau J.; Chauvin J.; Delaire J. A.; Lemercier G. A Novel Ruthenium(II) Complex for Two-Photon Absorption-Based Optical Power Limiting in the near-IR Range. Phys. Chem. Chem. Phys. 2011, 13 (38), 17304–17312. 10.1039/c1cp21661a. [DOI] [PubMed] [Google Scholar]
- Gopinath A.; Miyazono E.; Faraon A.; Rothemund P. W. K. Engineering and Mapping Nanocavity Emission via Precision Placement of DNA Origami. Nature 2016, 535 (7612), 401–405. 10.1038/nature18287. [DOI] [PubMed] [Google Scholar]
- Chikkaraddy R.; Turek V. A.; Kongsuwan N.; Benz F.; Carnegie C.; van de Goor T.; de Nijs B.; Demetriadou A.; Hess O.; Keyser U. F.; Baumberg J. J. Mapping Nanoscale Hotspots with Single-Molecule Emitters Assembled into Plasmonic Nanocavities Using DNA Origami. Nano Lett. 2018, 18 (1), 405–411. 10.1021/acs.nanolett.7b04283. [DOI] [PMC free article] [PubMed] [Google Scholar]
- Ojambati O. S.; Chikkaraddy R.; Deacon W. D.; Horton M.; Kos D.; Turek V. A.; Keyser U. F.; Baumberg J. J. Quantum Electrodynamics at Room Temperature Coupling a Single Vibrating Molecule with a Plasmonic Nanocavity. Nat. Commun. 2019, 10 (1), 1049. 10.1038/s41467-019-08611-5. [DOI] [PMC free article] [PubMed] [Google Scholar]
- Hübner K.; Pilo-Pais M.; Selbach F.; Liedl T.; Tinnefeld P.; Stefani F. D.; Acuna G. P. Directing Single-Molecule Emission with DNA Origami-Assembled Optical Antennas. Nano Lett. 2019, 19 (9), 6629–6634. 10.1021/acs.nanolett.9b02886. [DOI] [PubMed] [Google Scholar]
- Scheibner M.; Schmidt T.; Worschech L.; Forchel A.; Bacher G.; Passow T.; Hommel D. Superradiance of Quantum Dots. Nat. Phys. 2007, 3 (2), 106–110. 10.1038/nphys494. [DOI] [Google Scholar]
- Varguet H.; Guérin S.; Jauslin H.; Colas des Francs G. Cooperative Emission in Quantum Plasmonic Superradiance. Phys. Rev. B: Condens. Matter Mater. Phys. 2019, 100 (4), 041115. 10.1103/PhysRevB.100.041115. [DOI] [Google Scholar]
- Jahnke F.; Gies C.; Aßmann M.; Bayer M.; Leymann H. a. M.; Foerster A.; Wiersig J.; Schneider C.; Kamp M.; Höfling S. Giant Photon Bunching, Superradiant Pulse Emission and Excitation Trapping in Quantum-Dot Nanolasers. Nat. Commun. 2016, 7 (1), 1–7. 10.1038/ncomms11540. [DOI] [PMC free article] [PubMed] [Google Scholar]
- Li B.; Lin L.; Lin H.; Wilson B. C. Photosensitized Singlet Oxygen Generation and Detection: Recent Advances and Future Perspectives in Cancer Photodynamic Therapy. J. Biophotonics 2016, 9 (11–12), 1314–1325. 10.1002/jbio.201600055. [DOI] [PubMed] [Google Scholar]
- Ojambati O. S.; Deacon W. M.; Chikkaraddy R.; Readman C.; Koczor-Benda Z.; Rosta E.; Scherman O. A.; Baumberg J. J.. Breaking the Selection Rules of Spin-Forbidden Molecular Absorption in Plasmonic Nanocavities. arXiv (Physics, Optics), May 11, 2020, arXiv:2005.05383; https://arxiv.org/abs/2005.05383 (accessed 2020).
- de Nijs B.; Bowman R. W.; Herrmann L. O.; Benz F.; Barrow S. J.; Mertens J.; Sigle D. O.; Chikkaraddy R.; Eiden A.; Ferrari A.; Scherman O. A.; Baumberg J. J. Unfolding the Contents of Sub-Nm Plasmonic Gaps Using Normalising Plasmon Resonance Spectroscopy. Faraday Discuss. 2015, 178, 185–193. 10.1039/C4FD00195H. [DOI] [PubMed] [Google Scholar]
- Benz F.; de Nijs B.; Tserkezis C.; Chikkaraddy R.; Sigle D. O.; Pukenas L.; Evans S. D.; Aizpurua J.; Baumberg J. J. Generalized Circuit Model for Coupled Plasmonic Systems. Opt. Express 2015, 23 (26), 33255. 10.1364/OE.23.033255. [DOI] [PubMed] [Google Scholar]
- Kleemann M.-E.; Mertens J.; Zheng X.; Cormier S.; Turek V.; Benz F.; Chikkaraddy R.; Deacon W.; Lombardi A.; Moshchalkov V. V.; Vandenbosch G. A. E.; Baumberg J. J. Revealing Nanostructures through Plasmon Polarimetry. ACS Nano 2017, 11, 850. 10.1021/acsnano.6b07350. [DOI] [PubMed] [Google Scholar]
Associated Data
This section collects any data citations, data availability statements, or supplementary materials included in this article.
Data Citations
- Ojambati O. S.; Deacon W. M.; Chikkaraddy R.; Readman C.; Koczor-Benda Z.; Rosta E.; Scherman O. A.; Baumberg J. J.. Breaking the Selection Rules of Spin-Forbidden Molecular Absorption in Plasmonic Nanocavities. arXiv (Physics, Optics), May 11, 2020, arXiv:2005.05383; https://arxiv.org/abs/2005.05383 (accessed 2020).