

Abstract
The Lac system of genes has been an important model system in understanding gene regulation. When the dimer lac repressor protein binds to the correct DNA sequence, the hinge region of the protein goes through a disorder to order transition. The hinge region is disordered when binding to nonoperator sequences. This region of the protein must pay a conformational entropic penalty to order when it is bound to operator DNA. Structural studies show that this region is flexible. Previous simulations showed that this region is disordered when free in solution without the DNA binding domain present. Our simulations corroborate that this region is extremely flexible in solution, but we find that the presence of the DNA binding domain proximal to the hinge helix and salt make the ordered conformation more favorable even without DNA present.
Keywords: Protein, LacI, Disordered proteins, MD Simulations, Metadynamics, Disorder to order transition, Salt Stability
1. Introduction
The lac system has been a model of gene regulation since 1952 .1–12 The lac repressor regulates the expression of a set of genes involved in lactose metabolism in the bacterium Escherichia coli (E. coli). When lactose is either no longer in the system or no longer the favorable source of energy in the system, a binding signal modulates the affinity of the lac repressor protein for the operator. The repressor then binds to the operator region of the operon and the gene’s expression is suppressed.13
The lac repressor is a protein of 360 amino acids that assembles into a homotetramer. The three-dimensional structure of the lac repressor provides important atomic level clues as to how the repressor performs its biological role. The structure of fragments of the DNA-binding domain (DBD)14 and regulatory domain (RD) when bound to inducer have been determined.15–17 The structure of the DBD showed that the repressor contained the helix-turn-helix (HTH) motif that is common in other proteins that bind specifically to DNA. These early studies were only able to characterize the pieces of the protein and were unable to do so for the full protein where the RD and DBD were linked by the hinge helix (HH) region.
M. Lewis et. al were able to obtain the full three-dimensional structure bound to operator-like DNA in 1996 using x-ray crystallography to obtain an image of the alpha carbons of the full molecule with resolution 2.7Å (PDB 1LBG).17 Work continued on the repressor protein bound to the operator using other methods to get better resolution.18–20 Previous experiments had determined there must be a structural change to the protein when no longer bound to operator DNA,3, 21, 22 but characterizing this through crystallography or NMR was difficult. Kaptein et al made a single mutation to the HH, V52C, and were able to solve the structure of the head piece structure (HP62), the DBD+HH, bound to operator and non-operator DNA using NMR spectroscopy (Figure 1).23, 24 This mutation showed no sign of altering the affinity of the protein for the operator site or change to the binding, it simply made the protein fluctuate less. This sequence change allowed a view of the structure bound to non-operator DNA and showed that it was disordered.
Figure 1:
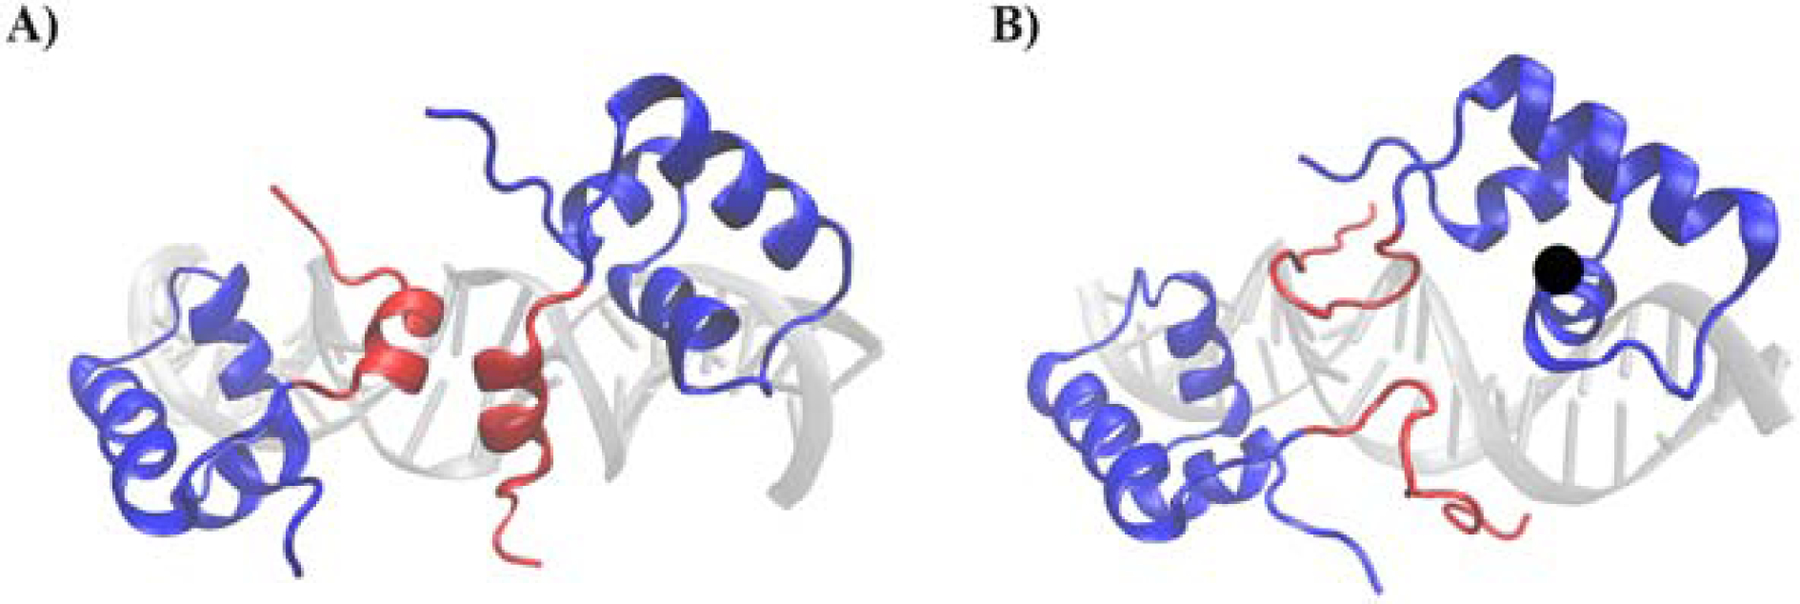
A rendering of PDB 1L1M(A) and 1OSL (B) using VMD showing the lac repressor protein’s conformation when bound to operator and non-operator DNA respectively. The HH is shown in red and the DBD is shown in blue.
Proteins and protein domains with a less well-defined structure are referred to as intrinsically disordered proteins (IDP) or intrinsically disordered regions (IDR). These types of proteins were first characterized in the mid-1990s and have been extensively studied.25–31 The secondary structures of many proteins are disordered under physiological conditions, but they can adopt specific structures in a particular functional state.26 This type of folding is often coupled with binding to the protein’s target.32 The HH of the lac repressor protein is one of these IDRs.
Although a disordered structure has been determined for the hinge helix when bound to non-operator DNA, there is still very little information on the protein when free in solution. Part of this is due to limitations of current experimental techniques to characterize disordered proteins in solution. Simulations have been performed on the hinge-helix peptide in solution33 and confirmed the tendency towards disorder of this region of the protein. Here we use computational simulation techniques to investigate the structure and conformational free energy of this system in solution when the DBD is present. To investigate the effect on the protein conformation of the ion atmosphere around DNA, which is known to substantially increases the salt concentration over bulk, we consider up to 0.4M salt.34
2. Methods
We performed metadynamics simulations starting from minimized crystal coordinates in order to compute the free energy surface for the hinge-helix with the full DNA-binding domain as a function of a set of collective variables (CVs). We chose to sample the root mean square deviation (RMSD) from the starting coordinates as our original CV and subsequently reweight the sampling to other CVs for further analysis. The studies were performed in two different ionic concentration conditions, 0.0M and 0.4M.
2.1. System Preparation
To compare the differences between the ordered and disordered states of the HH region, two metadynamics simulations were performed. We monitored the simulations to ensure that each was traversing the entire range of the collective variable. For both simulations the starting structure was the V52C mutant of the full homodimer DBD+HH (residues 1–62).23 Many previous experiments and simulations have been performed using either the PurR-GCG construct or the V52C mutant to aid dimer formation.33, 35 In order to compare most closely with previous simulations,33 both systems used the PDB structure 1L1M.23 This structure is a dimer consisting of the first 62 N-terminal residues of each monomer, crystalized to operator DNA.
To prepare the structures for simulation the DNA was removed from the starting crystal structure. Then hydrogen atoms were added using PSFGen in Visual Molecular Dynamics (VMD).36 The peptides were then solvated in explicit TIP3P37 water molecules. Then ions were randomly added to the two systems in order to match desired concentrations, 0.4 M and 0 M (neutral). The high ion system had a total of 52159 atoms while the low ion system had 52667 atoms.
All systems were minimized for 21000 steps then equilibrated for 640 ps in an NVT ensemble at 300 K. A weakly coupled Langevin thermostat38 was used to maintain constant temperature. Electrostatic interactions were computed using the particle-mesh Ewald algorithm (PME).39 The PME grid spacing was 1.0 Å.
2.2. Metadynamics Variables
The free energy landscape representing the HH unfolding pathway in the presence of the DBD was investigated using metadynamics,40, 41 an enhanced sampling method to calculate the free-energy surface as a function of a few selected collective variables (CVs). We tested a number of different collective variables including RMSD from the crystal structure, radius of gyration, endto-end distance (E2E), and helical content. Each of these CVs has desirable and undesirable characteristics.42 We concluded RMSD from the crystal structure was an adequate compromise and allowed other variations via reweighting (below). We used the RMSD of residues 50–58 from each monomer from the starting structure of each respective simulation. The systems were run using NAMD 2.1038 and the CHARMM36 force field.37, 43 The VMD package38 provided some analysis and visualization.
To begin metadynamics for systems 1 and 2, a Gaussian height of 1.0 kcal/mol was used. The systems were able to traverse the entire range of the CV at least 5 times at the initial Gaussian height. The height was subsequently reduced according to the schedule shown in Table 1 in order to get a more accurate and smooth final potential of mean force (PMF).38, 44, 45
Table 1:
The change in average ion density versus RMSD for each of the HH amino acids based on line of least squares fit from the first and last point of RMSD, 0.058 and 9.911Å respectively.
| Amino Acid | Starting Avg. Ion Count | Ending Avg. Ion Count | Change in Avg. Ion Count |
|---|---|---|---|
| Asn 50 | 0.2023 | 0.0880 | −0.1143 |
| Arg 51 | 0.4352 | 0.1850 | −0.2502 |
| Cys 52 | 0.0833 | 0.0526 | −0.0307 |
| Ala 53 | 0.0459 | 0.0794 | +0.0335 |
| Gln 54 | 0.1521 | 0.1687 | +0.0166 |
| Gln 55 | 0.2918 | 0.1578 | −0.1399 |
| Leu 56 | 0.0474 | 0.1272 | +0.0798 |
| Ala 57 | 0.0281 | 0.1887 | +0.1606 |
| Gly 58 | 0.0858 | 0.2010 | +0.1152 |
For each subsequent height the systems transited the entire range of the CV multiple times, at least 1 trip/10 ns, until the results showed regularity allowing for convergence. Every 50 ps we collected an intermediate output PMF file. Once all runs were complete, all PMFs from each Gaussian height were averaged using the block method (4 blocks/ns). Then every four points along the RMSD were averaged. The variance from the average PMF for each height is shown in Supporting Information Figure S1. System 1 was sampled for a total of 300 ns while system 2 was sampled for a total of 340 ns.
The systems were analyzed using VMD with plugins from PLUMED,46 NAMD,38 and METAGUI.47, 48 Analysis using METAGUI 3 was used to cluster the metadynamics data based on RMSD. Once clustered PLUMED was used to calculate the torsion angles of residues 51–58, and E2E distances of the HHs (N-Asn50 to O-Gly58) of each frame in those clusters. Using the 16 torsion angles of each frame, the number of consecutive helical residues (−90 <φ<−35 and −70<ψ<−15)49 was calculated. The metadynamics calculation was then reweighted to E2E distance using the original PMF and the populations of each variable per RMSD cluster. The reweighting followed the usual procedure for a biased distribution.
| (1) |
where V(xj) is the value of the original PMF at an RMSD of xj, hi(xj) is the number of frames with the new E2E CV at value i in RMSD cluster xj, Q(xj) is the bin size of the cluster at RMSD xj and hi* is the reweighted value for the new CV value for i.
3. Results
3.1. Metadynamics PMF Analysis
The results from the metadynamics simulations, shown in Figure 2(A,B), display a large difference between the two systems in different ion concentrations. These PMFs were calculated by averaging the PMFs of the simulation steps after achieving the smallest Gaussian height, 0.3 kcal/mol.
Figure 2:

(A,B), Graphs of the potential of mean force during the metadynamics simulations based on the collective variable of root mean squared deviation in high ion and low ion solutions respectively. In the low ion solution the difference in energy between the starting structure and the most energetically favorable structure is over 60 kcal/mol as shown in the insert of A. The larger graph of A shows the PMF on the same scale as the high ion system of B
Considering the system without ions, the free energy difference between the starting structure and the lower region of the basin is around 60 kcal/mol. The wide basin from ~3–9 Å is rough and in the range of about 0–5 kcal/mol. Comparing points less than an Angstrom apart shows there are large jumps of 2–3 kcal/mol instead of a smooth basin with a single minimum. This makes it more likely for the protein to stay in a single local conformation for an extended period of time. There are quite a few local minima that are similar, less than 1 kcal/mol difference, along this basin.
The PMF of the system with high ion concentration is quantitatively different. The free energy difference between the structure with both monomers being fully helical and the minimum is 12 kcal/mol, rather than over 60 kcal/mol. But at ~0.5 Å, when one of the helices has started to partially unwind, the free energy has already dropped by about 3.5 kcal/mol. Near an RMSD of ~1.2 Å when one helical turn has fully unwound or both are partially unwound, the structure is another 4 kcal/mol more favorable. These two plateaus indicate meta-stable structures. The free energy surface has a minimum from 5–5.5 Å where both helices are unwound but not stretched out. However, the entire bottom of the basin from 2–9 Å is within a 4 kcal/mol difference and relatively smooth with only one large feature. This indicates that a transition between these many states would be accessible on the few ns timescale.
3.2. Ion Concentrations
The RMSD PMFs demonstrated that there were clear differences between the two systems. In a previous study, ion concentration was found to be significant in determining the dynamics and thermodynamics of the isolated HH.33 Looking at the low ion concentration system in the current study, there are only 4 ions in the ~50,000 atom system and at no time are they within 5Å of the HH residues (50–58). In the high ion system, many statistically significant ionic interactions with the HH occur and we will focus our analysis there. We considered proximal ion density versus RMSD.
The ion density within 4 or 5 Å of all HH residues is relatively featureless and flat along the RMSD (slopes of −0.007 ions/Å). The density does not change depending on the conformation (RMSD) of the HH region. When ion density around individual residues is investigated, some trends can be seen. The ion densities within 5 Å of three of the residues (Cys52, Ala53, Gln54) remain fairly constant and do not change depending on the RMSD. (Table 1) These three residues are known to mostly interact with the other HH monomer by making protein-protein contacts.19, 50 For the polar residues Asn50, Arg51, and Gln55 there is a greater concentration of ions within 5Å of the residue when the HH has a lower RMSD, which is when the HH is more helical (Table 1). The concentration for these 3 residues steadily increases as the RMSD decreases. The charged arginine at residue 51 is expected to have a high density of ions surrounding it due to its positive charge, but it is interesting to see how the folding of the HH region affects the result. The asparagine at position 50 has the lowest slope and densities of the 3 residues; its increase in ion density is probably related to its proximity to arginine 51. The third residue with an inverse relationship between ion density and RMSD is glutamine 55. This molecule is facing away from the DNA binding surface and interacting with the core domain.19, 50
When the protein is in the helical conformation, but without DNA or the core domain present, residue 55 is facing out into solution. The three end residues of the HH (Table 1) show a positive correlation, the greater the RMSD the greater the ion density surrounding them. As the RMSD increases, the HH becomes less tightly coiled. This allows the ends of the HH to extend farther into the solution, allowing more ions to be near, due to not having as much steric hindrance from the rest of the surrounding protein. At these higher RMSDs, residues 56–58 also are better hydrated having more (Supplemental Figure 2) solution accessible surface.
3.3. Reweighted E2E Results
To further investigate the conformational free energy surface for this system, the PMFs for both systems were reweighted based on end-to-end (E2E) distance, as described in equation 1. The distances considered are from the first heavy atom of residue 50 to the last heavy atom of residue 58 for both monomers. Thus, we chose the nitrogen of Asn50 to the oxygen on Gly58. In crystal form, the length of both of these distances is 14Å. In our starting structure, those distances are 14.5Å and 11.5Å, denoted as (14.5, 11.5), for monomer 1 and 2 respectively. Since these two monomers are independent and have nonsymmetric conformations, we consider the re-weighted energetic profile as the E2E distance of monomer 1 versus the E2E distance of monomer 2 versus the free energy of the system.
Figure 3 shows the minima for both systems are near the helical the starting structure. For the system in high ion concentration the minimum is seen at (14.75, 11.25), while the system in low ion concentration has minimum at (14.25, 11.25). (Figure 3, A and B) When looking at the structures of the protein with E2E distances near these minima, ± .25Å, the majority of the structures are helical, similar to the starting structure, but some can be found with an RMSD up to 3.07Å.
Figure 3:

A,B – Free energy versus end to end distances of the two monomers for the high ion and low ion systems respectively.
The re-weighted PMF in terms of end-to-end distances of the helices gives a different perspective from the RMSD from the crystal structure. While neither CV may be optimal both give insight into the collection of the most energetically favorable structures.
We find a persistence of a lack of symmetry despite the sequence identity. Both systems favor asymmetric conformations with monomers exploring different lengths and thus different structures. Monomer 1 is usually longer than monomer 2 in Figure 3. Conformations where the opposite is true are less favorable.
4. Discussion and Conclusions
The trait of coupled folding and binding is common in protein-DNA recognition.51–54 LacI repressor has been an often studied model of this sort of recognition pathway.11, 18 This pathway has many complexities that contribute to its function as reflected in the inter-protein interactions, protein-solution interactions, and protein-DNA interactions. To better understand the details of the protein conformational energetic changes, we have looked at the mechanism of the range of protein conformations without the added influence of DNA to determine the protein’s propensity for the required shape. In this work, we have presented a quantitative analysis of the structural transition of the LacI HH, in the presence of the DBD, from helical to disordered conformation in two different solution conditions. The high salt solution is a model for the counterion-condensed atmosphere the protein would be in when binding to DNA.
Previously it has been noted that the protein should be disordered in solution, without considering its free energy profile to transition from this state.3, 21, 22 We found that the HH prefers to be in a disordered conformation when free in solution, with or without salt, regardless of the presence of the DBD. The free energy required to make the transition to the helical state is however considerably lowered when the DBD is present and ions are added to the system. This is mechanistically consistent with the understanding that the area surrounding DNA is highly saturated with ions34 and so would promote helical propensity. Thus, when the protein gets closer to any DNA, an environment with a higher ion concentration, the cost of helix formation is lowered. The amount of free energy needed by the operator sequence to secure that change is then reasonable in comparison to the HH alone in solution.33 We note that all simulation studies show a dependence on force fields and recent studies have shown issues when considering unstructured domains with force fields designed for folded proteins.55
Previous studies56,57, 58 have shown that an increase in ionic strength shifts the equilibrium towards helical stability in alanine rich peptides. They found that concentrations below 0.15M had a linear effect while higher concentrations followed a more exponential dependence. We saw the effect ion concentration has on charged or polar residues, specifically the importance of Arg51 and Gln55. According to previous studies19, 50 Asn50, Arg51, and Gln55 all associate with the core domain while bound to operator DNA. This means that when the HH is helical and the core domain is not present, they are facing out towards the solution and able to interact with the most ions. Future studies will be required to study whether this trend of high ion-protein interaction still holds when the core domain is present or if the protein-protein interactions out compete them. Residues 52 and 53 are consistently surrounded by the two lowest ion concentrations, this correlates with both having strong monomer-monomer interactions.50 Residue 52 was specifically chosen as the one to be mutated (V52C) because it was the only one that had no direct interactions with DNA or the core domain.35 It only interacts with the other HH.
The PMFs reweighted based on end-to-end distances gave additional insight into the 3-dimensional structure of the protein when free in solution. Although the RMSD PMFs gave markedly different numbers between the ordered and disordered structures, the reweighted E2E PMFs of the two systems are quite similar to each other. This points toward possible favored structural characteristics in solution even with a broad conformational distribution. Despite the environments being different, without DNA present these two systems both favored structures with similar end-to-end lengths. Further investigations into what specific characteristics other than this are favored should be pursued. More information on the structure of the protein in solution could help our understanding of the protein as a whole.
Our results show a clear difference between the free energy landscape in low and high ion concentrations. This gives a better idea of the free energetic changes as the protein moves through solution to recognize DNA. These results build upon Spronk’s work59 that showed the dimer to be necessary for helical formation. When comparing to our previous work33 of the single HH alone in solution, adding the rest of the DBD complex significantly lowers the free energy penalty between the ordered and disordered conformations when in a solution similar to that surrounding DNA. The physical principles that emerge from this study add to our understanding of IDPs, specifically intrinsically disordered regions that change conformation upon binding DNA.
Supplementary Material
Supporting Figure 1: Average variance of PMFs at each Gaussian height for simulations versus RMSD from starting helical structure. A) is of the high ion system, B) is of the low ion system.
Supporting Figure 2: The average number of water molecules within 5 Angstroms of the specific protein residue versus the RMSD of the HHs. Red = Leucine 56, Green = Alanine 57, Blue = Glycine 58
Highlights.
When the Lac repressor protein binds to the correct DNA sequence, the hinge region of the protein goes through a disorder to order transition.
Previous simulations showed that this region is disordered when free in solution without the DNA binding domain present but those studies lacked the DNA binding domain and the saline environment.
Our simulations find that the presence of the DNA binding domain proximal to the hinge helix and salt make the ordered conformation more probable even without DNA present.
Acknowledgements:
The authors thank Dr. Cheng Zhang for many helpful discussions. The Sealy Center for Structural Biology scientific computing staff is acknowledged for computational support. We gratefully acknowledge the Robert A. Welch Foundation (H-0037), and the National Institutes of Health (GM-037657) for partial support of this work. This work used the Extreme Science and Engineering Discovery Environment (XSEDE), which is supported by National Science Foundation grant number ACI-1548562. The authors also acknowledge the Texas Advanced Computing Center (TACC) at The University of Texas at Austin for providing HPC resources that have contributed to the research results reported within this article. URL: http://www.tacc.utexas.edu
Footnotes
Publisher's Disclaimer: This is a PDF file of an unedited manuscript that has been accepted for publication. As a service to our customers we are providing this early version of the manuscript. The manuscript will undergo copyediting, typesetting, and review of the resulting proof before it is published in its final form. Please note that during the production process errors may be discovered which could affect the content, and all legal disclaimers that apply to the journal pertain.
Declaration of interests
The authors declare that they have no known competing financial interests or personal relationships that could have appeared to influence the work reported in this paper.
References
- [1].Monod J (1966) From enzymatic adaptation to allosteric transitions, Science 154, 475–483. [DOI] [PubMed] [Google Scholar]
- [2].Monod J, and Cohn M (1952) La Biosynthègse Induite Des Enzymes (Adaptation Enzymatique), In Advances in Enzymology, pp 67–119. [PubMed] [Google Scholar]
- [3].Record M, DeHaseth P, and Lohman T (1977) Nonspecific interaction of lac repressor with DNA: an association reaction driven by counterion release, Biochemistry 16, 4783–4790. [DOI] [PubMed] [Google Scholar]
- [4].Record M, Frank D, Saecker R, Bond J, Capp M, Tsodikov O, Melcher S, and Levandoski M (1997) Thermodynamics of the interactions of Lac repressor with variants of the symmetric Lac operator: effects of converting a consensus site to a non-specific site 1, Journal of Molecular Biology 267, 1186–1206. [DOI] [PubMed] [Google Scholar]
- [5].Barkley MD, Lewis PA, and Sullivan GE (1981) Ion effects on the lac repressor--operator equilibrium, Biochemistry 20, 3842–3851. [DOI] [PubMed] [Google Scholar]
- [6].Winter RB, and Hippel PHV (1981) Diffusion-driven mechanisms of protein translocation on nucleic acids. 2. The Escherichia coli lac repressor-operator interaction: equilibrium measurements, Biochemistry 20, 6948–6960. [DOI] [PubMed] [Google Scholar]
- [7].Nick H, Arndt K, Boschelli F, Jarema MA, Lillis M, Sadler J, Caruthers M, and Lu P (1982) lac repressor-lac operator interaction: NMR observations, Proc Natl Acad Sci U S A 79, 218–222. [DOI] [PMC free article] [PubMed] [Google Scholar]
- [8].Ozarowski A, Barry JK, Matthews KS, and Maki AH (1999) Ligand-induced conformational changes in lactose repressor: a phosphorescence and ODMR study of single-tryptophan mutants, Biochemistry 38, 6715–6722. [DOI] [PubMed] [Google Scholar]
- [9].Khoury AM, Nick HS, and Lu P (1991) In vivo interaction of Escherichia coli lac repressor N-terminal fragments with the lac operator, J Mol Biol 219, 623–634. [DOI] [PubMed] [Google Scholar]
- [10].Sauer RT (1996) Lac repressor at last, Structure 4, 219–222. [DOI] [PubMed] [Google Scholar]
- [11].Jacob F, and Monod J (1961) Genetic regulatory mechanisms in the synthesis of proteins, J Mol Biol 3, 318–356. [DOI] [PubMed] [Google Scholar]
- [12].Wilson CJ, Zhan H, Swint-Kruse L, and Matthews KS (2007) The lactose repressor system: paradigms for regulation, allosteric behavior and protein folding, Cellular and molecular life sciences : CMLS 64, 3–16. [DOI] [PMC free article] [PubMed] [Google Scholar]
- [13].Parker J (2001) lac Operon, In Encyclopedia of Genetics (Brenner S, and Miller JH, Eds.), p 1070, Academic Press, Cambridge, MA. [Google Scholar]
- [14].Kaptein R, Zuiderweg ER, Scheek RM, Boelens R, and van Gunsteren WF (1985) A protein structure from nuclear magnetic resonance data. lac repressor headpiece, J Mol Biol 182, 179–182. [DOI] [PubMed] [Google Scholar]
- [15].Friedman AM, Fischmann TO, and Steitz TA (1995) Crystal structure of lac repressor core tetramer and its implications for DNA looping, Science 268, 1721–1727. [DOI] [PubMed] [Google Scholar]
- [16].Harrison SC (1991) A structural taxonomy of DNA-binding domains, Nature 353, 715–719. [DOI] [PubMed] [Google Scholar]
- [17].Lewis M, Chang G, Horton NC, Kercher MA, Pace HC, Schumacher MA, Brennan RG, and Lu P (1996) Crystal structure of the lactose operon repressor and its complexes with DNA and inducer, Science 271, 1247–1254. [DOI] [PubMed] [Google Scholar]
- [18].Bell CE, and Lewis M (2001) The Lac repressor: a second generation of structural and functional studies, Curr Opin Struct Biol 11, 19–25. [DOI] [PubMed] [Google Scholar]
- [19].Bell CE, and Lewis M (2000) A closer view of the conformation of the Lac repressor bound to operator, Nat Struct Biol 7, 209–214. [DOI] [PubMed] [Google Scholar]
- [20].Bell CE, and Lewis M (2001) Crystallographic analysis of Lac repressor bound to natural operator O1, J Mol Biol 312, 921–926. [DOI] [PubMed] [Google Scholar]
- [21].Gilbert W, and Maxam A (1973) The nucleotide sequence of the lac operator, Proc Natl Acad Sci U S A 70, 3581–3584. [DOI] [PMC free article] [PubMed] [Google Scholar]
- [22].Record M, DeHaseth P, Gross C, and Burgess R (1977) Measurement of binding constants for protein-DNA interactions by DNA-cellulose chromatography, Biochemistry 16, 4777–4783. [DOI] [PubMed] [Google Scholar]
- [23].Kalodimos CG, Bonvin AM, Salinas RK, Wechselberger R, Boelens R, and Kaptein R (2002) Plasticity in protein-DNA recognition: lac repressor interacts with its natural operator 01 through alternative conformations of its DNA-binding domain, EMBO J 21, 2866–2876. [DOI] [PMC free article] [PubMed] [Google Scholar]
- [24].Kalodimos CG, Biris N, Bonvin AM, Levandoski MM, Guennuegues M, Boelens R, and Kaptein R (2004) Structure and flexibility adaptation in nonspecific and specific protein-DNA complexes, Science 305, 386–389. [DOI] [PubMed] [Google Scholar]
- [25].Dunker AK, Brown CJ, Lawson JD, Iakoucheva LM, and Obradovic Z (2002) Intrinsic disorder and protein function, Biochemistry 41, 6573–6582. [DOI] [PubMed] [Google Scholar]
- [26].Dunker AK, Lawson JD, Brown CJ, Williams RM, Romero P, Oh JS, Oldfield CJ, Campen AM, Ratliff CM, Hipps KW, Ausio J, Nissen MS, Reeves R, Kang C, Kissinger CR, Bailey RW, Griswold MD, Chiu W, Garner EC, and Obradovic Z (2001) Intrinsically disordered protein, Journal of molecular graphics & modelling 19, 26–59. [DOI] [PubMed] [Google Scholar]
- [27].Dyson HJ, and Wright PE (2005) Intrinsically unstructured proteins and their functions, Nature reviews. Molecular cell biology 6, 197–208. [DOI] [PubMed] [Google Scholar]
- [28].Hsu WL, Oldfield C, Meng J, Huang F, Xue B, Uversky VN, Romero P, and Dunker AK (2012) Intrinsic protein disorder and protein-protein interactions, Pacific Symposium on Biocomputing. Pacific Symposium on Biocomputing, 116–127. [PubMed] [Google Scholar]
- [29].Oldfield CJ, Xue B, Van YY, Ulrich EL, Markley JL, Dunker AK, and Uversky VN (2013) Utilization of protein intrinsic disorder knowledge in structural proteomics, Biochimica et biophysica acta 1834, 487–498. [DOI] [PMC free article] [PubMed] [Google Scholar]
- [30].Uversky VN, Oldfield CJ, and Dunker AK (2005) Showing your ID: intrinsic disorder as an ID for recognition, regulation and cell signaling, J Mol Recognit 18, 343–384. [DOI] [PubMed] [Google Scholar]
- [31].Tompa P (2002) Intrinsically unstructured proteins, Trends in biochemical sciences 27, 527–533. [DOI] [PubMed] [Google Scholar]
- [32].Rohs R, Jin X, West SM, Joshi R, Honig B, and Mann RS (2010) Origins of specificity in protein-DNA recognition, Annu Rev Biochem 79, 233–269. [DOI] [PMC free article] [PubMed] [Google Scholar]
- [33].Seckfort D, and Montgomery Pettitt B (2019) Price of disorder in the lac repressor hinge helix, Biopolymers 110, e23239. [DOI] [PMC free article] [PubMed] [Google Scholar]
- [34].Lai C-L, Chen C, Ou S-C, Prentiss M, and Pettitt BM (2020) Interactions between DNA double helices, Phys. Rev. E in press. [DOI] [PubMed] [Google Scholar]
- [35].Swint-Kruse L, Matthews KS, Smith PE, and Pettitt BM (1998) Comparison of simulated and experimentally determined dynamics for a variant of the Lacl DNA-binding domain, Nlac-P, Biophys J 74, 413–421. [DOI] [PMC free article] [PubMed] [Google Scholar]
- [36].Humphrey W, Dalke A, and Schulten K (1996) VMD: visual molecular dynamics, J Mol Graph 14, 33–38, 27–38. [DOI] [PubMed] [Google Scholar]
- [37].MacKerell AD, Bashford D, Bellott M, Dunbrack RL, Evanseck JD, Field MJ, Fischer S, Gao J, Guo H, Ha S, Joseph-McCarthy D, Kuchnir L, Kuczera K, Lau FT, Mattos C, Michnick S, Ngo T, Nguyen DT, Prodhom B, Reiher WE, Roux B, Schlenkrich M, Smith JC, Stote R, Straub J, Watanabe M, Wiorkiewicz-Kuczera J, Yin D, and Karplus M (1998) All-atom empirical potential for molecular modeling and dynamics studies of proteins, J Phys Chem B 102, 3586–3616. [DOI] [PubMed] [Google Scholar]
- [38].Phillips JC, Braun R, Wang W, Gumbart J, Tajkhorshid E, Villa E, Chipot C, Skeel RD, Kale L, and Schulten K (2005) Scalable molecular dynamics with NAMD, J Comput Chem 26, 1781–1802. [DOI] [PMC free article] [PubMed] [Google Scholar]
- [39].Darden T, York D, and Pedersen L (1993) Particle mesh Ewald: An N⋅log(N) method for Ewald sums in large systems, J Chem Phys 98, 10089–10092. [Google Scholar]
- [40].Barducci A, Bonomi M, and Parrinello M (2011) Metadynamics, Wires Comput Mol Sci 1, 826–843. [Google Scholar]
- [41].Barducci A, Bussi G, and Parrinello M (2008) Well-tempered metadynamics: a smoothly converging and tunable free-energy method, Phys Rev Lett 100, 020603. [DOI] [PubMed] [Google Scholar]
- [42].Fiorin G, Klein ML, and Hénin J (2013) Using collective variables to drive molecular dynamics simulations, Mol Phys 111, 3345–3362. [Google Scholar]
- [43].Huang J, and MacKerell AD Jr. (2013) CHARMM36 all-atom additive protein force field: validation based on comparison to NMR data, J Comput Chem 34, 2135–2145. [DOI] [PMC free article] [PubMed] [Google Scholar]
- [44].Bai Q, Shen Y, Jin N, Liu H, and Yao X (2014) Molecular modeling study on the dynamical structural features of human smoothened receptor and binding mechanism of antagonist LY2940680 by metadynamics simulation and free energy calculation, Biochimica et biophysica acta 1840, 2128–2138. [DOI] [PubMed] [Google Scholar]
- [45].Liu N, Duan M, and Yang M (2017) Structural Properties of Human IAPP Dimer in Membrane Environment Studied by All-Atom Molecular Dynamics Simulations, Sci Rep 7, 7915. [DOI] [PMC free article] [PubMed] [Google Scholar]
- [46].Bonomi M, Branduardi D, Bussi G, Camilloni C, Provasi D, Raiteri P, Donadio D, Marinelli F, Pietrucci F, Broglia RA, and Parrinello M (2009) PLUMED: A portable plugin for free-energy calculations with molecular dynamics, Comput Phys Commun 180, 1961–1972. [Google Scholar]
- [47].Biarnés X, Pietrucci F, Marinelli F, and Laio A (2012) METAGUI. A VMD interface for analyzing metadynamics and molecular dynamics simulations, Comput Phys Commun 183, 203–211. [Google Scholar]
- [48].Giorgino T, Laio A, and Rodriguez A (2017) METAGUI 3: A graphical user interface for choosing the collective variables in molecular dynamics simulations, Comput Phys Commun 217, 204–209. [Google Scholar]
- [49].Langel U, Cravatt B, Graslund A, von Heijne N, Zorko M, Land T, and Niessen S (2009) Introduction to Peptides and Proteins, 1st ed., CRC Press. [Google Scholar]
- [50].Zhan H, Swint-Kruse L, and Matthews KS (2006) Extrinsic interactions dominate helical propensity in coupled binding and folding of the lactose repressor protein hinge helix, Biochemistry 45, 5896–5906. [DOI] [PMC free article] [PubMed] [Google Scholar]
- [51].Jain VP, and Tu RS (2011) Coupled folding and specific binding: fishing for amphiphilicity, Int J Mol Sci 12, 1431–1450. [DOI] [PMC free article] [PubMed] [Google Scholar]
- [52].Moody CL, Tretyachenko-Ladokhina V, Laue TM, Senear DF, and Cocco MJ (2011) Multiple conformations of the cytidine repressor DNA-binding domain coalesce to one upon recognition of a specific DNA surface, Biochemistry 50, 6622–6632. [DOI] [PubMed] [Google Scholar]
- [53].Rogers JM, Wong CT, and Clarke J (2014) Coupled folding and binding of the disordered protein PUMA does not require particular residual structure, J Am Chem Soc 136, 5197–5200. [DOI] [PMC free article] [PubMed] [Google Scholar]
- [54].Staby L, O’Shea C, Willemoes M, Theisen F, Kragelund BB, and Skriver K (2017) Eukaryotic transcription factors: paradigms of protein intrinsic disorder, Biochem J 474, 2509–2532. [DOI] [PubMed] [Google Scholar]
- [55].Drake JA, and Pettitt BM (2015) Force field-dependent solution properties of glycine oligomers, J Comput Chem 36, 1275–1285. [DOI] [PMC free article] [PubMed] [Google Scholar]
- [56].Scholtz JM, York EJ, Stewart JM, and Baldwin RL (1991) A neutral, water-soluble, .alpha.-helical peptide: the effect of ionic strength on the helix-coil equilibrium, Journal of the American Chemical Society 113, 5102–5104. [Google Scholar]
- [57].Xiong K, Asciutto EK, Madura JD, and Asher SA (2009) Salt Dependence of an α-Helical Peptide Folding Energy Landscapes, Biochemistry 48, 10818–10826. [DOI] [PMC free article] [PubMed] [Google Scholar]
- [58].Lacroix E, Viguera AR, and Serrano L (1998) Elucidating the folding problem of α-helices: local motifs, long-range electrostatics, ionic-strength dependence and prediction of NMR parameters11Edited by Fersht AR, Journal of Molecular Biology 284, 173–191. [DOI] [PubMed] [Google Scholar]
- [59].Spronk CA, Slijper M, van Boom JH, Kaptein R, and Boelens R (1996) Formation of the hinge helix in the lac repressor is induced upon binding to the lac operator, Nat Struct Biol 3, 916–919. [DOI] [PubMed] [Google Scholar]
- [60].Anfinsen C (1973) Principles that Govern the Folding of Protein Chains, Science 181. [DOI] [PubMed] [Google Scholar]
- [61].Damodaran S, and Kinsella JE (1982) Effects of Ions on Protein Conformation and Functionality, In ACS Symposium Series (Society AC, Ed.), pp 327–357, @ACHS. [Google Scholar]
Associated Data
This section collects any data citations, data availability statements, or supplementary materials included in this article.
Supplementary Materials
Supporting Figure 1: Average variance of PMFs at each Gaussian height for simulations versus RMSD from starting helical structure. A) is of the high ion system, B) is of the low ion system.
Supporting Figure 2: The average number of water molecules within 5 Angstroms of the specific protein residue versus the RMSD of the HHs. Red = Leucine 56, Green = Alanine 57, Blue = Glycine 58