
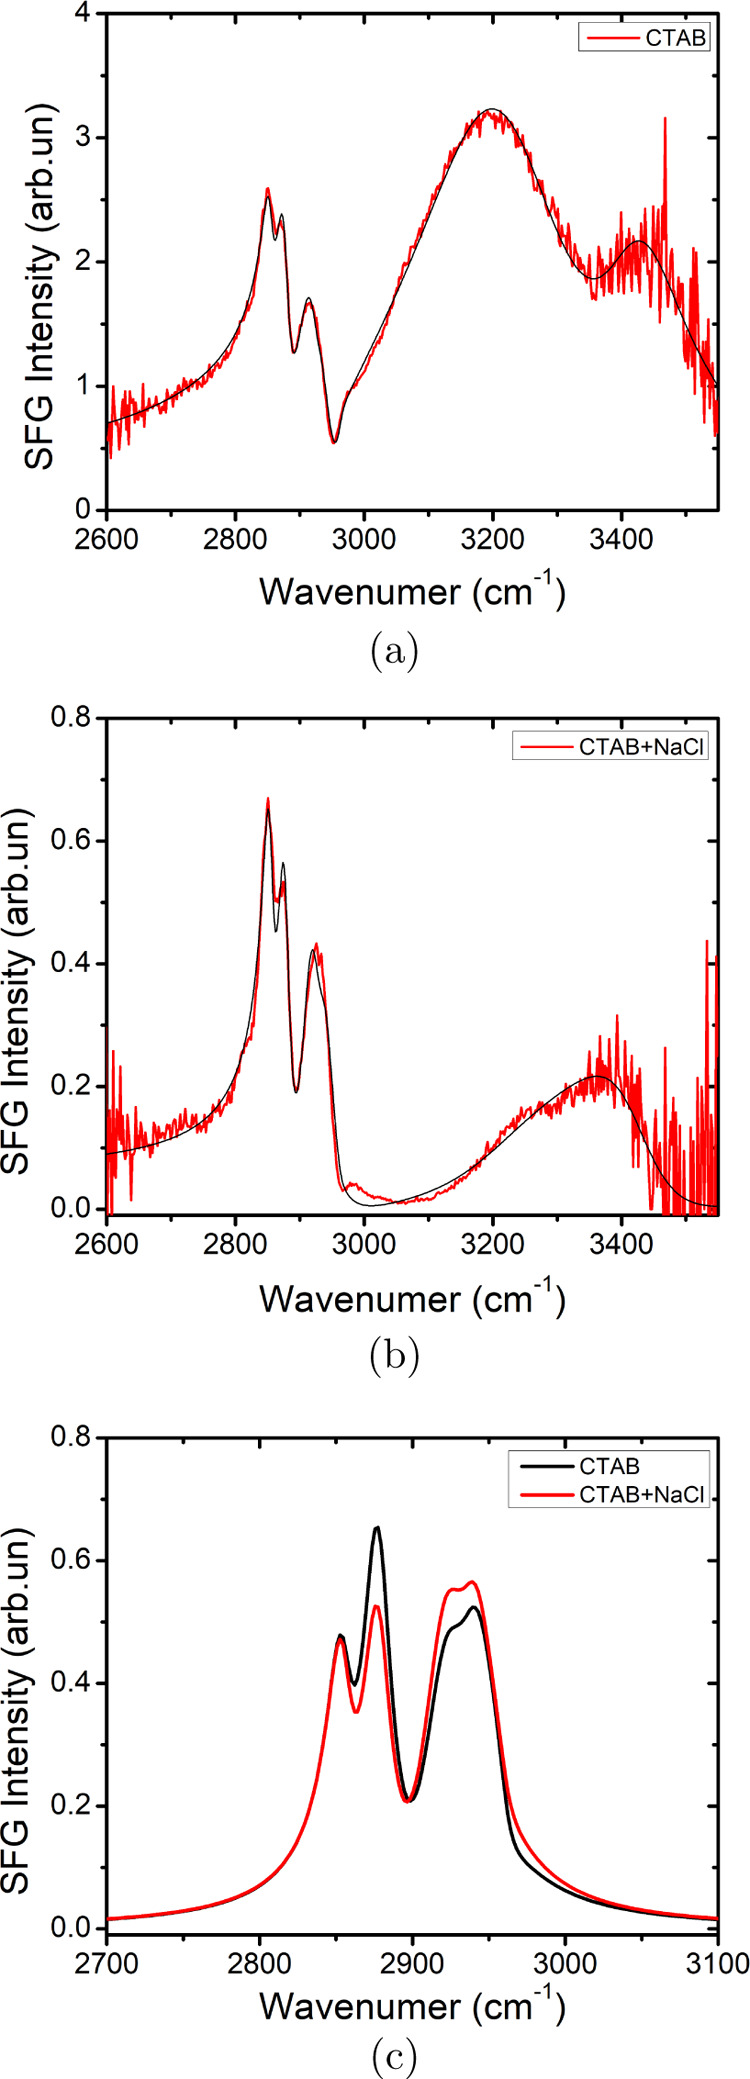
Figure 3.
SFG spectra of CTAB (a) in the absence of salt (b) with 5.5 m NaCl. (c) Comparison of intensities of exclusively the peaks corresponding to C–H modes based on fits of (a,b). [Please note the different scale on the y-axis for panel (a,b)].
Official websites use .gov
A
.gov website belongs to an official
government organization in the United States.
Secure .gov websites use HTTPS
A lock (
) or https:// means you've safely
connected to the .gov website. Share sensitive
information only on official, secure websites.
SFG spectra of CTAB (a) in the absence of salt (b) with 5.5 m NaCl. (c) Comparison of intensities of exclusively the peaks corresponding to C–H modes based on fits of (a,b). [Please note the different scale on the y-axis for panel (a,b)].