

SUMMARY
Dietary nutrients shape complex interactions between hosts and their commensal gut bacteria, further promoting flexibility in host-microbiota associations that can drive nutritional symbiosis. However, it remains less clear if diet-dependent host signaling mechanisms also influence these associations. Using Drosophila, we show here that nuclear factor κB (NF-κB)/Relish, an innate immune transcription factor emerging as a signaling node linking nutrient-immune-metabolic interactions, is vital to adapt gut microbiota species composition to host diet macronutrient composition. We find that Relish is required within midgut enterocytes to amplify host-Lactobacillus associations, an important bacterial mediator of nutritional symbiosis, and thus modulate microbiota composition in response to dietary adaptation. Relish limits diet-dependent transcriptional inducibility of the cap-dependent translation inhibitor 4E-BP/Thor to control microbiota composition. Furthermore, maintaining cap-dependent translation in response to dietary adaptation is critical to amplify host-Lactobacillus associations. These results highlight that NF-κB-dependent host signaling mechanisms, in coordination with host translation control, shape diet-microbiota interactions.
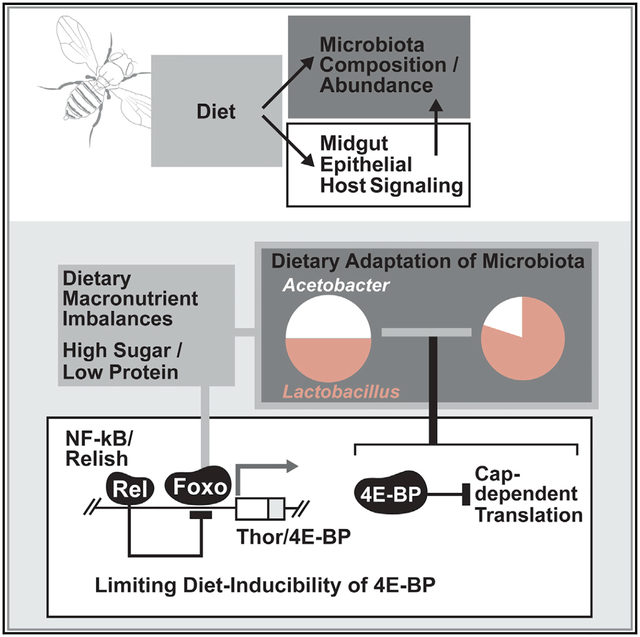
Graphical Abstract
In Brief
Vandehoef et al. show that the Drosophila homolog of NF-κB, Relish, can modulate diet-dependent shifts in intestinal microbiota composition through limiting the inducibility of 4E-BP/Thor. 4E-BP is a critical regulator of cap-dependent translation, which dictates host-microbiota associations in response to sugar-rich, protein-poor dietary imbalances.
INTRODUCTION
Virtually all metazoans (“hosts”) are associated with microorganisms, constituting a holobiont (Simon et al., 2019). Host-associated bacteria and other microorganisms, thus, play a central role in host biology, ecology, and evolution (Bordenstein and Theis, 2015; Ley et al., 2008). In bilaterians specifically, the intestinal tract serves as a primary residence for symbiotic commensal bacteria (microbiota) that promote various aspects of host function (Fisher et al., 2017; Gilbert and Neufeld, 2014; Simon et al., 2019). At its simplest, the intestine is comprised of barrier epithelial cells lining a lumen, a mucin-derived protective membrane, and luminal contents (various microorganisms and nutrients). Each of these components is in constant contact with one another, supporting multi-directional communication between the host, microbiota, and environment (dietary nutrients) to maintain homeostasis of the holobiont. This organizational structure also invites flexibility, allowing host-associated intestinal bacteria, and subsequently the host itself, to adapt to dietary changes (Conlon and Bird, 2014; De Filippo et al., 2010; Flint et al., 2012; Kau et al., 2011; Keebaugh et al., 2019; Parks et al., 2013; Smith et al., 2013; Sonnenburg and Bäckhed, 2016).
Indeed, adaptation to host dietary changes constitutes a selective pressure affecting intestinal bacterial diversity across taxa (Fisher et al., 2017; Ley et al., 2008). Short- or long-term changes in dietary macronutrients can also acutely influence host-associated microbiota (Conlon and Bird, 2014). In general, the composition of host diet shapes the diversity and species composition of the intestinal bacterial community. The “match’ between diet and microbiota composition can promote uptake and allocation of nutrients in the host through a variety of bacterial-dependent mechanisms, including: (1) breaking down complex energy substrates, (2) altering nutrient assimilation rates, (3) synthesizing essential molecules that are limited in certain diets, and (4) modulating host nutrient-sensing signaling pathways (Douglas, 2011; Karasov and Douglas, 2013; Kostic et al., 2013; Ma et al., 2015; Richardson, 2010; Roh et al., 2008; Storelli et al., 2011, 2018; Wong et al., 2014). This nutritional symbiosis between host and microbiota can, thus, influence host fitness in response to dietary adaptation (Bäckhed et al., 2004; Conlon and Bird, 2014; Keebaugh et al., 2018, 2019; Smith et al., 2013; Sonnenburg and Bäckhed, 2016; Storelli et al., 2011, 2018). In turn, the intestine provides a nutrient-rich environment for specific bacterial species and a vehicle for their transmission by feces (Martino et al., 2018).
Host-microbiota associations often form facultative (or dispensable) symbiotic relationships, which are especially common between host and intestinal bacteria. Facultative relationships are important for nutritional symbiosis and are flexible in nature: features that are crucial for bacterial adaptation to acute or long-term shifts in host dietary nutrients (Fisher et al., 2017; Martino et al., 2018; Storelli et al., 2018). These types of symbiotic relationships, although not essential for host survival, can influence many aspects of host biology, including development, growth, and physiology (Douglas, 2011; Richardson, 2010; Shin et al., 2011; Wong et al., 2014).
Although diet is one of the major driving forces behind symbiotic host-bacterial associations, less is known about host signaling mechanisms that may influence diet-microbiota interactions. Genetic and genomic analyses across taxa have provided clear evidence for the importance of host genetic control in shaping microbiota diversity (Goodman et al., 2009; Ma et al., 2019). Specifically, host innate and adaptive immune signaling systems appear to play a central role in the persistence of symbiotic intestinal microbiota (Broderick and Lemaitre, 2012; Charroux and Royet, 2012; Douglas, 2011; Goodman et al., 2009; Vijay-Kumar et al., 2010). Within the intestine, strict regulation of innate immune signaling in particular is critical for preventing excessive immune responses to symbiotic, “innocuous” bacteria (Lhocine et al., 2008; Ryu et al., 2008). Resident intestinal microbiota can induce innate immune signaling in barrier epithelial cells, whereas negative feedback mechanisms limit the induction of immune factors (such as anti-microbial peptides) that can modulate luminal bacterial composition (Ryu et al., 2008).
Furthermore, innate immune signaling pathways have co-evolved with metabolic (and nutrient-sensing) signaling pathways to elicit coordinated responses (Odegaard and Chawla, 2013). Certain tissues, such as the intestine, consequently have distinct cell types that promote both nutrient and microbe sensing, allowing for bidirectional communication between signaling pathways that respond to diverse external stimuli (such as bacteria and diet). Host innate immune signaling is, thus, likely to influence the trialogue between diet, microbiota, and host genetics that shapes the intestinal bacterial community to optimize nutritional homeostasis.
Invertebrate models provide unique advantages to explore the complex (and ancient) mechanistic integration of these core components of host biology and evolution, including well-defined intestinal (midgut) commensal microbe populations (Charroux and Royet, 2012; Douglas, 2011; Engel and Moran, 2013; Karasov and Douglas, 2013; Ma et al., 2015; Richardson, 2010). Here, we exploit the fruit fly Drosophila melanogaster as a model to uncover an ancestral role for the innate immune transcription factor nuclear factor κB (NF-κB) in shaping microbiota composition in response to dietary adaptation. NF-κB transcription factors, evolutionarily conserved regulators of innate immunity (Buchon et al., 2014; Oeckinghaus et al., 2011), have emerged as a critical signaling node linking nutrient-immune-metabolic interactions. We found that Drosophila NF-κB/Relish, within the midgut epithelium, is required for adapting gut microbe species composition to host diet macronutrient composition by modulating diet-dependent host-Lactobacillus associations, an important bacterial mediator of facultative nutritional symbiosis (Martino et al., 2018; Storelli et al., 2011, 2018). Relish influences these diet-microbiota interactions by modulating protein synthesis through control of 4E-BP/Thor, a cap-dependent translation inhibitor. The integration of host innate immunity and translation, thus, appears to be a critical host signaling node in modulating diet-microbiota interactions.
RESULTS
Relish Function in the Midgut Epithelium Shapes Microbiota Abundance and Composition in Response to Dietary Adaptation
To elucidate possible interactions between diet, host innate immune signaling, and the midgut commensal bacteria in Drosophila, we first developed an experimental strategy to explore the dietary adaptation of microbiota composition. Mated adult female flies (genetic controls) were exposed to three independent dietary conditions of various macronutrient composition and caloric content over a 5- to 8-day period after rearing, mating, and maturing on macronutrient diverse and high-calorie food (Figure S1A). Diets varied in their ratios of sugar (in the form of sucrose) and yeast (protein), including (1) a balanced standard diet (1:1 (sugar:protein) Std.), (2) an imbalanced high-sugar low-yeast diet (16:1, HS-LY), and (3) an imbalanced high-yeast low-sugar diet (1:16, HY-LS) (Skorupa et al., 2008). Using non-selective bacterial agar cultures, we discovered slight increases in midgut bacterial abundance (CFU) in flies fed a HY-LS diet and slight decreases in flies fed a HS-LY diet, compared to flies fed a Std. diet (Figure 1A).The Std. and HS-LY diets are higher in calories, whereas the HY-LS diet is lower (dietary protein intake can inhibit feeding) (Skorupa et al., 2008; Figure 1B). The midgut bacterial composition of flies fed a Std. diet presented as an amalgamation of Acetobacter and Lactobacillus genera (assayed by 16S rRNA gene sequencing; Figure 1C). These two genera are the most common in D. melanogaster laboratory strains (Broderick et al., 2014). Contrastingly, flies fed imbalanced HY-LS or HS-LY diets were strongly enriched in host-Lactobacillus associations (Figure 1C), primarily the species Lactobacillus plantarum and Lactobacillus pentosus (Figure 1D). L. plantarum is a well-characterized facultative symbiotic microbe in Drosophila and is required for nutritional symbiosis (Martino et al., 2018; Storelli et al., 2011, 2018). This commensal bacterium does not colonize the fly midgut but instead remains associated with its host through constant cycles of ingestion and secretion (Pais et al., 2018).
Figure 1. Relish Function in the Midgut Epithelium Shapes Microbiota Abundance and Composition in Response to Dietary Adaptation.

(A-F) Diet- and Relish-dependent changes in midgut bacterial abundance and composition. Genotypes NP1G4 > w1118 (+, control) or NP1G4 > UAS-Rel RNAi (line v108469-KK and line v49413-GD). Circles represent unique midguts.
(A) Bacterial abundance from dissected midguts (colony forming units [CFUs; log scale], quantified using non-selective media) from indicated diets. Circles represent unique midguts.
(B) Calorie content of diets (joule/fly/h) with indicated calorie sources.
(C) Bacterial composition (genera) from dissected midguts (determined by 16S rRNA gene sequencing) from indicated diets.
(D) Bacterial composition shifts (species) from dissected midguts (determined by 16S rRNA gene sequencing) in response to high-sugar low-yeast (HS-LY) dietary imbalances.
(E) Lactobacillus abundance from dissected midguts (measured by 16S rRNA gene qPCR, plotted as fold change [ratio of HS-LY diet fed to Std. diet fed]) from indicated diets. Multiple, independent control genotype experiments (Exp. 1 and Exp. 2) provided. n = 3 independent samples.
(F) Lactobacillus abundance from dissected midguts (CFUs [log scale], quantified using selective media and growth conditions) from indicated diets. Circles represent unique midguts.
(G) Lactobacillus abundance from dissected midguts (CFUs [Log scale], quantified using selective media and growth conditions) from indicated diets in control flies (OreR), relE20 / + heterozygote flies, and relE20 / relE20 mutant flies. Circles represent unique midguts.
(H) Model depicting the integration of dietary imbalances, microbiota, and host signaling mechanisms.
Bars represents median ± SE unless otherwise indicated. All flies were mated females. **p < 0.01, *p < 0.05. For CFU quantification, p values represent differences between diets within the same genotype.
Concurrently with the above diet-microbiota interaction analysis, we explored whether NF-κB/Relish can influence these adaptive processes. Relish is similar to mammalian p100/p105 NF-κB proteins (containing a Rel-homology domain and ankyrin repeats found in mammalian inhibitory IκBs) and is regulated by the canonical Drosophila IMD (immune deficiency) innate immune signaling pathway (Buchon et al., 2014). We hypothesized that Relish may direct diet-microbiota interactions as (1) Relish can regulate nutrient-responsive cellular functions, (2) resident midgut bacteria induce mild IMD/Relish activation (Kamareddine et al., 2018; Ryu et al., 2008), and (3) despite this activation, Relish is likely dispensable in midgut epithelial cells for survival in response to certain types of enteropathogenic infectious agents, regardless of host nutrition (Figure S1B; Ha et al., 2005). To test this hypothesis, we inhibited Relish specifically in midgut enterocytes (functionally differentiated cells that have bacterial- and nutrient-sensing capabilities). Attenuating Relish in enterocytes (using the NP1(Myo1A)Gal4 driver and multiple, independent RNAi lines: named UAS-RelRNAi KK and GD) (Molaei et al., 2019) did not change midgut bacterial abundance (CFU) in flies fed a Std. or HY-LS diet but instead reduced microbe quantity when flies were fed a HS-LY diet (Figure 1A; compared to NP1Gal4 > w1118 control flies). Similarly, Relish did not influence commensal bacterial composition in response to Std. or HY-LS diets but is required for the amplification of host-Lactobacillus associations in response to a HS-LY diet (Figures 1C, S1C, and S1E). We further confirmed (quantitatively) that Relish function influences diet-dependent host-Lactobacillus associations by using culture-independent and culture-dependent methods (Figures 1E–1G). Relish inhibition in enterocytes reduced Lactobacillus 16S rRNA gene levels (Figure 1E) and Lactobacillus CFU (using selective media and anaerobic culture conditions; Figures 1F and S1D) only in response to a HS-LY diet (compared to control flies; additional experimental controls can be found in Figures S1G and S1H). Conversely, Relish inhibition maintains Acetobacter 16S rRNA gene levels (Figure S1F), dissimilar from controls (Figures S1F and 1C). Host-Lactobacillus associations are negligible 1 day after the dietary switch, independent of diet type or genotype, suggesting this is a bacterial adaptation to host diet composition (Figures S1A and S1I).
Diet-dependent host-Lactobacillus associations are also strongly reduced in Relish mutant flies (relE20 / relE20, compared to genetically matched OreR or relE20 / + heterozygote controls; Figure 1G), and attenuation of upstream components of the IMD/Relish signaling pathway phenocopied these Relish loss-of-function effects on midgut bacterial composition (specifically inhibitor of κB kinase gamma [IKKgamma] [Drosophila Kenny (key)] and the apical caspase death related ced-3/Nedd2-like caspase [DREDD]; NP1Gal4 > UAS-DreddRNAi or KeyRNAi; Figure S1K); although, unlike Relish inhibition, attenuation of DREDD appeared to also have an effect on microbiota compositions when flies were fed a Std. diet.
Finally, to standardize microbe communities between genotypes (Figure S1K), we performed initial co-housing experiments with control and NP1Gal4 > UAS-RelRNAi KK animals, which again revealed that Relish function in the midgut is required to promote or maintain diet-dependent changes in Lactobacillus abundance (Figure S1K). We also verified that there was no significant change in lifespan when Relish was attenuated in midgut enterocytes (in response to both Std. and HS-LY diets) that might influence commensal or pathobiont bacterial composition changes (Figure S2A)
Taken together, these data show that Drosophila host-associations with the facultative symbiont Lactobacillus are amplified when host diet macronutrient composition is imbalanced. Relish-dependent host signaling within the midgut epithelium is further required to promote this bacterial adaptation but only in response to sugar-rich, protein-poor dietary imbalances (Figure 1H), highlighting the putative integration of diet-and-Relish-dependent signaling mechanisms.
Diet-Dependent Changes in 4E-BP/Thor Levels Are Adjusted by Relish to Shape Microbiota Composition
Midgut enterocytes in Drosophila act as both microorganism- and nutrient-sensing cells, prompting the integration of innate immune and metabolic signaling responses to control diverse outputs that might include dietary adaptation. Relish is emerging as an important transcriptional regulator of nutrient-responsive genes in various types of cells. Thus, we next wanted to uncover potential mechanisms by which the Relish transcription factor could direct dietary responses in the midgut epithelium and, subsequently, influence commensal bacterial composition. To this end, we used a candidate analysis to assay transcriptional changes of metabolic genes known to respond to dietary imbalances linked to either elevated carbohydrates (sugars) or diminished protein. Among the candidates analyzed, we identified only 4E-BP (Drosophila Thor) as being regulated by Relish in response to a HS-LY diet. Thor transcription is unchanged in response to a HS-LY diet in control animals (NP1Gal4 > w1118) but is strongly upregulated in midguts when Relish is attenuated (NP1Gal4 > UAS-RelRNAi KK, Figures 2A and S2B; and RelRNAi GD, Figure S2C). Relish does not influence Thor transcription when dietary protein is in excess (HY-LS diet, Figure 2B), highlighting diet specificity. In addition, midgut peptidase gene expression has been reported to be microbe and Relish dependent (Erkosar et al., 2014), but this regulation is not further influenced by HS-LY diets (Figure S2D). Finally, midgut Relish expression itself is not induced by diet, and Relish does not influence the diet inducibility of classical innate immune or stress response target genes (Figure S2E; Becker et al., 2010). These data, thus, link Relish- and diet-dependent control of Thor/4EBP to microbiota adaptation.
Figure 2. Diet-Dependent Changes in 4E-BP/Thor Levels Are Adjusted by Relish.

(A-F) Diet- and Relish-dependent changes in 4E-BP/thor transcription and 4E-BP protein levels in dissected midguts. Genotypes NP1G4 > w1118 (+, control) or NP1G4 > UAS-Rel RNAi (line v108469-KK).
(A and B) Drosophila 4E-BP (thor), alpha-trypsin, beta-trypsin, Jon66Cii, Jon65Ai, sugarbabe, and mondo transcription (measured by qRT-PCR in dissected midguts, plotted as fold change [ratio of HS-LY diet fed to Std. diet fed]), Drosophila 4EBP (thor) transcription (measured by qRT-PCR in dissected midguts) from either HY-LY diet fed (A) or HY-LS diet fed (B). n = 3–4 independent samples.
(C) Immunostaining to detect non-phosphorylated (p)-4E-BP in dissected midguts (images from posterior region) from indicated diets; non-p-4E-BP (green) and nuclei (4′,6-diamidino-2-phenylindole [DAPI]; blue). Empty white arrows designate small cells within epithelium; filled white arrows designate large, polyploid epithelial cells. Scale bars in red.
(D) Histograms derived from non-p-4E-BP gut immunostaining images, from HS-LY diet fed flies. The gray area represents pixel intensity (scored 1–3, low-high) of non-p-4E-BP corresponding to nuclear size (red [AUs, arbitrary units], x axis) within a cell. n = 3 images per genotype per condition.
(E) Diet- and Relish-dependent changes in non-p-4E-BP (green) immunostaining intensity in polyploid enterocytes (nuclei [DAPI, blue]). Zoomed images, scale bars in red.
(F and G) Immunostaining to detect non-p-4E-BP (red) in GFP-marked (green) MARCM clones (images from posterior midgut; nuclei [DAPI, blue]) from indicated diets and genotypes (control [Ctrl.; FRT82, w1118] or Relish mutant [FRT82B, relE20]). To generate clones, mated female flies (2–3 days post-eclosion) were heat-shocked for 30 min at 37°C, and then placed on respective diets for 7 days. Empty white arrows designate small cells within clones; filled white arrows designate large, polyploid epithelial cells. Scale bars in red.
(H) Immunostaining to detect p-4E-BP and eIF2-alpha in dissected midguts (images from posterior region) from indicated diets; p-4E-BP (green, left panels), eIF2alpha (green, right panels), and nuclei (DAPI, blue). Empty white arrows designate small cells within epithelium. Scale bars in red.
Bars represent mean ± SE. All flies were mated females. **p < 0.01, *p < 0.05.
4E-BP is a crucial regulator of cap-dependent translation (thus controlling synthesis rates of specific proteins) through binding and inhibiting eukaryotic initiation factor 4E (eIF4E), the rate-limiting cap-dependent translation initiation factor (Figure S3A; Miron et al., 2001; Richter and Sonenberg, 2005). Phosphorylation of 4E-BP strongly influences eIF4E function by attenuating its binding ability. Higher levels of non-phosphorylated (non-phospho)-4E-BP are, thus, associated with inhibition of cap-dependent translation (Miron et al., 2001). To further explore this Relish- and diet-dependent regulation of 4E-BP in the midgut epithelium, we assayed 4E-BP localization by using immunohistochemistry. In control flies, non-phospho-4E-BP protein is mainly present in smaller cells within the epithelium, likely progenitor enteroblasts (Kapuria et al., 2012), and limited in polyploid enterocytes (focusing on the posterior midgut, Figure 2C). Feeding flies a HS-LY diet further attenuates non-phospho-4E-BP protein immunostaining across the epithelial layer (Figure 2C). However, inhibiting Relish in midgut enterocytes maintains, or enhances, the amount of these polyploid cells that stain positive for non-phospho-4E-BP, especially in response to a HS-LY diet (Figure 2C).
To further illustrate the cell-type specificity of non-phospho-4E-BP staining, we analyzed the relationship between nuclear size (smaller nuclear size being indicative of progenitor cells and larger nuclei being indicative of polyploid enterocytes) and staining intensity within the midgut. Upon exposure to a Std. diet, both control and NP1Gal4 > UAS-RelRNAi KK flies showed no significant clustering of positive cells among specific nuclear sizes (Figure S3B). However, in response to a HS-LY diet, the limited staining for non-phospho-4E-BP in control flies is primarily observed in small-to-midsize nuclei, with high-intensity staining only seen in smaller nuclei (Figure 2D). Contrastingly, when Relish is attenuated in midgut enterocytes during exposure to a HS-LY diet, the frequency of staining is dramatically increased, with the highest intensity stain clustered among larger nuclei (Figures 2D and 2E), suggesting that Relish function is required to limit 4E-BP levels in enterocytes. We confirmed this diet-dependent regulation of 4E-BP by analyzing positively marked Relish mutant (relE20 / relE20) midgut clones (using the MARCM system). Immunostaining reveals that the presence of non-phospho-4E-BP protein, within polyploid enterocytes, is only prominent when Relish is attenuated during HS-LY diet feeding (Figures 2F and 2G).
Many nutrient-sensing signaling pathways, such as Insulin/IGF (insulin-like growth factor) and mTOR (mechanistic target of rapamycin), impinge on Drosophila 4E-BP function to coordinate changes in protein synthesis with nutrient availability (Teleman et al., 2005). TOR signaling can be attenuated in response to protein deficiency to control the phosphorylation status of 4E-BP, as well as eIF2alpha function, to reduce specific and global protein translation (Figure S3A; Teleman et al., 2005). Unlike eIF4E, which specifically regulates cap-dependent translation, eIF2alpha is a global regulator of stress-dependent translation (acting as an initiation factor). However, we did not find Relish-dependent changes in phospho-4E-BP or phospho-eIF2alpha (Figure 2H), highlighting a putative specificity in Relish-dependent 4E-BP regulation (i.e., independent of other translation control mechanisms; Figure 2D). Furthermore, Relish did not influence TOR-dependent transcriptional targets (Figures S3A and S3C; Tiebe et al., 2015) in polyploid cells, suggesting the Relish-dependent control of 4E-BP in enterocytes is independent of TOR signaling and specific to regulators of cap-dependent translation. Phospho-4E-BP is only present in midgut progenitor cells during HS-LY diet feeding (but independent of Relish activity in enterocytes; Figure 2H), highlighting the cell-specific regulation of 4E-BP (Kapuria et al., 2012).
These results suggest that the Relish function in midgut enterocytes is required to restrain Thor levels during dietary adaptation. Diet-dependent increases in the levels of non-phospho-4E-BP often act as a metabolic brake, limiting specific aspects of protein synthesis, which can modulate cell and tissue growth (Teleman et al., 2005). However, diet- and Relish-dependent regulation of 4E-BP do not appear to attenuate cell or tissue growth (Figures S3D–S3F), suggesting that these changes in 4E-BP may more directly influence microbiota composition.
Supporting this hypothesis, we found that genetically attenuating Thor in midgut enterocytes (UAS-ThorRNAi) could at least partially rescue the decreases in host-Lactobacillus associations induced by Relish inhibition (NP1Gal4 > UAS-RelRNAi KK) during dietary adaptation (Figures 3A and S3G). Furthermore, directly overexpressing wild-type Thor in midgut enterocytes (NP1Gal4 > UAS-ThorWT) blocked the HS-LY diet-dependent amplification of host-Lactobacillus associations (Figures 3A–3C and S3H), similar to Relish loss-of-function conditions.
Figure 3. 4E-BP/Thor Shapes Microbiota Composition in Response to Dietary Adaptation.

(A) Lactobacillus abundance from dissected midguts (measured by 16S rRNA gene qPCR, plotted as fold change [ratio of HS-LY diet fed to Std. diet fed]) from indicated diets when Relish is attenuated (NP1G4 > UAS-Rel RNAi [line v108469-KK], Relish and Thor are attenuated (NP1G4 > UAS-Rel RNAi, UAS-Thor RNAi), or Thor is overexpressed (NP1G4 > UAS-Thor WT); compared to NP1G4 > w1118 (+, controls). n = 3–5 independent samples. Bars represent mean ± SE.
(B-D) Diet- and Thor-dependent changes in midgut bacterial composition (NP1G4 > UAS-Thor WT).
(B) Lactobacillus abundance from dissected midguts (CFUs [log scale], quantified using selective media and growth conditions) from indicated diets. Circles represent unique midguts. Bars represent median ± SE.
(C) Bacterial composition (genera and species) from dissected midguts (determined by 16S rRNA gene sequencing) from indicated diets.
(D) Model depicting the integration of dietary imbalances, microbiota, and host signaling mechanisms.
All flies were mated females. **p < 0.01, *p < 0.05. For CFU quantification, p values represent differences between diets within the same genotype.
In summary, these data highlight that Relish function in midgut enterocytes can limit diet-dependent expression of 4E-BP/Thor and, thus, reduce 4E-BP levels, which is required to coordinate commensal bacterial composition with host diet composition. Relish may, thus, act as a critical host signaling node within the midgut epithelium, tightly controlling Thor transcription when the ratio of protein is significantly less than that of sugar in the diet.
Relish Controls Both Diet-Dependent 4E-BP/Thor Transcription and Nascent Protein Synthesis
The transcriptional activation function of Relish is required for the expression of a large network of innate-immune-inducible genes. However, we have previously shown that Relish can also limit the inducibility of specific genes through promoter and enhancer (P/E) binding in Drosophila (Ji et al., 2016; Molaei et al., 2019). Using the open-access JASPAR CORE insecta database (Khan et al., 2018), we identified multiple, conserved NF-κB DNA binding motifs (κB sequence sites identified as GGG R N YYYYY) in the upstream P/E of the Thor locus (Figure 4A). To assess binding, we used a previously characterized Relish antibody to perform chromatin immunoprecipitation (ChIP)-qPCR experiments (Molaei et al., 2019). Relish binding (independent of diet) was significantly enriched at binding motif(s) approximately 700 base pairs upstream of the transcription start site (Figure 4A). These in vivo results were corroborated by ChIP-qPCR in vitro (Figure 4B; Thor is expressed in S2 cells and mildly induced in response to nutrient deprivation, Figure S4A).
Figure 4. Relish Controls Diet-Dependent Thor Transcription.

(A) Schematic shows Thor locus (focusing on upstream promoter region proximal to transcription start site) and putative NF-κB/Relish DNA binding motifs. R1 and 3′ UTR represent regional target sites (and corresponding primer set) test in ChIP-qPCR analysis. The histogram represents ChIP-qPCR analysis of Relish binding to the Thor locus (compared to Actin5C promoter [Act5CP] and the 3′ UTR of Thor [3′ UTR]) in whole flies fed a Std. or HS-LY diet. Plotted as fold enrichment (compared to negative control [NC] primer set) of indicated PCR primer sets. n = 3–4 biological replicates.
(B) ChIP-PCR analysis Relish enrichment in R1-/Relish-binding region of the Thor locus in Drosophila S2 cells (after mock treatment or 24-h serum starvation). n = 3–4 biological replicates.
(C) Requirement of Thor locus Relish binding site in limiting induced gene expression measured by RFP fluorescence in dissected midguts (posterior) of transgenic flies carrying indicated reporters (fed a Std. or HS-LY diet); RFP (red), membrane (armadillo [arm], green), and nuclei (DAPI, blue). Scale bars in red.
(D) Requirement of Relish in limiting induced gene expression (driven by the wild-type Thor promoter and enhancer region) as measured by RFP fluorescence in dissected midguts (posterior) of transgenic flies carrying ThorP/E_WT_RFP and one copy of the relE20 mutant allele compared to transgenic flies carrying ThorP/E_Δ2_RFP and one copy of relE20 mutant allele (fed a Std. or HS-LY diet); RFP (red) and nuclei (DAPI, blue). Scale bars in red.
(E and F) Schematic shows domain structures of TORCAR. Inducibility and localization of human 4E-BP1 (dictated by Relish binding sites in the Thor locus) measured by YPET fluorescence in dissected midguts (posterior) of transgenic flies carrying indicated expression constructs (fed a Std. or HS-LY diet); YPET-tagged TORCAR (green) (E), and zoomed images where filled white arrows designate nuclear localization of 4E-BP (F). Scale bars in red.
Bars represent mean ± SE. All flies were mated females. *p < 0.05.
Next, we cloned this putative Thor regulatory region upstream of RFP (red fluorescent protein) to generate in vivo expression reporters (transgenic flies bearing either [1] a wild-type reporter [ThorP/E_WT_RFP], [2] a reporter with a deletion in one Relish DNA binding site, or [3] a reporter with deletions in both Relish DNA binding sites [ThorP/E_Δ2_RFP]). The unaltered region (ThorP/E_WT_RFP) only rarely influenced RFP reporter activity within the midgut epithelium in response to a HS-LY diet (Figure 4C), consistent with gene expression analysis (Figure 2A). Although eliminating one Relish binding site had mild diet-specific effects (Figure S4B), eliminating both sites led to strong increases in RFP activity during dietary adaptation (Figures 4C and S4C). Furthermore, reducing Relish gene dose (using the relE20 mutant allele) strongly enhanced ThorP/E_WT_RFP reporter activity only in response to a HS-LY diet with no effect when combined with ThorP/E_Δ2_RFP (Figure 4D), underlining the importance of NF-κB/Relish-dependent control of Thor transcription. These data also underline the heterogeneity in Relish-dependent Thor regulation within the population of midgut enterocytes (Figure S4C; similar to the heterogeneity of non-phospho-4E-BP immunostaining), which is likely due either to the differentiation status of these polyploid cells or stochasticity in Relish activation and function (Zhai et al., 2018).
Relish binding at this locus is not diet inducible, although Thor gene expression is, suggesting that Relish is limiting the transcriptional activation of other nutrient-responsive transcription factors that can upregulate Thor transcription. We previously found that Relish can specifically repress ATGL/Brummer lipase transcription in adipose through the attenuation of Foxo transcriptional activation function, a critical nutrient-responsive transcription factor that governs Bmm expression (Molaei et al., 2019). Relish putatively limits Foxo function by influencing nutrient-dependent histone deacetylation (and chromatin modifications) within the Bmm locus, highlighting a functional antagonism between Relish and Foxo (Molaei et al., 2019). Foxo can also govern Thor expression in response to dietary adaptation or reduced insulin signaling (Jünger et al., 2003; Figure S4D), and we further uncovered that Foxo is, at least in part, required for diet- and Relish-dependent Thor transcription and amplification of host-Lactobacillus associations (Figures S4D–S4F). Additionally, a canonical Foxo DNA binding site is present in the in vivo expression reporters (Figure S4G), and reducing Foxo gene dose (using the foxoΔ24 mutant allele) eliminates ThorP/E_Δ2_RFP reporter activity in response to a HS-LY diet (Figure S4G). Thus, antagonism of Relish and Foxo functions appear to play a critical role in governing Thor gene expression and microbiota adaptation.
We next wanted to explore the effect of Relish-dependent Thor transcriptional regulation on 4E-BP/Thor function (i.e., the upregulation, stabilization, and localization of 4E-BP protein levels that could govern cellular translation). To this end, we again generated in vivo expression constructs and replaced RFP with a full-length (and dual-fluorescent tagged) human 4E-BP1 (TORCAR; Jünger et al., 2003; Figure 4E). Although the non-phospho-4E-BP antibody used in Figure 2 only recognizes a single regulatory site in 4E-BP, TORCAR can be used to monitor total protein levels and localization under Relish control, during dietary adaptation. Eliminating both Relish DNA binding sites (ThorP/E_Δ2_TORCAR) led to diet-dependent increases in 4E-BP1 levels in midgut enterocytes, with 4E-BP1 localized to both the cytoplasm and the nucleus (Figure 4F). Nuclear localization of 4E-BP has been shown to be functionally relevant, suggesting increases in 4E-BP protein levels within the midgut epithelium may also require localization changes to impact function (Richter and Sonenberg, 2005; Zhou et al., 2015). Taken together, these results show that Relish can limit the transcriptional inducibility of Thor in response to dietary adaptation, thus restraining the accumulation of 4E-BP/Thor in midgut enterocytes and promoting diet-mediated changes in commensal bacteria.
To determine if diet- and Relish-dependent regulation of 4E-BP accumulation correlated with subsequent changes in protein synthesis, we developed an ex vivo assay to monitor nascent mRNA translation in dissected midguts (Figure 5A). Using an O-propargyl (OP)-puromycin analog to label newly synthesized proteins coupled with copper (I)-catalyzed azide-alkyne cycloaddition (CuAAC/N3)-AlexaFluor647 staining (Figure S5A; Deliu et al., 2017; Liu et al., 2012), we uncovered that control animals (NP1Gal4 > w1118) were able to maintain protein synthesis during dietary adaptation (Figures 5B and 5D). However, attenuation of Relish in enterocytes (NP1Gal4 > UAS-RelRNAi KK) revealed a strong decrease in mRNA translation within the midgut epithelium in response to a HS-LY diet (Figures 5B, 5D, and S5B). Similar results were found when analyzing positively marked Relish mutant (relE20 / relE20) midgut clones (using the MARCM system; Figures 5C and 5E).
Figure 5. Relish Modulates Diet-Dependent Changes in Protein Translation to Shape Microbiota Composition.

(A-E) Monitoring nascent protein synthesis in dissected (ex vivo) midgut preparations using OP-puromycin (OP-Puro) coupled with copper (I)-catalyzed azide-alkyne cycloaddition (CuAAC)-Alexa647 staining.
(A) Experimental description.
(B) Fluorescent images (Alexa647) depicting nascent protein synthesis (OP-Puro, red; and nuclei [DAPI, blue]) in ex vivo midgut (posterior) preparations from indicated diets. Genotypes NP1G4 > w1118 (+, control) or NP1G4 > UAS-Rel RNAi (line v108469-KK). Scale bars in red.
(C) Fluorescent images (Alexa647) depicting nascent protein synthesis (OP-Puro, red; nuclei [DAPI, blue]) in GFP-marked (green) MARCM clones (images from posterior midgut) from indicated diet and genotypes (control [Ctrl.; FRT82, w1118] or Relish mutant [FRT82B, relE20]). To generate clones, mated female flies (2–3 days post-eclosion) were heat-shocked for 30 min at 37°C, and then placed on respective diets for 7 days followed by ex vivo Op-Puro analysis. Scale bars in red.
(D and E) Quantification of OP-Puro (red) fluorescent signal in posterior midguts (D) or clones (E). Figure S5C displays representative images (color coded) highlighting variation in OP-Puro signal. n = 9–10 and n = 5–14.
(F) Total protein extract (Ponceau staining) from dissected midguts (indicated diets and genotypes).
(G) Model depicting eIF4E cap-dependent translation complex, and other general regulators (eIF2 and eEF2) of protein synthesis
(H and I) Lactobacillus abundance from dissected midguts (CFUs [log scale], quantified using selective media and growth conditions) from indicated diets when various translation regulators are attenuated; NP1G4 > UAS-eEF2 RNAi, UAS-eIF2 RNAi, UAS-eIF4E-4 RNAi, UAS-eIF4E-4 RNAi, UAS-eIF4B sh (short hairpin RNA), and NP1G4 > White RNAi (control). Circles represent unique midguts (H). (I) Fold change (ratio of HS-LY diet fed to Std. diet fed) of midgut Lactobacillus abundance from indicated genotypes.
Bars represent median ± SE. All flies were mated females. *p < 0.05. For CFU quantification, p values represent differences between diets within the same genotype.
Relish within midgut enterocytes modulates both 4E-BP levels and nascent protein synthesis during dietary adaptation. Limiting the diet inducibility of 4E-BP levels could, thus, promote the maintenance of mRNA translation despite sugar-rich, protein-poor dietary imbalances (i.e., nutrient imbalances that would normally be associated with attenuation of protein synthesis). To this end, the maintenance of 4E-BP-mediated cap-dependent translation within the midgut epithelium may act as an integral host signaling mechanism that, in coordination with dietary nutrient availability, shapes microbiota composition.
Cap-Dependent Translation Shapes Microbiota Composition in Response to Dietary Adaptation
The precise control of cellular translation is critical for gene regulation during dietary adaptation. This includes distinct control of mRNAs that may be crucial to unique cellular and tissue functions, highlighting the complexity and mechanistic diversity in translational regulation (Kang et al., 2017; Teleman et al., 2005; Vasudevan et al., 2017; Zid et al., 2009). Furthermore, modulating host translation has emerged as a critical molecular mechanism that influences host-pathogen interactions (Lemaitre and Girardin, 2013; Vasudevan et al., 2017). We uncovered that Drosophila Relish- and diet-dependent control of 4E-BP/Thor and host-Lactobacillus associations also correlate with robust changes in nascent protein synthesis (Figures 5A–5E). However, Relish attenuation (NP1Gal4 > UAS-RelRNAi KK) does not appear to affect total protein levels in the midgut (Figure 5F). Furthermore, grossly inhibiting all translation in the midgut (through cycloheximide feeding of adult flies) does not inhibit diet-dependent host-Lactobacillus associations and further promotes increases in bacterial abundance, likely through general disruption of gut function and morphology (Figures S5D and S5E). Thus, rheostatic control of translation is likely crucial to shape microbiota composition in response to dietary adaptation. Cap-dependent translation is promoted by binding of eIFs to the m7G cap structure found on most mRNAs, forming a cap complex (Figure 5G; Richter and Sonenberg, 2005). In Drosophila, Thor has been shown to inhibit cap-dependent translation and, thus, direct translation of unique subsets of mRNAs (based on stress inputs and tissue function) to control various aspects of host physiology and behavior (Kang et al., 2017; Vasudevan et al., 2017; Zid et al., 2009). Using RNAi, we found that unique members of the cap-dependent translation complex within the midgut epithelium are required for changes in microbiota composition during dietary adaptation (Figures 5G–5I). Specifically, attenuating eIF4E-7 (4E-BP interacting protein that binds mRNA cap) or eIF4B (ribosomal recruitment) in enterocytes inhibits the amplification of host-Lactobacillus associations only in response to a HS-LY diet. The maintenance of cap-dependent translation in the midgut is, thus, crucial for commensal bacterial adaptation to dietary imbalances. Recent work has shown that after infection, enhanced 4E-BP function (attenuated cap-dependent translation) can bias AMP mRNA translation to promote infection responses (Vasudevan et al., 2017). Thus, the ability of the midgut to limit 4E-BP (maintain cap-dependent translation) during dietary adaptation will also likely limit AMP protein synthesis, which could promote/enhance composition changes that are primarily driven by diet-microbe interactions (described in greater detail below). In other tissues, dietary adaptation can limit translation, so the midgut may have unique mechanisms in place to maintain or limit certain metabolic responses to promote diet-microbe composition shifts.
DISCUSSION
In summary, these data show that the NF-κB/Relish host signaling function in midgut enterocytes is vital to adapt gut microbiota species abundance and composition to host diet macronutrient composition through the control of 4E-BP/Thor and cap-dependent translation.
Drosophila models in particular have highlighted the importance of 4E-BP-dependent regulation of translation during dietary adaptation. For example, 4E-BP is required for survival during nutrient deprivation and various nutrient-sensing pathways, and genes (such as insulin, mTOR, or the eIF2 alpha kinase GCN2) can influence 4E-BP function (Kang et al., 2017; Miron et al., 2001; Teleman et al., 2005; Vasudevan et al., 2017; Zid et al., 2009). However, elevated 4E-BP function during dietary adaptation does not simply imply a general inhibition of cellular translation. Inhibiting cap-dependent translation appears to bias nascent protein synthesis of cap-independent (or 4E-BP-insensitive) mRNAs, suggesting that diet-mediated 4E-BP activation promotes shifts in protein synthesis profiles based on unique cellular functions (Vasudevan et al., 2017; Zid et al., 2009). Our data show that Relish can limit the diet inducibility of 4E-BP/Thor, subsequently controlling symbiotic bacterial composition, through inhibiting the transcriptional activation function of the nutrient sensor Foxo (previously described for other metabolic response genes; Molaei et al., 2019). However, other innate immune and/or metabolic regulators have been shown to promote 4E-BP activation during infection to bias the translation of anti-microbial peptide mRNAs (regulated by cap-independent mechanisms) and modulate pathogen abundance (Vasudevan et al., 2017). Thus, host innate immune signaling, through integration with nutrient- or diet-responsive signaling mechanisms, can dictate 4E-BP function and cap-dependent translation. These context-dependent changes in 4E-BP function are likely to promote adaptive shifts in overall protein synthesis profiles to differentially modulate symbiotic versus pathogenic bacteria. Our findings further highlight the interconnectedness of translational regulation and immune-metabolic stress pathways in host control of bacterial abundance (Lemaitre and Girardin, 2013).
Relish transcriptional activation function in the Drosophila midgut is also induced by symbiotic (or resident) bacteria through canonical immune deficiency (IMD) innate immune signaling. Tissue intrinsic mechanisms concurrently suppress the ability of Relish to induce bacterial-killing innate immune factors, such as AMPs (Lhocine et al., 2008; Ryu et al., 2008). Furthermore, Relish activity is also required for modulating commensal-induced metabolic gene expression (Broderick et al., 2014; Erkosar et al., 2014). Our data show that Relish, through transcriptional repression mechanisms, can in turn shape commensal abundance and composition, suggesting reciprocity and symbiosis within Relish-microbiota interactions. However, Relish function in midgut enterocytes only influences microbiota when dietary nutrients are imbalanced, indicating that host diet is the major driving force in shaping these microbial communities. We discovered that sugar and protein dietary imbalances stimulate increases in host-Lactobacillus associations in adult flies, providing further evidence that Lactobacillus species are important facultative symbiotic commensals in insects, likely promoting nutritional symbiosis (Keebaugh et al., 2018, 2019; Martino et al., 2018; Storelli et al., 2018; Wong et al., 2014). Amplification of host-Lactobacillus associations when dietary protein is in excess (and sugar is limited) does not require Relish-dependent host signaling mechanisms, suggesting that the presence of amino acids in the diet may support Lactobacillus associations (Consuegra et al., 2019). Conversely, Relish is required to promote host-Lactobacillus associations when dietary macronutrient ratios are biased toward sugars. Although Lactobacillus species make up a major part of the lactic acid bacterial group (i.e., these bacteria excel at using sugars as energy substrates in low oxygen environments through hexose fermentation), some species (such as L. plantarum) struggle to grow in amino-acid-poor conditions (Consuegra et al., 2019). Relish function might, thus, adjust the midgut environment (through modulating host translation) to enrich Lactobacillus associations that are difficult to maintain in the absence of amino acids, highlighting a trialogue between dietary nutrients, resident microbiota, and host signaling.
The dialog between NF-κB-dependent host signaling and dietary adaptation further underscores the co-evolution of metabolic and innate immune signaling mechanisms. The coupling of these responses to regulate cellular metabolism and energy homeostasis can occur through various mechanisms, such as the interaction between innate immune cells and metabolic tissues (Odegaard and Chawla, 2013). More directly, innate immune signaling pathways can alter metabolic and/or dietary responses (Clark et al., 2013; DiAngelo et al., 2009), and specific cells and tissues have co-evolved immunological and metabolic function. The Drosophila midgut epithelium (and particularly the enterocytes) acts as both a nutrient and microorganism sensing system, promoting bi-directional and coordinated communication between signaling pathways to adapt and shift cellular functions (i.e., from energy anabolism to pathogen resistance or from nutrient uptake to commensal bacterial maintenance). This study shows that NF-κB function, independent from enteropathogenic infection and transcriptional activation, is critical to modulate host signaling metabolic responses to dietary imbalances (such as nutrient-mediated control of cellular translation). The functional diversity of NF-κB and NF-κB-like innate immune transcription factors, thus, helps shape the integration of metabolic and immune responses (DiAngelo et al., 2009; Molaei et al., 2019; Nandy et al., 2018).
STAR★METHODS
RESOURCE AVAILABILITY
Lead Contact
Further information and requests for resources and reagents should be directed to and will be fulfilled by the Lead Contact, Jason Karpac (karpac@tamu.edu).
Materials Availability
Fly stocks generated for this study are maintained in the Karpac lab and any inquiries for use should be directed to and will be fulfilled by the Lead Contact, Jason Karpac (karpac@tamu.edu).
Data and Code Availability
The authors declare that all data supporting the findings of this study are available within the article and its Supplementary information files or upon request.
EXPERIMENTAL MODEL AND SUBJECT DETAILS
Drosophila Husbandry and Strains
A detailed list of fly strains used for these studies is provided in Table S1. All flies were reared on standard yeast and cornmeal-based diet at 25°C and 65% humidity on a 12 hr light/dark cycle, unless otherwise indicated. A standard lab diet (cornmeal-based) for rearing was made with the following protocol: 14 g Agar/165.4g Malt Extract/ 41.4g Dry yeast/ 78.2g Cornmeal/ 4.7ml propionic acid/ 3g Methyl 4-Hydroxybenzoate/ 1.5L water.
NP1Gal4 and w1118 fly stocks were maintained as large populations in population rearing cages (‘BugDorms’, cleaned and replaced every 4 months) in order to promote consistency in midgut bacteria composition and abundance. Within the cages, flies were reared on high-calorie diets and overnight egg lays were utilized for virgin collection. Virgin female/male genetic crosses were set-up in bottles and reared as described above. 2–3 days after eclosion, mated adult female progeny were exposed to the following dietary conditions: standard, high sugar-low yeast, or high yeast-low sugar (all previously described in Skorupa et al., 2008). Diets were made with the following protocol: Standard Diet: 10 g agar, 100 g sucrose, 100 g yeast, 3 mL propionic acid, 4.1 g methylparaben, 1 L water; HS-LY Diet: 10 g agar, 400 g sucrose, 25 g yeast, 3 mL propionic acid, 4.1 g methylparaben, 1 L water; HY-LS diet: 10 g agar, 25 g sucrose, 400 g yeast, 3 mL propionic acid, 4.1 g methylparaben, 1 L water. For all diets agar, sucrose, yeast and water were combined and heated to 102°C, the mixture was then cooled to 60–65°C, at which point propionic acid and methylparaben (dissolved in 15mL 100% ethanol) were added. After mixing, the mixture was poured at 5mL/vial.
Calorie content of diets was calculated using (previously described in Skorupa, et. al., 2008) feeding assays on blue-dye labeled food which were done as follows: 30 flies were transferred from various diets to vials filled with identical dietary media containing 0.5% brilliant blue (dye). Feeding was interrupted after 1 hour and 5 flies from each diet were transferred to 50 μL 1×PBS containing 0.1% Triton X-100 (PBST) and homogenized immediately. Blue dye consumption was quantified by measuring absorbance of the supernatant at 630 nm (A630). Various amounts of dye-containing food were weighed, homogenized in PBST, and measured (A630) in order to create a standard curve to quantify blue dye food consumption.
For cohousing experiments, NP1Gal4 > WhiteRNAi and NP1Gal4 > RelishRNAi KK were allowed to eclose and mate individually for two days on a high-calorie diet (rearing diet). After, females from each genotype were sorted and combined in equal ratios (100 of each genotype) for cohousing on a high calorie diet for two days (with food changes each day) prior to sorting for independent housing on experimental diets. The remainder of the experiment was carried out as described in Figure S1A.
All experiments presented in the results were done utilizing female flies 8–10 days old post-eclosion (aged at 25 and following dietary protocol referenced above and described in Figure S1A).
The UAS-RelishRNAi (both transgenic lines), UAS-KennyRNAi, UAS-DreddRNAi, UAS-FoxoRNAi, UAS-ThorWT, and UAS-ThorRNAi were backcrossed 10× into the w1118 background that was used as a control strain, with continued backcrossing every 6–8 months to maintain isogenecity. The ebony (eS) allele was removed from the relE20 mutant stock, and animals were outcrossed into a wild-type OreR background.
The efficiency of transgenic RNAi lines UAS-ThorRNAi and UAS-ThorWT were confirmed in this study. The efficiency of transgenic RNAi lines UAS-RelishRNAi (VDRC: 108469 (KK) and VDRC: 49413 (GD)), UAS-KennyRNAi (VDRC: 7723 (GD)), UAS-DreddRNAi (VDRC: 104726 (KK)), UAS-FoxoRNAi (VDRC: 106097 (KK)), were confirmed in previous studies.
Generation of Transgenic Drosophila
The Thor promoter/enhancer regions utilized in all transgenic reporter flies were generated by custom nucleotide synthesis provided by gBlock:IDT, and subsequently cloned into the pB-RFP plasmid (Chatterjee and Bohmann, 2012). The sequences were as follows:
Wild-type Thor P/E
gcatgcGACGTGTCTTTATGCTAATTAATGGTATTTCGCGAAAACGAGTGCAAAATAATGGCCCCATGGAGAGAGCGGCAGTACTTCA CGAAATTCTGCGGAACACCTCTTGACTCCCAGACAGCCATAGATAAGATCCCAATTGCACCTGAGTCATCATCATTTCCCTAGCAA GATCGACAATAGACTTGGTTTTTAGAAAAGAATGCGATTGGCGTTTAGTGCTGTTGGCTAACTTGTTTACCAATAATATTGCCGTGCA TTAAACAATAACAAATGACCAAAGATAAACAAGAGCTCAAGGCGAGAAGCCCCTCAAGACAGCCCCCCACCATCGCTACACCCCT TATCATCTAGAACCTCCGAGGTGTGCAGGCTGCAACAAAAATAAGAACAATAGGGGAATATATTAGAATACGGCAATAACAACAAG AACCAGCCGGTTTGTCATAAACTACGCAGAAAATACACCAGATAAAAACAAAAAACATCAGCCGACCAAGCAGAATAATCAGGCGAG AGAGCAGGCGAAAGAGCGAGAAGAGAGCGAGAGAGAGTAAGAATGGGGGGGTATAAATAGAGCCACACTTCGTAATACCGCCAG CAATCGCCTAGCGAACAGCCAACGGTGAACACATAGCAGCCACACAAGCTCTATAGCTGATACAAGCAACGAAATACAAACAACG CAGTctcgag
Thor P/E with Single Mutant NF-kB Site
gcatgcTGCAAAATAATGGCCCCATGGAGAGAGCGGCAGTACTTCACGAAATTCTGCGGTCTTGACTCCCAGACAGCCATAGATAAG ATCCCAATTGCACCTGAGTCATCATCATTTCCCTAGCAAGATCGACAATAGACTTGGTTTTTAGAAAAGAATGCGATTGGCGTTTAGT GCTGTTGGCTAACTTGTTTACCAATAATATTGCCGTGCATTAAACAATAACAAATGACCAAAGATAAACAAGAGCTCAAGGCGAGAA GCCCCTCAAGACAGCCCCCCACCATCGCTACACCCCTTATCATCTAGAACCTCCGAGGTGTGCAGGCTGCAACAAAAATAAGAAC AATAGGGGAATATATTAGAATACGGCAATAACAACAAGAACCAGCCGGTTTGTCATAAACTACGCAGAAAATACACCAGATAAAAAC AAAAAACATCAGCCGACCAAGCAGAATAATCAGGCGAGAGAGCAGGCGAAAGAGCGAGAAGAGAGCGAGAGAGAGTAAGAATGG GGGGGTATAAATAGAGCCACACTTCGTAATACCGCCAGCAATCGCCTAGCGAACAGCCAACGGTGAACACATAGCAGCCACACA AGCTCTATAGCTGATACAAGCAACGAAATACAAACAACGCAGTctcgag
Thor P/E with Double Mutant NF-kB Sites
gcatgcGACGTGTCTTTATGCTAATTAATGGTATTTCAGTGCAAAATAATGGCCCCATGGAGAGAGCGGCAGTACTTCACGAAATTCT GCGGTCTTGACTCCCAGACAGCCATAGATAAGATCCCAATTGCACCTGAGTCATCATCATTTCCCTAGCAAGATCGACAATAGACT TGGTTTTTAGAAAAGAATGCGATTGGCGTTTAGTGCTGTTGGCTAACTTGTTTACCAATAATATTGCCGTGCATTAAACAATAACAAA TGACCAAAGATAAACAAGAGCTCAAGGCGAGAAGCCCCTCAAGACAGCCCCCCACCATCGCTACACCCCTTATCATCTAGAACCT CCGAGGTGTGCAGGCTGCAACAAAAATAAGAACAATAGGGGAATATATTAGAATACGGCAATAACAACAAGAACCAGCCGGTTTG TCATAAACTACGCAGAAAATACACCAGATAAAAACAAAAAACATCAGCCGACCAAGCAGAATAATCAGGCGAGAGAGCAGGCGAAA GAGCGAGAAGAGAGCGAGAGAGAGTAAGAATGGGGGGGTATAAATAGAGCCACACTTCGTAATACCGCCAGCAATCGCCTAGCG AACAGCCAACGGTGAACACATAGCAGCCACACAAGCTCTATAGCTGATACAAGCAACGAAATACAAACAACGCAGTctcgag
For TORCAR reporters, the RFP in the pB-RFP plasmid containing the appropriate Thor P/E Region was excised and the TORCAR construct (dual fluorophore-tagged Cerulean-full length human 4EBP1-YPet [Jünger, et. al., 2003]) was inserted. All five plasmids generated (pB-ThorP/E_WT_RFP, pB-ThorP/E_Δ1_RFP, pB-ThorP/E_Δ2_RFP, pB-ThorP/E_WT_TORCAR, and pB- ThorP/E_Δ2_TORCAR) were injected into w1118; attp40 embryos with phiC31 integrase helper plasmid (Rainbow Transgenic Flies).
Cell Culture Conditions
Drosophila S2 cells (obtained from Drosophila Genomics Resource Center; S2R+ cells) were maintained in Schneider’s Drosophila media supplemented with 10% FBS, 50 U/ml penicillin and 50 μg/ml streptomycin at 25°C. To induce serum starvation, normal media was replaced with media lacking FBS.
METHOD DETAILS
Lifespan Analysis
Fifteen virgins were crossed to 10–15 males of the desired genotype for all survival experiments unless otherwise indicated. After initial mating, parental flies were allowed 2 d to lay eggs before being removed from bottles. Progeny of crosses was collected for 3–4 d after initial eclosion and mating. Progeny were then separated according to sex and genotype into cages (100 flies/cage) and aged at 25°C with constant humidity (approximately 65%). Dead flies were counted every 2–3 days.
Culture-dependent Microbiota Analysis
The same dissection protocol was employed for all culture-dependent microbe analyses (general and Lactobacillus specific). For all microbiota related experiments (culture-dependent and -independent), care was taken that dissections were only performed at least two days after flipping of food vials.
Forceps and dissection plates were sterilized with 100% ethanol for at least 2 minutes before each dissection. Flies were surface sterilized in 100% ethanol prior to dissection in sterile 1×PBS for at least 1 minute. Each dissected midgut (crop to posterior midgut, hindgut and malphigian tubules were excluded) was homogenized in 100 μL autoclave-sterilized 1×PBS. The next day each sample was diluted prior to plating on 35 mm plates at 50 μL per plate.
For general microbiota culture, mannitol agar plates were utilized and incubated under aerobic conditions for 36 hr at 29°C. The recipe used for mannitol agar plates was: 25 g D-mannitol, 5 g yeast extract, 3 g peptone, 15 g agar, 1 L water. The mixture was autoclaved at 121°C for 20 minutes, allowed to cool, and poured.
For Lactobacillus specific culture, Man-Rogosa-Sharpe agar plates were utilized and incubated under anaerobic conditions for 36 hr at 29°C. The manufactures recipe was followed (70 g MRS agar in 1 L water). The mixture was autoclaved at 121°C for 20 minutes, allowed to cool, and poured. Independent colonies were selected for verification of genotype via colony-PCR using Dream-Taq master mix amplification of Lactobacillus 16S primers.
Preparation of Bacterial DNA
Forceps and dissection plates were sterilized with 100% ethanol for at least 2 minutes before each dissection. Female flies were surface sterilized in 100% ethanol prior to dissection in sterile 1×PBS for at least 1 minute. Ten dissected guts (crop to posterior midgut, hindgut and malphigian tubules were excluded) were homogenized in 300 μL autoclave-sterilized 1×PBS, and bacterial DNA was extracted using the QIAGEN microbial isolation kit. DNA was eluted in 20 μL pure H2O and quantified using a QUBIT analyzer. This sample was either used for 16S rRNA gene sequencing or qPCR.
16S rRNA Gene Sequencing
Primers targeting the V3/V4 regions were used for 16S metagenomic sequencing library preparation. Illumina MiSeq paired-end (2×300 bp) sequencing was performed. FAFSA sequences were aligned using Illumina base-space app. Particularly in HS-LY dietary conditions, large numbers of unclassified sequences were identified which we suspected were due to larger Drosophila genome contamination in the context of lower bacterial abundance. Illumina base-space BWA Aligner Application was employed for quantification of Drosophila genome contamination, which was then eliminated by distributing the percentage across all positively identified bacterial genera.
Lactobacillus Bacterial DNA qPCR
Bacterial DNA sequences were amplified using 0.5 uL of extracted bacterial DNA and Lactobacillus specific 16S rRNA gene qPCR primers and normalized to Universal 16S rRNA gene qPCR primers. This was performed using SYBR Green and the Applied Biosystems StepOnePlus Real-Time PCR system. Results are the average ± the standard error of at least three independent biological samples, and gene expression levels are quantified using the ΔCt method.
Enteropathic Infection Assay
Pseudomonas entompophila (P.e.) was used for natural (oral) infections. Briefly, for oral infection, flies (following treatment described in Figure S1A) were placed in a fly vial with food/bacteria solution and maintained at 25°C. The food solution was obtained by mixing a pellet of an overnight culture of bacteria (OD 200, dilute 1:1 with sterile water) with a solution of 10% sucrose (1:1) and added to a filter disk that completely covered the surface of the unique diets. 24 hours after bacterial feeding, flies were placed on corresponding diets without bacteria, and survival was monitored every 12 hours. At least three vials (cohorts of 20 flies per vial) were used for each diet and genotype. P.e. identity was confirmed via colony-PCR using Dream-Taq master mix amplification of P.e. specific primers.
Gene Expression Analysis
Total RNA from 10 dissected guts (crop to posterior midgut, excluding hind-gut and malphigian tubules) were extracted using Trizol and complementary DNA sequences were synthesized using Superscript III (Invitrogen). Quantitative Real-Time PCR was performed using SYBR Green, the Applied Biosystems StepOnePlus Real-Time PCR system, and the primer sets described in Table S1. Results are the average ± the standard error of at least three independent biological samples, and gene expression levels are quantified using the ΔCt method. In cases where results are presented as fold change, these are the fold change of the HS-LY relative expression values as a ratio of the average of the Std relative expression. All in vivo analysis were normalized to the Actin5c gene and all in vitro analysis were normalized to the Rpl32 gene.
Immunostaining and Microscopy
Fly midguts were dissected in 1×PBS and fixed for 30 minutes at room temperature in gut fixation solution (100 mM Glutamic Acid, 25 mM KCl, 20 mM MgSO4, 4 mM Na2HPO4, 1 mM MgCl2; pH adjusted to 7.5 with 10 N NaOH, 4% Formaldehyde). Subsequently, all incubations were in PBS, 0.5% BSA, and 0.1% Triton-X at 4°C. All primary antibodies were applied overnight. The following primary antibodies were used: rabbit anti non-phospho-4EBP-1 (Thr 46) (87D12) (Cell Signaling 4923, 1:100), rabbit anti phospho-4E-BP1 (Thr37/46) (236B6) (Cell Signaling 2855, 1:100), rabbit anti phospho-eIF2α (Cell Signaling 119A11, 1:100), and mouse anti-armadillo N2 7A1 (Dev. Studies Hybridoma Bank, 1:200). Fluorescent secondary antibodies were obtained from Jackson Immunoresearch. Hoechst (DAPI; 1:1,000) was used to stain DNA.
For histograms correlating non-P-4EBP pixel intensity with nuclear size, ImageJ was used to determine nuclear size and an overlay labeling each nucleus was generated. The pixel intensity of non-P-4EBP staining was graded on a scale of 1 (low) to 3 (high), and associated with its labeled nucleus manually (by adjusting the transparency of the nuclear overlay in Adobe Illustrator). The values were then sorted based on nuclear size and plotted using two independent y-axes.
Confocal images were collected using a Nikon Eclipse Ti confocal system (utilizing a single focal plane) and processed using the Nikon software and Adobe Photoshop.
Midgut Length Measurements
Drosophila midgut lengths were obtained by taking bright-field images using a Leica M165 FluoCombi stereoscope system and processed using Leica software. Measurements were made from proventriculus to posterior midgut/hindgut junction.
Chromatin Immunoprecipitation (ChIP)
Approximately 200 adult female flies were ground in liquid nitrogen then homogenized and cross-linked for 10 minutes at room temperature in 600 μL of 1× PBS containing 1% formaldehyde, 1 mM PMSF and 1× Protease Inhibitor cocktail (Thermo Scientific). The homogenate was then centrifuged for 20 min at 12000 × rpm at 4°C. The pellet was washed twice by resuspending in 600 μL of 1×PBS containing 1 mM PMSF and 1× Protease Inhibitor cocktail and centrifuged at 12000 × rpm for 20 min at 4°C. To lyse tissue and cells, the pellet was resuspended in 600 μL of RIPA buffer (10 mM Tris-HCl, pH 7.6, 1 mM EDTA, 0.1% SDS, 0.1% Na-Deoxycholate, 1% Triton X-100, containing 1 mM PMSF and 1× Protease Inhibitor Cocktail) and incubated at room temperature for 30 min.
The chromatin was sheared to 250–500 bp DNA fragments using a Diagenode sonicator (20 min sonication, highest power, 30 s sonication, 30 s rest). After sonication, the sheared chromatin was centrifuged for 20 min at 12000× rpm, 4°C. The supernatant was collected, aliquoted, snap-frozen, and stored at −80°C.
For immunoprecipitation, 10 μg of Rabbit anti-Relish antibody (Ray Biotech, RB-14–0004) was incubated with 100 μL of chromatin diluted 1:10 with dilution buffer (20 mM Tris-HCl, pH 8, 2 mM EDTA, pH 8, 150 mM NaCl, 1% Triton X-100) overnight at 4°C with rotation. 40 μL protein A magnetic beads were added the following morning and incubated at 4°C for 4 hr with rotation. Beads were then washed with the following buffers at 4°C, for 10 min each: 2× with 1 mL of RIPA Buffer + 1mM PMSF + 1× Protease Inhibitor, 2× with 1 mL RIPA buffer + 0.3 M NaCl, 2× with 1 mL of LiCl buffer (0.25 M LiCl, 0.5% Triton X-100, 0.5% NADOC), 1× with 1 mL of 1× TE + 0.2% Triton X-100, 1× with 1 mL of 1× TE.
To reverse crosslinking, beads were re-suspended in 100 μL of 1× TE + 3 μL 10% SDS + 5 μL of 20 mg/mL Proteinase K (VWR) and incubated at 65°C overnight. Beads were applied to the magnet and DNA was purified from the supernatant using a QIAGEN PCR Purification kit. To prepare input, 100 μL of chromatin extract was incubated overnight at 65°C with 3 μL 10% SDS + 5 μL of 20 mg/mL Proteinase K, DNA was then precipitated from 10 μL of the initial sample using a QIAGEN PCR Purification kit. For all Immunoprecipitated (IP) and Input samples, DNA was eluted in 20 μL of water, and 2 μL was used as a template for qRT-PCR (see Table S2 for Primer sets).
To assess enrichment, %Input was calculated between ChIP DNA and input DNA for each primer set, and then fold change in Input was calculated by dividing the %Input of each primer set to the %Input of a negative control primer set designed for Drosophila (Drosophila Negative Control primer set 1, Active Motif).
For in vitro ChIP using Drosophila S2 Cells, 2 × 10⁶ cells were used per chromatin extraction. Cells were collected using ice-cold 1×PBS, spun down at 1000×rcf. for 2 minutes at 4°C, and resuspended in cross-linking solution. The rest of the protocol was the same as in vivo experiments.
Ex-vivo OP-Puro Assay
This assay adapts the Click-iT™ Plus OPP Alexa Fluor™ 647 Protein Synthesis Assay Kit (ThermoFisher Scienitific). All incubations were performed at room temperature.
Female midguts were dissected in filter-sterilized Shields and Sang M3 Insect Medium (Sigma). Dissected midguts were then transferred to a 24-well dish containing 250 μL of medium + OP-Puro Reagent 50 μM and incubated for 30 minutes, with shaking. Guts were washed 3 times in 1×PBS for 10 minutes each, and then fixed for 30 minutes in gut fixation solution (100 mM Glutamic Acid, 25 mM KCl, 20 mM MgSO4, 4 mM Na2HPO4, 1 mM MgCl2; pH adjusted to 7.5 with 10 N NaOH, 4% Formaldehyde). After fixation, guts were washed once with 1×PBS for 10 minutes, followed by two washes in PBS, 0.5% BSA, and 0.1% Triton-X for 10 minutes each. The Click-iT reaction Buffer Cocktail was then prepared per the manufacturer’s instructions, and guts were incubated in the cocktail for 30 minutes. From this incubation forward, the samples were shielded from the light. Following incubation with the cocktail, the guts were washed once with the Click-iT Reaction Rinse Buffer for 10 minutes, followed by two washes in PBS, 0.5% BSA, and 0.1% Triton-X for 10 minutes each. Guts were then incubated with Hoescht (1:1000) for 30 minutes.
Confocal images were collected using a Nikon Eclipse Ti confocal system (utilizing a single focal plane) and processed using the Nikon software and Adobe Photoshop.
Total Protein Ponceau
10 fly midguts were dissected in PBS and homogenized in lysis buffer (50 mM Tris-HCl, pH 8.0, 150 mM NaCl, 1% triton), and 1× protease inhibitor. The lysate was centrifuged at 14,000 g for 20 min at 4°C, and each sample was boiled for 10 min in Laemmli buffer before loading onto an SDS polyacrylamide gel. Proteins were transferred onto nitro-cellulose membranes and visualized using ponceau stain. Blots were imaged using a BioRad Chemidoc.
Cycloheximide Feeding
NP1Gal4 > Ctrl. (w1118) flies were reared as per the experimental timeline (Figure S1A). Mated females were then flipped onto independent diets with 200 μL of 17 mM Cycloheximide thatched into the top of the food. Cycloheximide food was flipped on the second day and midgut dissections were performed on the fifth day followed by OP-Puro assay analysis or culture-dependent microbe analysis.
QUANTIFICATION AND STATISTICAL ANALYSIS
All p values were calculated using the Student’s t test with unpaired samples.
All error bars related to microbial quantification using CFUs represent median ± standard error: Figures 1A, 1F, 1G, 3B, 5H, S1G–S1K, S4F, and S5E
All other error bars represent mean ± standard error, and n representations are as follows:
Number of pooled midgut bacterial extracts: Figures 1E, 3A, and S1F
Number of pooled dissected midgut samples: Figures 2A, 2B, S2B–S2E, S3C, S3G, and S4E
Number of independent images analyzed: Figures 2D, 5D, 5E, S3B, S3D, S3E, and S3F
Number of independent chromatin preps from whole flies: Figure 4A
Number of independent chromatin preps from S2 Cells: Figure 4B
Number of whole flies: Figures S1B and S2A
Number of pooled S2 cell samples: Figure S4A
Exact values of all n’s can be found in Figure legends.
Supplementary Material
KEY RESOURCES TABLE
| REAGENT or RESOURCE | SOURCE | IDENTIFIER |
|---|---|---|
| Antibodies | ||
| Anti-Relish | RayBiotech | Cat#: RB-14-0004; RRID: AB_1547850 |
| Anti-non-phospho-4EBP1 (Thr46) (87D12) | Cell Signaling | Cat#: 4923; RRID: AB_659944 |
| Anti-phospho-4EBP1 (Thr37/46) (236B6) | Cell Signaling | Cat#: 2855; RRID: AB_560835 |
| Anti-Phosopho-eiF2α | Cell Signaling | Cat#: 119A11; RRID: AB_390740 |
| Anti-Armadillo N2 7A1 | Dev. Studies Hybridoma Bank | RRID: AB_528089 |
| Alexa Flour 488-conjugated Anti-Rabbit IgG | Jackson Immunoresearch | Cat#: 119191 |
| Alexa Flour 647-conjugated Anti-Rabbit IgG | Jackson Immunoresearch | Cat#: 122181 |
| Chemicals, Peptides, and Recombinant Proteins | ||
| DAPI (4’,6-Diamidino-2-Phenylindole, Dihydrochloride) | Thermo Fisher Scientific | Cat#: D1306 |
| Drosophila Agar, Type II | Genesee | Cat#: 66-103 |
| Malt Extract | Genesee | Cat#: 62-110 |
| Inactive Dry yeast | Genesee | Cat#: 62-106 |
| Cornmeal | Genesee | Cat#: 62-101 |
| Propionic acid | VWR | Cat#: TCP0500-500mL |
| Methyl 4-Hydroxybenzoate | VWR | Cat#: 97061-946 |
| Sucrose | VWR | Cat#: 97063-788 |
| Trizol | Life Technologies | Cat#: 15596018 |
| Superscript III Reverse Transcriptase | Life Technologies | Cat#: 18080-044 |
| iTaq Universal SYBR Green Supermix | Biorad | Cat#: 1725121 |
| DreamTaq PCR Master Mix | Thermo Fisher Scientific | Cat#: K1081 |
| Sph I-HF | New England BioLab | Cat#: R3182S |
| Xho I | New England BioLab | Cat#: R0146S |
| CutSmart Buffer | New England BioLab | Cat#: B7202S |
| T4 DNA Ligase | New England BioLab | Cat#: M0202T |
| RNase A | QIAGEN | Cat#: 19101 |
| Brilliant blue | Sigma-Aldrich | Cat#: B0149 |
| Protease Inhibitor Cocktail | Thermo Fisher Scientfic | Cat#: 78440 |
| Proteinase K | VWR | Cat#: 0706 |
| Bovine Serum Albumin | VWR | Cat#: 97061 |
| MRS Agar | BD | Cat#: 288210 |
| D-mannitol | VWR | Cat#: BDH9248-500G |
| Yeast Extract | VWR | Cat#: 97063-370 |
| Peptone | VWR | Cat#: 97064-330 |
| Agarose I | VWR | Cat#: 97062-250 |
| LB Broth | BD | Cat#: 244620 |
| LiCl | Amresco | Cat#: 0416-100G |
| KCl | J.T.Baker | Cat#: 3052-01 |
| CaCl2 | Macron | Cat#: 4160-12 |
| Ponceau Xylidine | Sigma-Aldrich | Cat#: 22308 |
| PMSF | Thermo Fisher Scientific | Cat#: 36978 |
| Sodium Deoxycholate | Alfa Aesar (by Thermo Fisher Scientific) | Cat#: J622-88 |
| Penicillin/ Streptomycin | GIBCO | Cat#: 15140-122 |
| Ampicillin | Sigma-Aldrich | Cat#: A0166 |
| Cycloheximide | Sigma-Aldrich | Cat#: C7698 |
| Schneider’s Drosophila media | Sigma-Aldrich | Cat#: S9895 |
| FBS | Sigma-Aldrich | Cat#: F4135 |
| Shields and Sang M3 Insect Medium | Sigma-Aldrich | Cat#: S8398 |
| Critical Commercial Assays | ||
| DNeasy UltraClean Microbial Kit | QIAGEN | Cat#: 12224 |
| QIAquick PCR purification Kit | QIAGEN | Cat#: 28104 |
| QIAquick Gel extraction Kit | QIAGEN | Cat#: 28704 |
| QIAprep spin miniprep Kit | QIAGEN | Cat#: 27104 |
| Plasmid midi Kit | QIAGEN | Cat#: 12143 |
| Click-iT Plus OPP Alexa Fluor 594 Protein Synthesis Assay Kit | Thermo Fisher Scientific | Cat#: C10457 |
| Experimental Models: Cell Lines | ||
| S2R+ | Drosophila Genomics Resource Center | Stock#: 150; Flybase: FBtc0000150 |
| Experimental Models: Organisms/Strains | ||
| D. melanogaster: w1118 | Bloomington Drosophila Stock Center and Hazelrigg et al., 1984 | BDSC: 3605; FlyBase: FBst0003605 |
| D. melanogaster: UAS-Foxo RNAi (y1w*; P {KK108485}VIE-260B) | Vienna Drosophila RNAi Center and Dietzl et al., 2007 | VDRC: 106097; FlyBase: FBst0477923 |
| D. melanogaster: w*;; relE20, es | Bloomington Drosophila Stock Center and Hedengren et al., 1999 | BDSC: 9457; FlyBase: FBst0009457 |
| D. melanogaster:;; relE20 | This study | N/A |
| D. melanogaster: w−;; foxow24 / TM3 | Weber et al., 2005 | N/A |
| D. melanogaster: UAS-Key RNAi (GD) (w1118;; P{GD1249}v7723) | Vienna Drosophila RNAi Center and Dietzl et al., 2007 | VDRC:7723; FlyBase: FBst0470808 |
| D. melanogaster: UAS-Dredd RNAi (KK) (y1w*; P{KK110428}VIE-260B) | Vienna Drosophila RNAi Center and Dietzl et al., 2007 | VDRC: 104726; FlyBase: FBst0476565 |
| D. melanogaster: UAS-Rel RNAi (GD) (w1118; P{GD1199}v49413) | Vienna Drosophila RNAi Center and Dietzl et al., 2007 | VDRC:49413; FlyBase:FBst0468440 |
| D. melanogaster: UAS-Rel RNAi (KK) (y1w*; P{KK109851}VIE-260B) | Vienna Drosophila RNAi Center and Dietzl et al., 2007 | VDRC: 108469; FlyBase: FBst0480279 |
| D. melanogaster: UAS-White RNAi (GD) | Vienna Drosophila RNAi Center; Dietzl et al., 2007 | VDRC: 30033 FlyBase:FBgn0026792 |
| D. melanogaster: UAS-eIF4B shRNA ;(P {VSH330010}attP40) | Vienna Drosophila RNAi Center | VDRC: 330010 FlyBase: FBst0490927 |
| D. melanogaster: UAS-eIF4E-7 RNAi (KK) (y1w*; P{KK103628}VIE-260B) | Vienna Drosophila RNAi Center; Dietzl et al., 2007 | VDRC: 107958 FlyBase: FBst0479771 |
| D. melanogaster: UAS-eIF4E-4 RNAi (KK) (y1w*; P{KK105485}VIE-260B) | Vienna Drosophila RNAi Center; Dietzl et al., 2007 | VDRC: 107595 FlyBase: FBst0479414 |
| D. melanogaster: UAS-eIF4G RNAi (GD) (w1118;; P{GD7098}v17002) | Vienna Drosophila RNAi Center; Dietzl et al., 2007 | VDRC: 17002 FlyBase: FBst0452492 |
| D. melanogaster: UAS-eIF2α RNAi (KK) (y1w*; P{KK100282}VIE-260B) | Vienna Drosophila RNAi Center; Dietzl et al., 2007 | VDRC: 104562 FlyBase: FBst0476420 |
| D. melanogaster: UAS-eeF2 RNAi (KK) (y1w*; P{KK101580}VIE-260B) | Vienna Drosophila RNAi Center; Dietzl et al., 2007 | VDRC: 108597 FlyBase: FBst0480407 |
| D. melanogaster: OreR (Oregon-R-C) | Bloomington Drosophila Stock Center | BDSC: 5 |
| D. melanogaster: w1118; ThorP/E_WT_RFP | This study | N/A |
| D. melanogaster: w1118; ThorP/E_Δ1_RFP | This study | N/A |
| D. melanogaster: w1118; ThorP/E_Δ2_RFP | This study | N/A |
| D. melanogaster: w1118; ThorP/E_WT_TORCAR | This study | N/A |
| D. melanogaster: w1118; ThorP/E_Δ2_TORCAR | This study | N/A |
| D. melanogaster: UAS-Thor RNAi (GD) (w1118;; P{GD12533}v35439) | Vienna Drosophila RNAi Center; Dietzl et al., 2007 | VDRC: 35439 FlyBase: FBst0461158 |
| D. melanogaster: w1118; UAS-Thor WT | Zid et al., 2009 | N/A |
| D. melanogaster: w1118; NP1(Myo1a)Gal4 | Cronin et al., 2009 | N/A |
| D. melanogaster: MARCM82B | This study | N/A |
| D. melanogaster: y[d2] w1118 P{ry[+t7.2] = ey-FLP.N}1;; P{ry[+t7.2] = neoFRT}82B P{w [+mC] = lacW}/TM3, P{y[+t7.7] ry[+t7.2]} AS1, Ser[1] | Bloomington Drosophila Stock Center | BDSC: 37722 |
| D. melanogaster: w1118;; P{ry[+t7.2] = neoFRT}82B | This study | N/A |
| Oligonucleotides | ||
| Primers for Mondo, see Table S1 | This study | N/A |
| Primers for Rpl32, see Table S1 | This study | N/A |
| Primers for AmyP, see Table S1 | This study | N/A |
| Primers for Jon66Cii, see Table S1 | This study | N/A |
| Primers for Relish, see Table S1 | This study | N/A |
| Primers for Thor, see Table S1 | This study | N/A |
| Primers for α-Trypsin, see Table S1 | This study | N/A |
| Primers for β-Trypsin, see Table S1 | This study | N/A |
| Primers for Jon65Ai, see Table S1 | This study | N/A |
| Primers for Sugarbabe, see Table S1 | This study | N/A |
| Primers for CG6770, see Table S1 | This study | N/A |
| Primers for CG11658, see Table S1 | This study | N/A |
| Primers for Dpt, see Table S1 | This study | N/A |
| Primers for Drs, see Table S1 | This study | N/A |
| Primers for Actin 5C, see Table S1 | This study | N/A |
| Primers for Reptor, see Table S1 | This study | N/A |
| Primers for ReptorBP, see Table S1 | This study | N/A |
| Primers for Puc, see Table S1 | This study | N/A |
| Primers for Lactobacillus 16S, see Table S1 | This study | N/A |
| Primers for Universal 16S, see Table S1 | This study | N/A |
| Primers for Acetobacter 16S, see Table S1 | This study | N/A |
| Primers for P. entomophila, see Table S1 | This study | N/A |
| R1 (Thor promoter/enhancer) | This study | N/A |
| Primers for R1 (Thor promoter/enhamcer), see Table S2 | This study | N/A |
| Primers for Act5cP (promoter region), see Table S2 | This study | N/A |
| Primers for Thor 3’ UTR, see Table S2 | This study | N/A |
| Drosophila Negative Control (NC) Primer Set 1 | Active Motif | Cat#: 71028 |
| Software and Algorithms | ||
| FlyBase | https://flybase.org/ | |
| gBlock Gene Fragments | Integrated DNA Technology | https://www.idtdna.com/pages |
| DNA Sequencing | Eton Bioscience | https://www.etonbio.com/ |
| Generation of Transgenic Flies | Rainbow Transgenic Flies | https://www.rainbowgene.com/ |
| JASPAR Database | Khan et al., 2018 | http://jaspar.genereg.net/ |
| Illumina BaseSpace | Illumina | https://basespace.illumina.com |
| ImageJ | NIH | https://imagej.nih.gov/ij/ |
| Other | ||
| StepOnePlus Real-Time PCR systems | Applied Biosystems | N/A |
| Leica M165FC system | Leica | N/A |
| Nikon Eclipse Ti Confocal system | Nikon | N/A |
| Illumina MiSeq | Illumina | N/A |
| Bioruptor/sonicator | Diagenode | UCD-200 |
| Pierce Protein A magnetic beads | Thermo Fisher Scientific | Cat#: 88845 |
| Plasmid for generating reporter constructs | Chatterjee and Bohmann, 2012 | N/A |
| Ecc15 Bacteria | Basset et al., 2009 | N/A |
| BugDorm-1 Insect Rearing Dorm | Bugdorm | N/A |
| Epoch Microplate Spectrophotometer | BioTek | N/A |
| Coy Lab Vinyl Anaerobic Chamber | Coy Lab | N/A |
| BioRad Chemidoc | BioRad | N/A |
| QUBIT 4 Fluorometer | Thermo-Fisher Scientific | N/A |
Highlights.
Midgut NF-κB/Relish function modulates dietary adaptation of microbiota
NF-κB/Relish limits the diet inducibility of 4E-BP/Thor
4E-BP/Thor dictates diet-dependent changes in microbiota composition
Cap-dependent translation is required for dietary adaptation of microbiota
ACKNOWLEDGMENTS
This work was supported by the National Institute of Diabetes and Digestive and Kidney Diseases (grant R01 DK108930 to J.K. and predoctoral fellowship F30 DK117538 to C.V.). Stocks obtained from the Bloomington Drosophila Stock Center (NIH P40OD01837) were used in this study. S2R+ cells used in this study were obtained from Drosophila Genomics Resource Center (NIH grant 2P40OD010949).
Footnotes
SUPPLEMENTAL INFORMATION
Supplemental Information can be found online at https://doi.org/10.1016/j.celrep.2020.107736.
DECLARATION OF INTERESTS
The authors declare no competing interests.
REFERENCES
- Bäckhed F, Ding H, Wang T, Hooper LV, Koh GY, Nagy A, Semenkovich CF, and Gordon JI (2004). The gut microbiota as an environmental factor that regulates fat storage. Proc. Natl. Acad. Sci. USA 101, 15718–15723. [DOI] [PMC free article] [PubMed] [Google Scholar]
- Basset A, Khush RS, Braun A, Gardan L, Boccard F, Hoffmann JA, and Lemaitre B (2009). The phytopathogenic bacteria Erwinia carotovora infects Drosophila and activates an immune response. PNAS 97, 3376–3381. [DOI] [PMC free article] [PubMed] [Google Scholar]
- Becker T, Loch G, Beyer M, Zinke I, Aschenbrenner AC, Carrera P, Inhester T, Schultze JL, and Hoch M (2010). FOXO-dependent regulation of innate immune homeostasis. Nature 463, 369–373. [DOI] [PubMed] [Google Scholar]
- Bordenstein SR, and Theis KR (2015). Host Biology in Light of the Microbiome: Ten Principles of Holobionts and Hologenomes. PLoS Biol. 13, e1002226. [DOI] [PMC free article] [PubMed] [Google Scholar]
- Broderick NA, and Lemaitre B (2012). Gut-associated microbes of Drosophila melanogaster. Gut Microbes 3, 307–321. [DOI] [PMC free article] [PubMed] [Google Scholar]
- Broderick NA, Buchon N, and Lemaitre B (2014). Microbiota-induced changes in Drosophila melanogaster host gene expression and gut morphology. mBio 5, e01117–14. [DOI] [PMC free article] [PubMed] [Google Scholar]
- Buchon N, Silverman N, and Cherry S (2014). Immunity in Drosophila melanogaster-from microbial recognition to whole-organism physiology. Nat. Rev. Immunol 14, 796–810. [DOI] [PMC free article] [PubMed] [Google Scholar]
- Charroux B, and Royet J (2012). Gut-microbiota interactions in non-mammals: what can we learn from Drosophila? Semin. Immunol 24, 17–24. [DOI] [PubMed] [Google Scholar]
- Chatterjee N, and Bohmann D (2012). A versatile FC31 based reporter system for measuring AP-1 and Nrf2 signaling in Drosophila and in tissue culture. PLoS One 7, e34063. [DOI] [PMC free article] [PubMed] [Google Scholar]
- Clark RI, Tan SWS, Péan CB, Roostalu U, Vivancos V, Bronda K, Pilátová M, Fu J, Walker DW, Berdeaux R, et al. (2013). MEF2 is an in vivo immune-metabolic switch. Cell 155, 435–447. [DOI] [PMC free article] [PubMed] [Google Scholar]
- Conlon MA, and Bird AR (2014). The impact of diet and lifestyle on gut microbiota and human health. Nutrients 7, 17–44. [DOI] [PMC free article] [PubMed] [Google Scholar]
- Consuegra J, Grenier T, Baa-Puyoulet P, Rahioui I, Akherraz H, Gervais H, Parisot N, da Silva P, Charles H, Calevro F, et al. (2019). Commensal bacteria differentially shape the nutritional requirements of Drosophila during juvenile growth. bioRxiv. 10.1101/728774. [DOI] [PMC free article] [PubMed] [Google Scholar]
- Cronin SJ, Nehme NT, Limmer S, Liegeois S, Pospisilik JA, Schramek D, Leibbrandt A, Simoes Rde.M., Gruber S, Puc U, et al. (2009). Genome-wide RNAi screen identifies genes involved in intestinal pathogenic bacterial infection. Science 325, 340–343. [DOI] [PMC free article] [PubMed] [Google Scholar]
- De Filippo C, Cavalieri D, Di Paola M, Ramazzotti M, Poullet JB, Massart S, Collini S, Pieraccini G, and Lionetti P (2010). Impact of diet in shaping gut microbiota revealed by a comparative study in children from Europe and rural Africa. Proc. Natl. Acad. Sci. USA 107, 14691–14696. [DOI] [PMC free article] [PubMed] [Google Scholar]
- Deliu LP, Ghosh A, and Grewal SS (2017). Investigation of protein synthesis in Drosophila larvae using puromycin labelling. Biol. Open 6, bio.026294. [DOI] [PMC free article] [PubMed] [Google Scholar]
- DiAngelo JR, Bland ML, Bambina S, Cherry S, and Birnbaum MJ (2009). The immune response attenuates growth and nutrient storage in Drosophila by reducing insulin signaling. Proc. Natl. Acad. Sci. USA 106, 20853–20858. [DOI] [PMC free article] [PubMed] [Google Scholar]
- Dietzl G, Chen D, Schnorrer F, Su KC, Barinova Y, Fellner M, Gasser B, Kinsey K, Oppel S, Scheiblauer S, et al. (2007). A genome-wide transgenic RNAi library for conditional gene inactivation in Drosophila. Nature 448, 151–156. [DOI] [PubMed] [Google Scholar]
- Douglas AE (2011). Lessons from studying insect symbioses. Cell Host Microbe 10, 359–367. [DOI] [PMC free article] [PubMed] [Google Scholar]
- Engel P, and Moran NA (2013). The gut microbiota of insects - diversity in structure and function. FEMS Microbiol. Rev 37, 699–735. [DOI] [PubMed] [Google Scholar]
- Erkosar B, Defaye A, Bozonnet N, Puthier D, Royet J, and Leulier F (2014). Drosophila microbiota modulates host metabolic gene expression via IMD/NF-κB signaling. PLoS One 9, e94729. [DOI] [PMC free article] [PubMed] [Google Scholar]
- Fisher RM, Henry LM, Cornwallis CK, Kiers ET, and West SA (2017). The evolution of host-symbiont dependence. Nat. Commun 8, ncomms15973. [DOI] [PMC free article] [PubMed] [Google Scholar]
- Flint HJ, Scott KP, Louis P, and Duncan SH (2012). The role of the gut microbiota in nutrition and health. Nat. Rev. Gastroenterol. Hepatol 9, 577–589. [DOI] [PubMed] [Google Scholar]
- Gilbert JA, and Neufeld JD (2014). Life in a World without Microbes. PLoS Biol. 12, e1002020. [DOI] [PMC free article] [PubMed] [Google Scholar]
- Goodman AL, McNulty NP, Zhao Y, Leip D, Mitra RD, Lozupone CA, Knight R, and Gordon JI (2009). Identifying genetic determinants needed to establish a human gut symbiont in its habitat. Cell Host Microbe 6, 279–289. [DOI] [PMC free article] [PubMed] [Google Scholar]
- Ha E-M, Oh C-T, Ryu J-H, Bae Y-S, Kang S-W, Jang IH, Brey PT, and Lee W-J (2005). An antioxidant system required for host protection against gut infection in Drosophila. Dev. Cell 8, 125–132. [DOI] [PubMed] [Google Scholar]
- Hazelrigg T, Levis R, and Rubin GM (1984). Transformation of white locus DNA in Drosophila: Dosage compensation, zeste interaction, and position effects. Cell 36, 469–481. [DOI] [PubMed] [Google Scholar]
- Hedengren M, Asling B, Dushay MS, Ando I, Ekengren S, Wihlborg M, and Hultmark D (1999). Relish, a central factor in the control of humoral but not cellular immunity in Drosophila. Mol. Cell 4, 827–837. [DOI] [PubMed] [Google Scholar]
- Ji Y, Thomas C, Tulin N, Lodhi N, Boamah E, Kolenko V, and Tulin AV (2016). Charon Mediates Immune Deficiency-Driven PARP-1-Dependent Immune Responses in Drosophila. J. Immunol 197, 2382–2389. [DOI] [PMC free article] [PubMed] [Google Scholar]
- Jünger MA, Rintelen F, Stocker H, Wasserman JD, Végh M, Radimerski T, Greenberg ME, and Hafen E (2003). The Drosophila forkhead transcription factor FOXO mediates the reduction in cell number associated with reduced insulin signaling. J. Biol 2, 20. [DOI] [PMC free article] [PubMed] [Google Scholar]
- Kamareddine L, Robins WP, Berkey CD, Mekalanos JJ, and Watnick PI (2018). The Drosophila Immune Deficiency Pathway Modulates Enteroendocrine Function and Host Metabolism. Cell Metab. 28, 449–462.e5. [DOI] [PMC free article] [PubMed] [Google Scholar]
- Kang M-J, Vasudevan D, Kang K, Kim K, Park J-E, Zhang N, Zeng X, Neubert TA, Marr MT 2nd, and Ryoo HD (2017). 4E-BP is a target of the GCN2-ATF4 pathway during Drosophila development and aging. J. Cell Biol 216, 115–129. [DOI] [PMC free article] [PubMed] [Google Scholar]
- Kapuria S, Karpac J, Biteau B, Hwangbo D, and Jasper H (2012). Notch-mediated suppression of TSC2 expression regulates cell differentiation in the Drosophila intestinal stem cell lineage. PLoS Genet. 8, e1003045. [DOI] [PMC free article] [PubMed] [Google Scholar]
- Karasov WH, and Douglas AE (2013). Comparative digestive physiology. Compr. Physiol 3, 741–783. [DOI] [PMC free article] [PubMed] [Google Scholar]
- Kau AL, Ahern PP, Griffin NW, Goodman AL, and Gordon JI (2011). Human nutrition, the gut microbiome and the immune system. Nature 474, 327–336. [DOI] [PMC free article] [PubMed] [Google Scholar]
- Keebaugh ES, Yamada R, Obadia B, Ludington WB, and Ja WW (2018). Microbial quantity impacts Drosophila nutrition, development, and lifespan. iScience 4, 247–259. [DOI] [PMC free article] [PubMed] [Google Scholar]
- Keebaugh ES, Yamada R, and Ja WW (2019). The Nutritional Environment Influences the Impact of Microbes on Drosophila melanogaster Life Span. mBio 10, e00885–19. [DOI] [PMC free article] [PubMed] [Google Scholar]
- Khan A, Fornes O, Stigliani A, Gheorghe M, Castro-Mondragon JA, van der Lee R, Bessy A, Chèneby J, Kulkarni SR, Tan G, et al. (2018). JASPAR 2018: update of the open-access database of transcription factor binding profiles and its web framework. Nucleic Acids Res. 46, D1284. [DOI] [PMC free article] [PubMed] [Google Scholar]
- Kostic AD, Howitt MR, and Garrett WS (2013). Exploring host-microbiota interactions in animal models and humans. Genes Dev. 27, 701–718. [DOI] [PMC free article] [PubMed] [Google Scholar]
- Lemaitre B, and Girardin SE (2013). Translation inhibition and metabolic stress pathways in the host response to bacterial pathogens. Nat. Rev. Microbiol 11, 365–369. [DOI] [PubMed] [Google Scholar]
- Ley RE, Hamady M, Lozupone C, Turnbaugh PJ, Ramey RR, Bircher JS, Schlegel ML, Tucker TA, Schrenzel MD, Knight R, and Gordon JI (2008). Evolution of mammals and their gut microbes. Science 320, 1647–1651. [DOI] [PMC free article] [PubMed] [Google Scholar]
- Lhocine N, Ribeiro PS, Buchon N, Wepf A, Wilson R, Tenev T, Lemaitre B, Gstaiger M, Meier P, and Leulier F (2008). PIMS modulates immune tolerance by negatively regulating Drosophila innate immune signaling. Cell Host Microbe 4, 147–158. [DOI] [PubMed] [Google Scholar]
- Liu J, Xu Y, Stoleru D, and Salic A (2012). Imaging protein synthesis in cells and tissues with an alkyne analog of puromycin. Proc. Natl. Acad. Sci. USA 109, 413–418. [DOI] [PMC free article] [PubMed] [Google Scholar]
- Ma D, Storelli G, Mitchell M, and Leulier F (2015). Studying host-microbiota mutualism in Drosophila: Harnessing the power of gnotobiotic flies. Biomed. J 38, 285–293. [DOI] [PubMed] [Google Scholar]
- Ma D, Bou-Sleiman M, Joncour P, Indelicato C-E, Frochaux M, Braman V, Litovchenko M, Storelli G, Deplancke B, and Leulier F (2019). Commensal gut bacteria buffer the impact of host genetic variants on Drosophila developmental traits under nutritional stress. iScience 19, 436–447. [DOI] [PMC free article] [PubMed] [Google Scholar]
- Martino ME, Joncour P, Leenay R, Gervais H, Shah M, Hughes S, Gillet B, Beisel C, and Leulier F (2018). Bacterial Adaptation to the Host’s Diet Is a Key Evolutionary Force Shaping Drosophila-Lactobacillus Symbiosis. Cell Host Microbe 24, 109–119.e6. [DOI] [PMC free article] [PubMed] [Google Scholar]
- Miron M, Verdú J, Lachance PED, Birnbaum MJ, Lasko PF, and Sonenberg N (2001). The translational inhibitor 4E-BP is an effector of PI(3)K/Akt signalling and cell growth in Drosophila. Nat. Cell Biol 3, 596–601. [DOI] [PubMed] [Google Scholar]
- Molaei M, Vandehoef C, and Karpac J (2019). NF-κB Shapes Metabolic Adaptation by Attenuating Foxo-Mediated Lipolysis in Drosophila. Dev. Cell 49, 802–810.e6. [DOI] [PMC free article] [PubMed] [Google Scholar]
- Nandy A, Lin L, Velentzas PD, Wu LP, Baehrecke EH, and Silverman N (2018). The NF-κB Factor Relish Regulates Atg1 Expression and Controls Autophagy. Cell Rep. 25, 2110–2120.e3. [DOI] [PMC free article] [PubMed] [Google Scholar]
- Odegaard JI, and Chawla A (2013). The immune system as a sensor of the metabolic state. Immunity 38, 644–654. [DOI] [PMC free article] [PubMed] [Google Scholar]
- Oeckinghaus A, Hayden MS, and Ghosh S (2011). Crosstalk in NF-κB signaling pathways. Nat. Immunol 12, 695–708. [DOI] [PubMed] [Google Scholar]
- Pais IS, Valente RS, Sporniak M, and Teixeira L (2018). Drosophila melanogaster establishes a species-specific mutualistic interaction with stable gut-colonizing bacteria. PLoS Biol. 16, e2005710. [DOI] [PMC free article] [PubMed] [Google Scholar]
- Parks BW, Nam E, Org E, Kostem E, Norheim F, Hui ST, Pan C, Civelek M, Rau CD, Bennett BJ, et al. (2013). Genetic control of obesity and gut microbiota composition in response to high-fat, high-sucrose diet in mice. Cell Metab. 17, 141–152. [DOI] [PMC free article] [PubMed] [Google Scholar]
- Richardson DHS (2010). Angela E. Douglas, The Symbiotic Habit. Symbiosis 51, 197–198. [Google Scholar]
- Richter JD, and Sonenberg N (2005). Regulation of cap-dependent translation by eIF4E inhibitory proteins. Nature 433, 477–480. [DOI] [PubMed] [Google Scholar]
- Roh SW, Nam Y-D, Chang H-W, Kim K-H, Kim M-S, Ryu J-H, Kim S-H, Lee W-J, and Bae J-W (2008). Phylogenetic characterization of two novel commensal bacteria involved with innate immune homeostasis in Drosophila melanogaster. Appl. Environ. Microbiol 74, 6171–6177. [DOI] [PMC free article] [PubMed] [Google Scholar]
- Ryu J-H, Kim S-H, Lee H-Y, Bai JY, Nam Y-D, Bae J-W, Lee DG, Shin SC, Ha E-M, and Lee W-J (2008). Innate immune homeostasis by the homeobox gene caudal and commensal-gut mutualism in Drosophila. Science 319, 777–782. [DOI] [PubMed] [Google Scholar]
- Shin SC, Kim S-H, You H, Kim B, Kim AC, Lee K-A, Yoon J-H, Ryu J-H, and Lee W-J (2011). Drosophila microbiome modulates host developmental and metabolic homeostasis via insulin signaling. Science 334, 670–674. [DOI] [PubMed] [Google Scholar]
- Simon J-C, Marchesi JR, Mougel C, and Selosse M-A (2019). Host-microbiota interactions: from holobiont theory to analysis. Microbiome 7, 5. [DOI] [PMC free article] [PubMed] [Google Scholar]
- Skorupa DA, Dervisefendic A, Zwiener J, and Pletcher SD (2008). Dietary composition specifies consumption, obesity, and lifespan in Drosophila melanogaster. Aging Cell 7, 478–490. [DOI] [PMC free article] [PubMed] [Google Scholar]
- Smith MI, Yatsunenko T, Manary MJ, Trehan I, Mkakosya R, Cheng J, Kau AL, Rich SS, Concannon P, Mychaleckyj JC, et al. (2013). Gut microbiomes of Malawian twin pairs discordant for kwashiorkor. Science 339, 548–554. [DOI] [PMC free article] [PubMed] [Google Scholar]
- Sonnenburg JL, and Bäckhed F (2016). Diet-microbiota interactions as moderators of human metabolism. Nature 535, 56–64. [DOI] [PMC free article] [PubMed] [Google Scholar]
- Storelli G, Defaye A, Erkosar B, Hols P, Royet J, and Leulier F (2011). Lactobacillus plantarum promotes Drosophila systemic growth by modulating hormonal signals through TOR-dependent nutrient sensing. Cell Metab. 14, 403–414. [DOI] [PubMed] [Google Scholar]
- Storelli G, Strigini M, Grenier T, Bozonnet L, Schwarzer M, Daniel C, Matos R, and Leulier F (2018). Drosophila Perpetuates Nutritional Mutualism by Promoting the Fitness of Its Intestinal Symbiont Lactobacillus plantarum. Cell Metab. 27, 362–377.e8. [DOI] [PMC free article] [PubMed] [Google Scholar]
- Teleman AA, Chen Y-W, and Cohen SM (2005). 4E-BP functions as a metabolic brake used under stress conditions but not during normal growth. Genes Dev. 19, 1844–1848. [DOI] [PMC free article] [PubMed] [Google Scholar]
- Tiebe M, Lutz M, De La Garza A, Buechling T, Boutros M, and Teleman AA (2015). REPTOR and REPTOR-BP Regulate Organismal Metabolism and Transcription Downstream of TORC1. Dev. Cell 33, 272–284. [DOI] [PMC free article] [PubMed] [Google Scholar]
- Vasudevan D, Clark NK, Sam J, Cotham VC, Ueberheide B, Marr MT 2nd, and Ryoo HD (2017). The GCN2-ATF4 Signaling Pathway Induces 4E-BP to Bias Translation and Boost Antimicrobial Peptide Synthesis in Response to Bacterial Infection. Cell Rep. 21, 2039–2047. [DOI] [PMC free article] [PubMed] [Google Scholar]
- Vijay-Kumar M, Aitken JD, Carvalho FA, Cullender TC, Mwangi S, Srinivasan S, Sitaraman SV, Knight R, Ley RE, and Gewirtz AT (2010). Metabolic syndrome and altered gut microbiota in mice lacking Toll-like receptor 5. Science 328, 228–231. [DOI] [PMC free article] [PubMed] [Google Scholar]
- Weber K, Johnson N, Champlin D, and Patty A (2005). Many P-element insertions affect wing shape in Drosophila melanogaster. Genetics 169, 1461–1475. [DOI] [PMC free article] [PubMed] [Google Scholar]
- Wong AC-N, Dobson AJ, and Douglas AE (2014). Gut microbiota dictates the metabolic response of Drosophila to diet. J. Exp. Biol 217, 1894–1901. [DOI] [PMC free article] [PubMed] [Google Scholar]
- Zhai Z, Boquete J-P, and Lemaitre B (2018). Cell-Specific Imd-NF-κB Responses Enable Simultaneous Antibacterial Immunity and Intestinal Epithelial Cell Shedding upon Bacterial Infection. Immunity 48, 897–910.e7. [DOI] [PubMed] [Google Scholar]
- Zhou X, Clister TL, Lowry PR, Seldin MM, Wong GW, and Zhang J (2015). Dynamic Visualization of mTORC1 Activity in Living Cells. Cell Rep. 10, 1767–1777. [DOI] [PMC free article] [PubMed] [Google Scholar]
- Zid BM, Rogers AN, Katewa SD, Vargas MA, Kolipinski MC, Lu TA, Benzer S, and Kapahi P (2009). 4E-BP extends lifespan upon dietary restriction by enhancing mitochondrial activity in Drosophila. Cell 139, 149–160. [DOI] [PMC free article] [PubMed] [Google Scholar]
Associated Data
This section collects any data citations, data availability statements, or supplementary materials included in this article.
Supplementary Materials
Data Availability Statement
The authors declare that all data supporting the findings of this study are available within the article and its Supplementary information files or upon request.