Abstract
Background and purpose:
Aicardi Goutières Syndrome (AGS) is a severe, autoinflammatory leukodystrophy characterized by global neurologic dysfunction. Our goal was to create an easy-to-apply scale relevant to the unique developmental challenges associated with AGS.
Methods:
All individuals were recruited through our natural history study. Individuals were classified by AGS severity as mild, moderate, or severe, and clinical encounters were assigned a composite score for neurologic function calculated from the sum of three functional classification scales. Through expert consensus, we identified 11 key items to reflect the severity of AGS across gross motor, fine motor, and cognitive skills to create the AGS Scale. There was strong interrater reliability. The AGS scale was applied across available medical records to evaluate neurologic function over time. The AGS scale was compared to performance on a standard measure of gross motor function (Gross Motor Function Measure-88, GMFM-88) and a putative diagnostic biomarker of disease, the interferon signaling gene expression score (ISG).
Results:
The AGS scale score correlated with severity classifications and the composite neurologic function scores. When retrospectively applied across our natural history study, the majority of individuals demonstrated an initial decline in function followed by stable scores. Within the first 6 months of disease, the AGS score was the most dynamic. The AGS scale correlated with performance by the GMFM-88, but did not correlate with ISG levels.
Conclusions:
This study demonstrates the utility of the AGS scale as a multimodal tool for the assessment of neurologic function in AGS. The AGS scale correlates with clinical severity and with a more labor-intensive tool, GMFM-88. This study underscores the limitations of the ISG score as a marker of disease severity. With the AGS scale, we found that AGS neurologic severity is the most dynamic early in disease. This novel AGS scale is a promising tool to longitudinally follow neurologic function in this unique population.
Keywords: Leukodystrophy, Interferonopathy, Neurodegenerative, Genetic, Outcome measure
1. Introduction
Aicardi Goutières Syndrome (AGS) is a rare genetic disorder of excessive interferon (IFN) production resulting in severe neurologic disability [7]. AGS results from pathogenic changes in genes associated within the nucleic acid sensing machinery (TREX1, RNASEH2A, RNASEH2B, RNASEH2C, SAMHD1, ADAR1, and IFIH1) [2,7,11,20]. Almost all individuals affected by AGS exhibit severe neurologic dysfunction with impairments in gross motor, fine motor, and cognitive domains ([1]).
Existing outcome measures have significant limitations in the AGS population. Floor effects make it difficult to distinguish among skill levels in the lower register. Additionally, children with AGS can demonstrate an atypical sequence of development, creating challenges with sequential scoring (e.g. standing before sitting), and insensitivity to delayed skill acquisition (e.g. new skill of babbling at age 5) [1]. Traditional outcome measures are labor-intensive and fatiguing in fragile populations, and often multiple tools are required to assess the multimodal disability found in AGS. As such, there is a lack of existing tools to easily measure the full neurologic disability found in AGS.
Disease-specific assessment tools have been beneficial in demonstrating change in other rare, neurologic disorders [5,10,13–15,19]. The lack of validated measures to study AGS has limited the evaluation of neurologic function in this rare disease. As targeted therapeutics are developed for AGS, it becomes increasingly important to be able to measure neurologic function in this unique population. To this end, we developed an AGS-specific neurologic scale. Our goal was to create a simple to apply tool, capable of measuring neurologic function longitudinally for use in future natural history studies and as a potential outcome measure in future clinical trials.
2. Methodology
2.1. Study design
This is a retrospective natural history study designed to develop a multimodal AGS scale. Individuals affected by AGS were recruited through the Myelin Disorders Bioregistry Project (MDBP) (NCT03047369; IRB approved), which is part of the Global Leukodystrophy Initiative Clinical Trial Network (GLIA-CTN). Individuals were included across three participating institutions: Children’s Hospital of Philadelphia, Istituto di Ricerca Clinica C. Mondino, and Spedali Civili of Brescia.
2.2. Subjects
Individuals with pathogenic or likely pathogenic mutations in the following AGS-related genes were included in this cohort: TREX1, RNASEH2A, RNASEH2B, RNASEH2C, SAMHD1, ADAR1, and IFIH1. Individuals without a known genetic diagnosis or insufficient developmental records were excluded. The cohorts for the development, validation, and clinical cohorts are described in Supplemental Fig. 1.
2.3. Data collection
Information, including genetics, neurologic function, and age at each evaluation, was collected from medical records. Milestone acquisition was obtained from medical records and confirmed by parental questionnaires. Data was extracted by a child neurologist.
2.4. Definition of AGS severity classes
This cohort was comprised of all individuals with available electronic medical records. A clinical severity assessment was assigned retrospectively to the last available clinical encounter by two child neurologists: “mild”, “moderate”, and “severe” (n = 65). When there was a discrepancy (n = 8), (mild-moderate or severe-moderate), the individual was assigned to the moderate classification.
2.5. Composite neurologic function score (rComposite)
Because of the age requirements for the application of the functional scales, this cohort was comprised of all individuals with available electronic medical records over the age of 18 months (n = 61/65). Three validated functional scores were assigned retrospectively to the last available clinical encounter as previously described for AGS: Gross Motor Functional Classification Scale (GMFCS), Manual Abilities Functional Classification Scale (MACS), and Communication Function Classification Scale (CFCS) [8,9,16,18,22]. Each of these scales is composed of 5-levels with ‘I’ as normal function and ‘V’ representing complete impairment. These values were reversed and summed, so that higher numbers represent greater function. This was designated as the ‘rComposite’.
2.6. Development of the AGS Scale
The AGS scale was developed by a panel of AGS experts by a consensus review process [6]. Each item was reviewed and modified for content validity, clarity, and face validity.
Items were selected from the rates of developmental skill acquisition in the AGS population [1]. Across the AGS population, the most commonly attained skills were smiling, head control, and babbling. As AGS affects all developmental domains, we selected three key developmental categories: cognitive development, fine motor development, and gross motor skills to be included in our scale. We removed items that were frequently absent from clinical records (e.g. the differentiation between immature and mature pincer grasp). We focused on the inclusion of items that could be consistently understood and administered [6].
To address issues around the validation of this outcome measure given the limitations of sample size in a rare disease and familiarity of the research team with this population, pilot testing was performed using blinded clinical encounters. These encounters were selected based on the presence of developmental skill information related to gross motor and cognitive function (n = 140 encounters from 35 individuals). In addition to the removal of all HIPPA identifiers, all identifying information was redacted from these clinical encounters, including gender pronouns and any unique characteristics and histories, by two unblinded members of the study team. These encounters retained only essential developmental and examination information. These blinded encounters were scored by two child neurologists. After scoring a limited set of encounters, the scores were compared between raters, and the definitions for each item were refined.
In the final AGS scale (Fig. 1), one point is awarded for the presence of the following skills: normocephaly, smiling, vocalizations, single words, sentences, fine motor skills (pincer grasp or self-feeding), head control, sitting independently, and rolling or crawling, mobile with assistance, and independently mobile. The points are summed to generate the final AGS scale score, which has a range of 0–11.
Fig. 1.
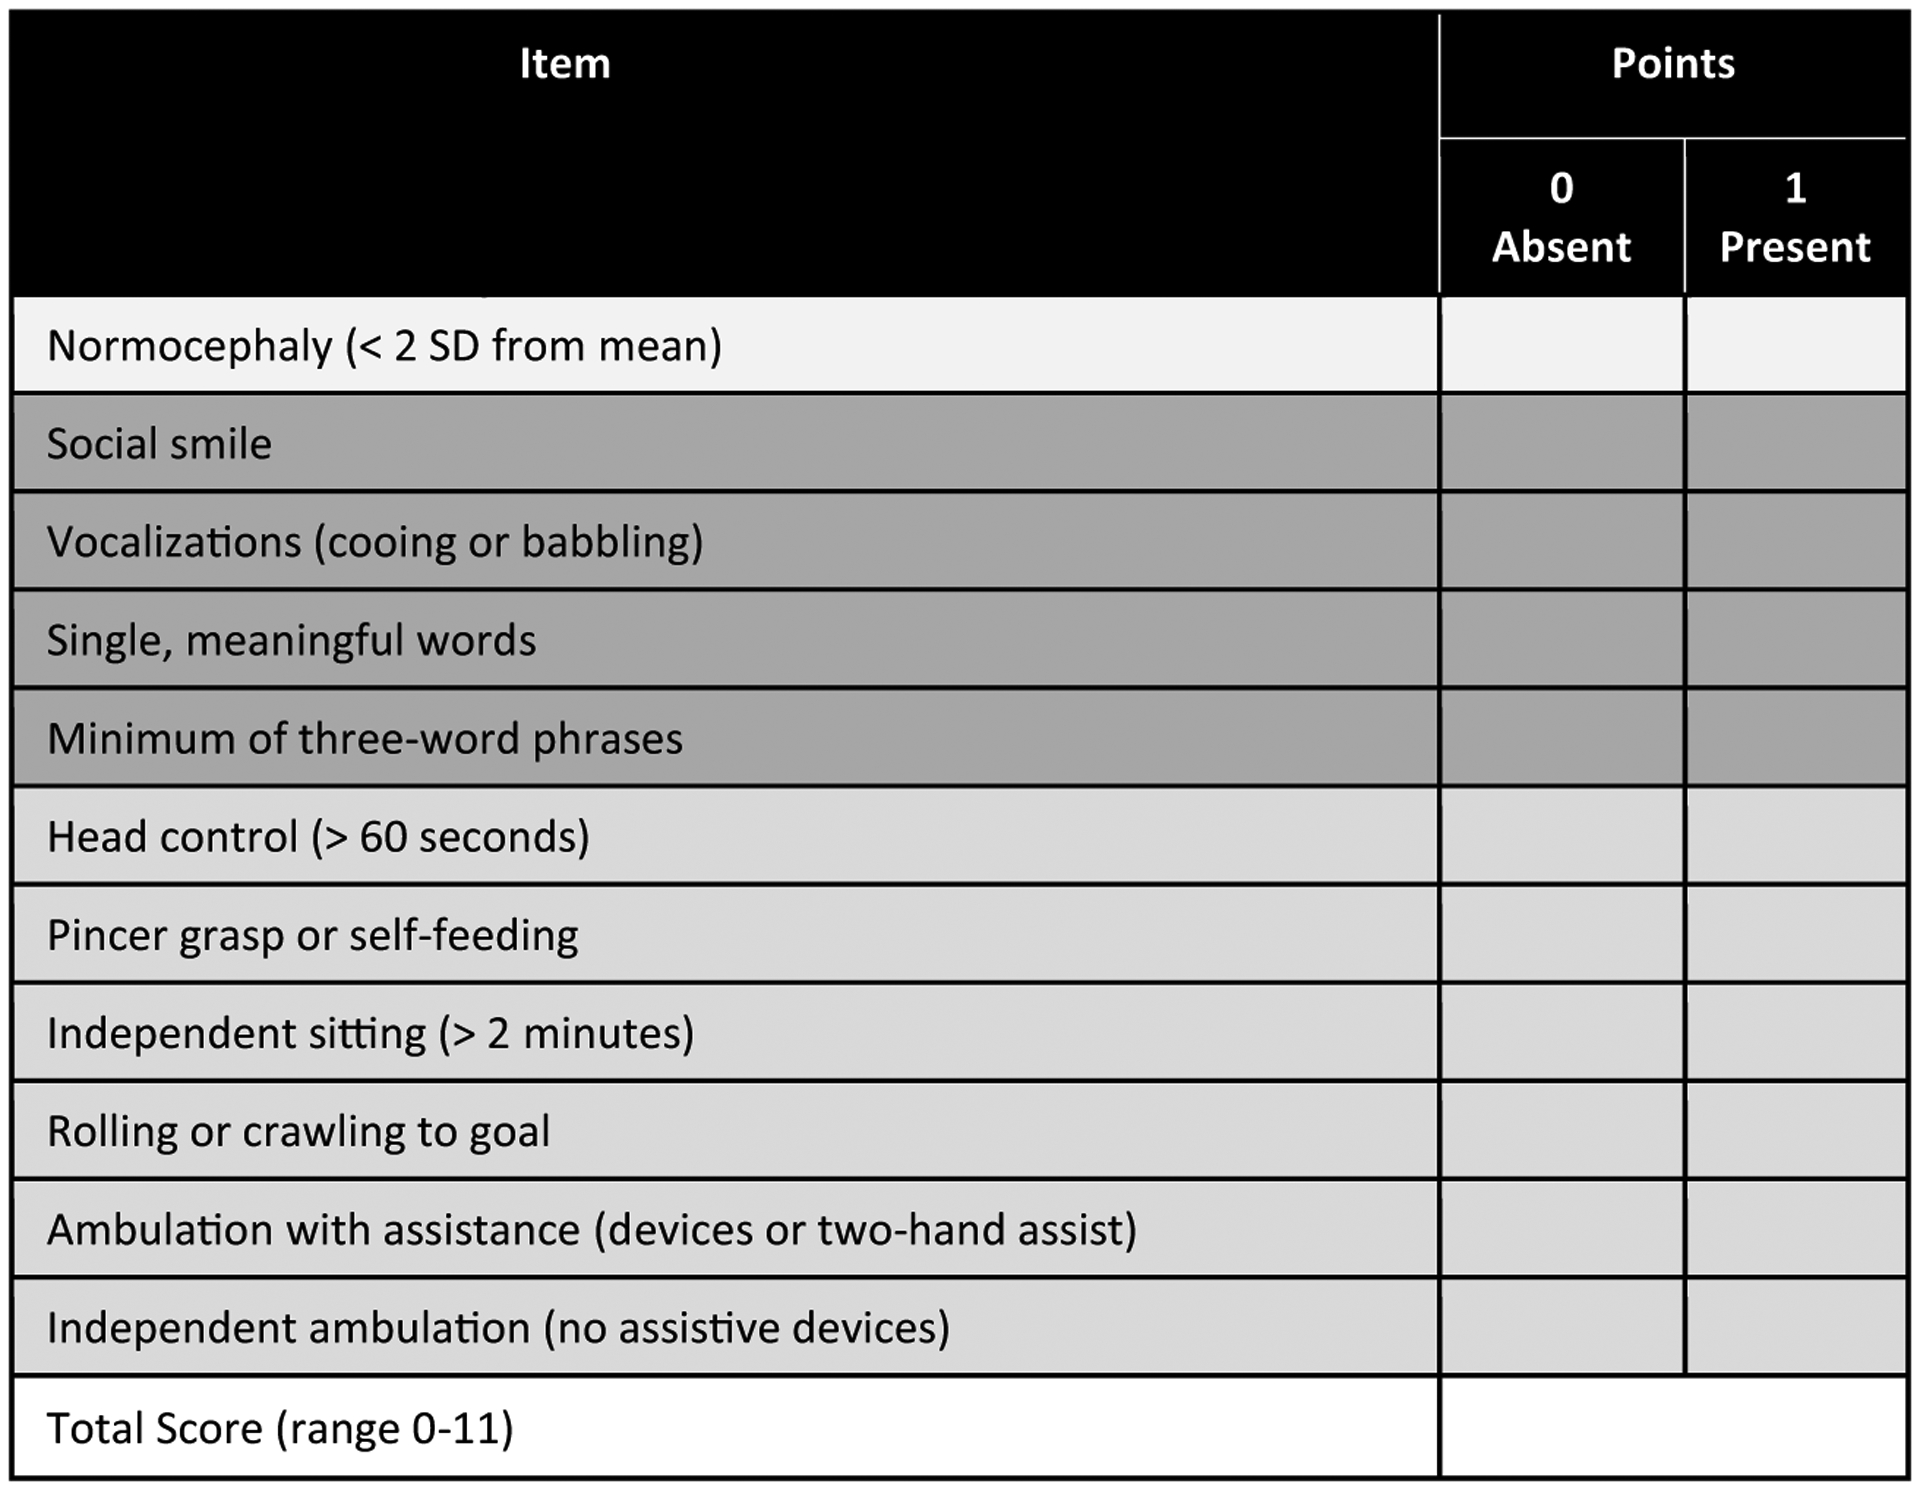
AGS Scale. © 2020, The Children’s Hospital of Philadelphia. All Rights Reserved.
A subset of blinded encounters were separately scored by two child neurologists and used to calculate the AGS scale agreement and kappa coefficient (total of 24 encounters per rater (92% agreement, kappa coefficient of 0.91; 95% confidence interval 0.81–0.99))
2.7. Application of the AGS scale
The AGS scale was applied to retrospective clinical encounters (533 clinical encounters from 92 individuals affected by AGS). Each score was assigned and verified by two child neurologists.
2.8. Gross motor function measure-88
A subset of individuals underwent Gross Motor Function Measure-88 (GMFM-88) assessments by trained therapists (n = 24) [3,12]. This cohort includes the first GMFM-88 assessment for all individuals. The GMFM-88 is divided into 5 subdomains: subdomain A (lying and rolling skills), subdomain B (sitting skills), subdomain C (crawling and kneeling skills), subdomain D (standing skills), and subdomain E (walking, running, and jumping skills).
2.9. Interferon signaling gene expression scores
IFN-signaling gene (ISG) scores are a diagnostic biomarker of AGS. This cohort included the first encounter at which ISG scores were obtained concurrently with clinical evaluations (n = 36). ISG scores (z-scores) were calculated as available from each clinical visit where blood samples were obtained. These scores were derived from the mRNA measurement of 6 IFN-inducible genes (IFI27, IFI44L, IFIT1, ISG15, RSAD2, and SIGLEC1) and 4 housekeeping genes (ALAS1, HPRT1, TBP, and TUBB) as previously described [4]. Briefly, patient blood samples were collected in PAXgene blood RNA tubes (PreAnalytiX), and RNA was purified using PAXgene blood RNA kits (Qiagen). RNA quality was assessed by RNA TapeStation (Agilent) and the RIN number of all of the samples was above 6.0. The concentration of RNA was quantified by Qubit High Sensitivity RNA assay (Thermo), and 200 ng RNA was used for each sample in the nCounter™ Digital Analyzer.
2.10. Statistical analysis
Excel 16.23 and Prism 8.0 were used to generate the graphs and statistics. Inter-rater reliability (agreement between two independent providers) of the AGS scale were assessed by kappa statistics and intraclass correlation coefficients (ICC). Mann Whitney test with two tailed p values were used when comparing two independent groups; the Kruskal-Wallis test was used to compare more than two independent groups. Spearman correlations were used to compare the AGS scale values to existing measures. Significance was defined when P < .05, adjusted for multiple comparisons with an overall Bonferroni correction. All comparisons maintained significance when an overall Bonferroni correction was applied to define significance between multiple groups.
3. Results
3.1. Neurologic severity in AGS
There is no validated tool to objectively measure neurologic severity in AGS. As AGS is a multimodal neurologic disorder, the sum of three neurologic severity scales that address gross motor (GMFCS), communication (CFCS), and fine motor (MACS) has been previously used in this population as a surrogate marker for global neurologic function. In this study, these three retrospective scales were applied to the most recent clinical encounters for individuals older than 18 months (n = 61). This value was calculated as a reverse composite score (rComposite) where larger numbers represent higher abilities.
To further address this need to categorize neurologic severity in AGS, two independent child neurologists assessed the neurologic severity of AGS (n = 65 individuals) as mild, moderate, and severe (Fig. 2). There was agreement in the categorizations in 87% of the encounters (n = 57 of 65). There was a significant difference between the rComposite scores between the mild (n = 10, mean 14.00 ± 1.63 standard deviation [SD], range 11–15), moderate (n = 21, mean 7.91 ± 1.95 SD, range 4–11), and severe (n = 30, mean 3.10 ± 0.40 SD, range 3–5) categories (Kruskal-Wallis test p value < .0001 for all comparisons). (Fig. 2B).
Fig. 2.
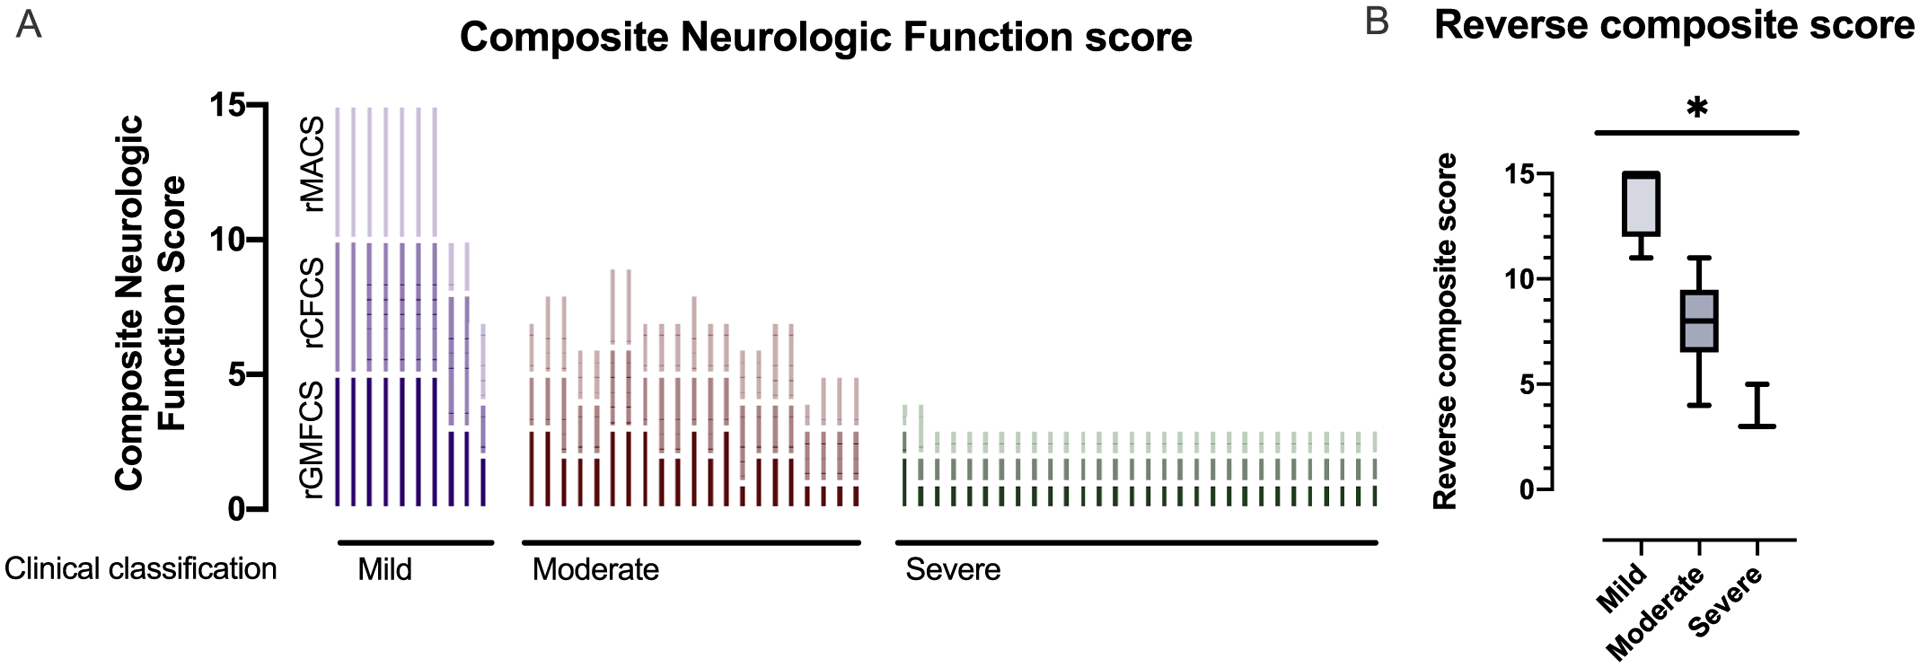
Neurologic severity in AGS. (A) Three classification scales (GMFCS, MACS, and CFCS) were applied to the most recent available clinical encounter retrospectively in 61 children with molecularly confirmed AGS and are presented as reverse composite (rComposite) scores. Individuals are clustered by severity classifications. Higher rComposite scores indicate less impairment. (B) Clinical severity was assigned to each clinical encounter as mild-moderate-severe. The rComposite scores were compared across the severity classifications: mild (n = 10, mean 14.00 ± 1.63 standard deviation [SD], range 11–15), moderate (n = 21, mean 7.91 ± 1.95 SD, range 4–11), and severe (n = 30, mean 3.10 ± 0.40 SD, range 3–5) categories (Kruskal-Wallis test p value < .0001 for all comparisons).
3.2. AGS scale development and validation
To address the need for a simple, multimodal scale to assess neurologic function in AGS, the AGS Scale was developed. This scale is a simple tool where one point is awarded in the presence of key developmental steps and for head circumference (Fig. 1). Microcephaly was included because it can be acquired in AGS and is strongly correlated with neurologic impairment [17]. The AGS scale was applied retrospectively to the rComposite encounters (n = 61). There was a The AGS scale was applied retrospectively to the rComposite encounters (n = 61). There was a significant correlation between the multimodal AGS Scale and the composite scale derived from the GMCSF, CSCS, and MACS (Spearman r 0.9273, 95% confidence interval 0.8795–0.9565, 2 tailed p value < .0001) (Fig. 3A).
Fig. 3.
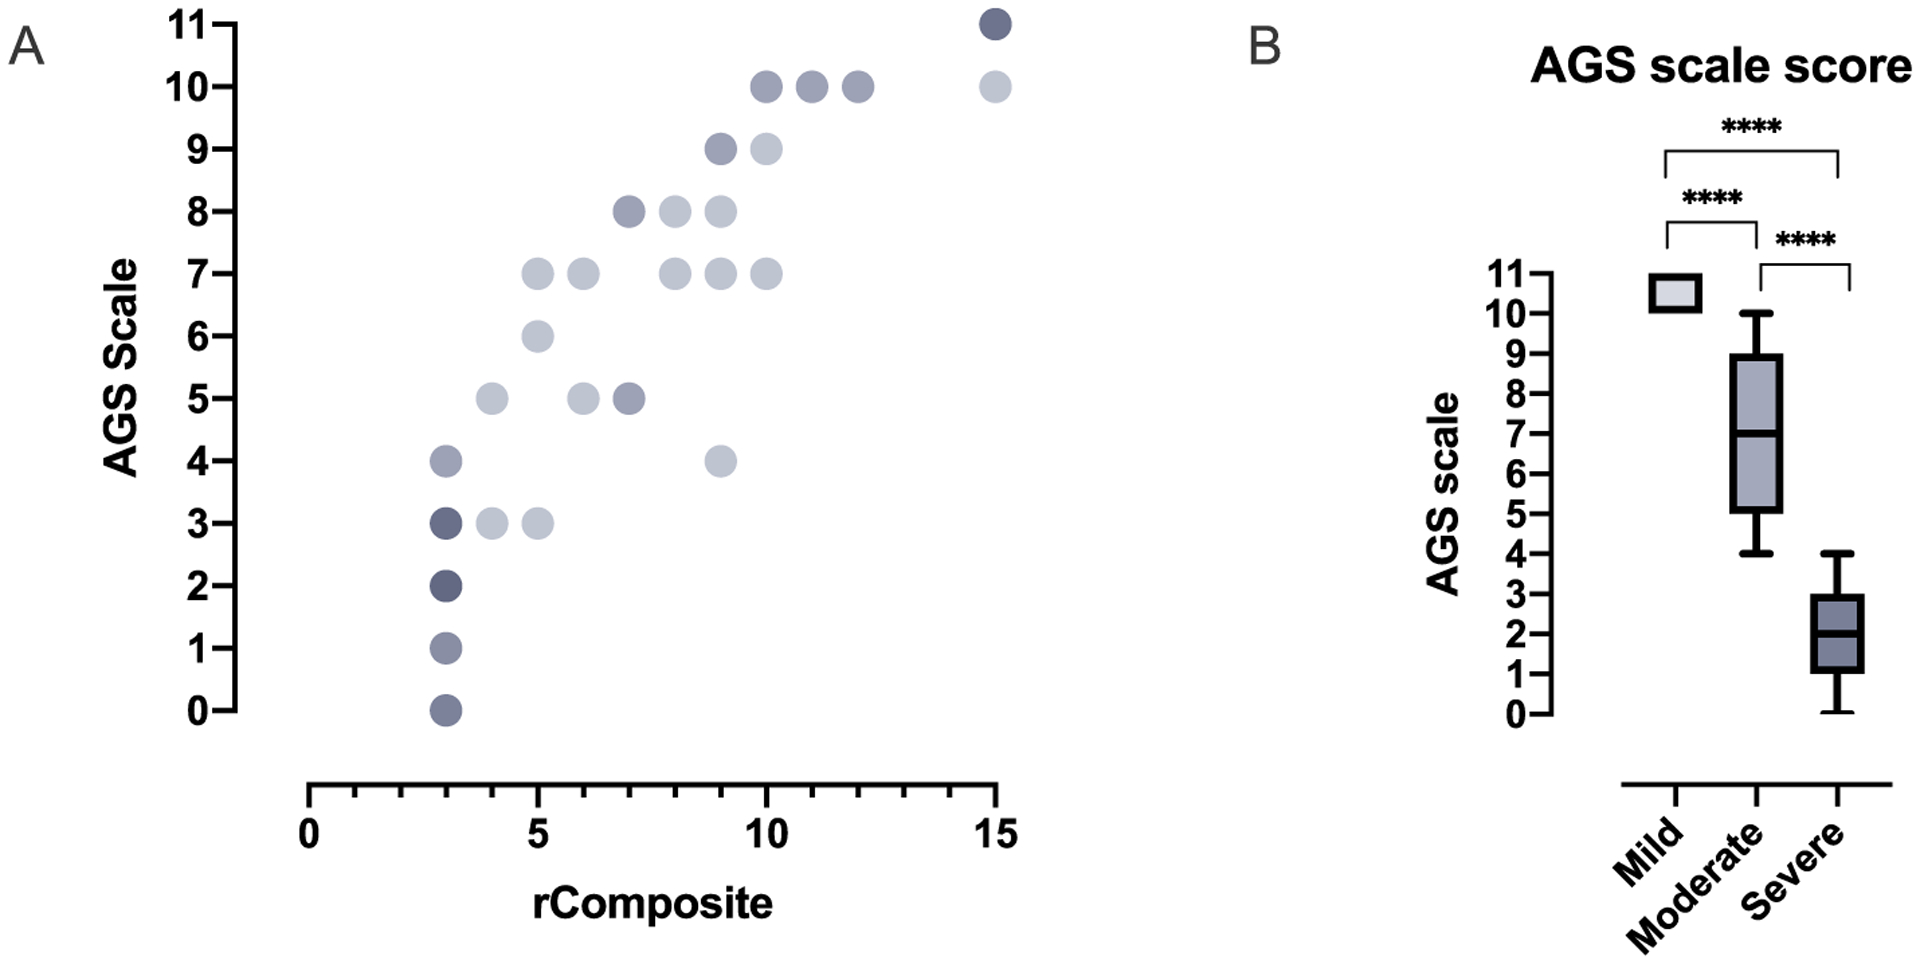
AGS Scale scores correlate with neurologic severity. (A) The AGS scale was compared to disease severity using the rComposite scores (Spearman r 0.9273, 95% confidence interval 0.8795–0.9565, 2 tailed p value < .0001). Overlapping values are indicated by increasing color density. (B) The AGS score was compared to clinical severity assessments: mild (n = 11, mean 10.55 ± 0.52 standard deviation [SD], range 10–11), moderate (n = 23, mean 7.13 ± 1.89 SD, range 4–10), and severe (n = 31, mean 2.00 ± 1.16 SD, range 0–4) (Kruskal-Wallis test p value < .0001 for all comparisons).
The AGS scale was also compared between the clinical categories (n = 65). There was a significant difference between the AGS scale scores between the mild (n = 11, mean 10.55 ± 0.52 standard deviation [SD], range 10–11), moderate (n = 23, mean 7.13 ± 1.89 SD, range 4–10), and severe (n = 31, mean 2.00 ± 1.16 SD, range 0–4) categories (Kruskal-Wallis test p value < .0001) (Fig. 3B).
AGS is a unique genetic disorder as it is caused by pathogenic changes in 7 distinct genes within a common pathway. We sought to correlate the lowest level of neurologic function (the nadir score of the AGS scale) with genotype to explore genotypic differences. This nadir score was compared between the 6 most common genotypes (n = 90) (Fig. 4). We excluded the RNASEH2C, the rarest genotype, from comparative analyses because of small sample size. As previously described [1], each genotype had a heterogeneous distribution of severity. There was a significant difference between the nadir score identified within the cases associated with TREX1 genotypes and the genotypes for SAMHD1, ADAR1, and IFIH1 (Kruskal-Wall test: TREX1 vs SAMHD1 p value 0.0053; TREX1 vs ADAR1 p value 0.0022; TREX1 vs IFIH1 p value 0.0032).
Fig. 4.
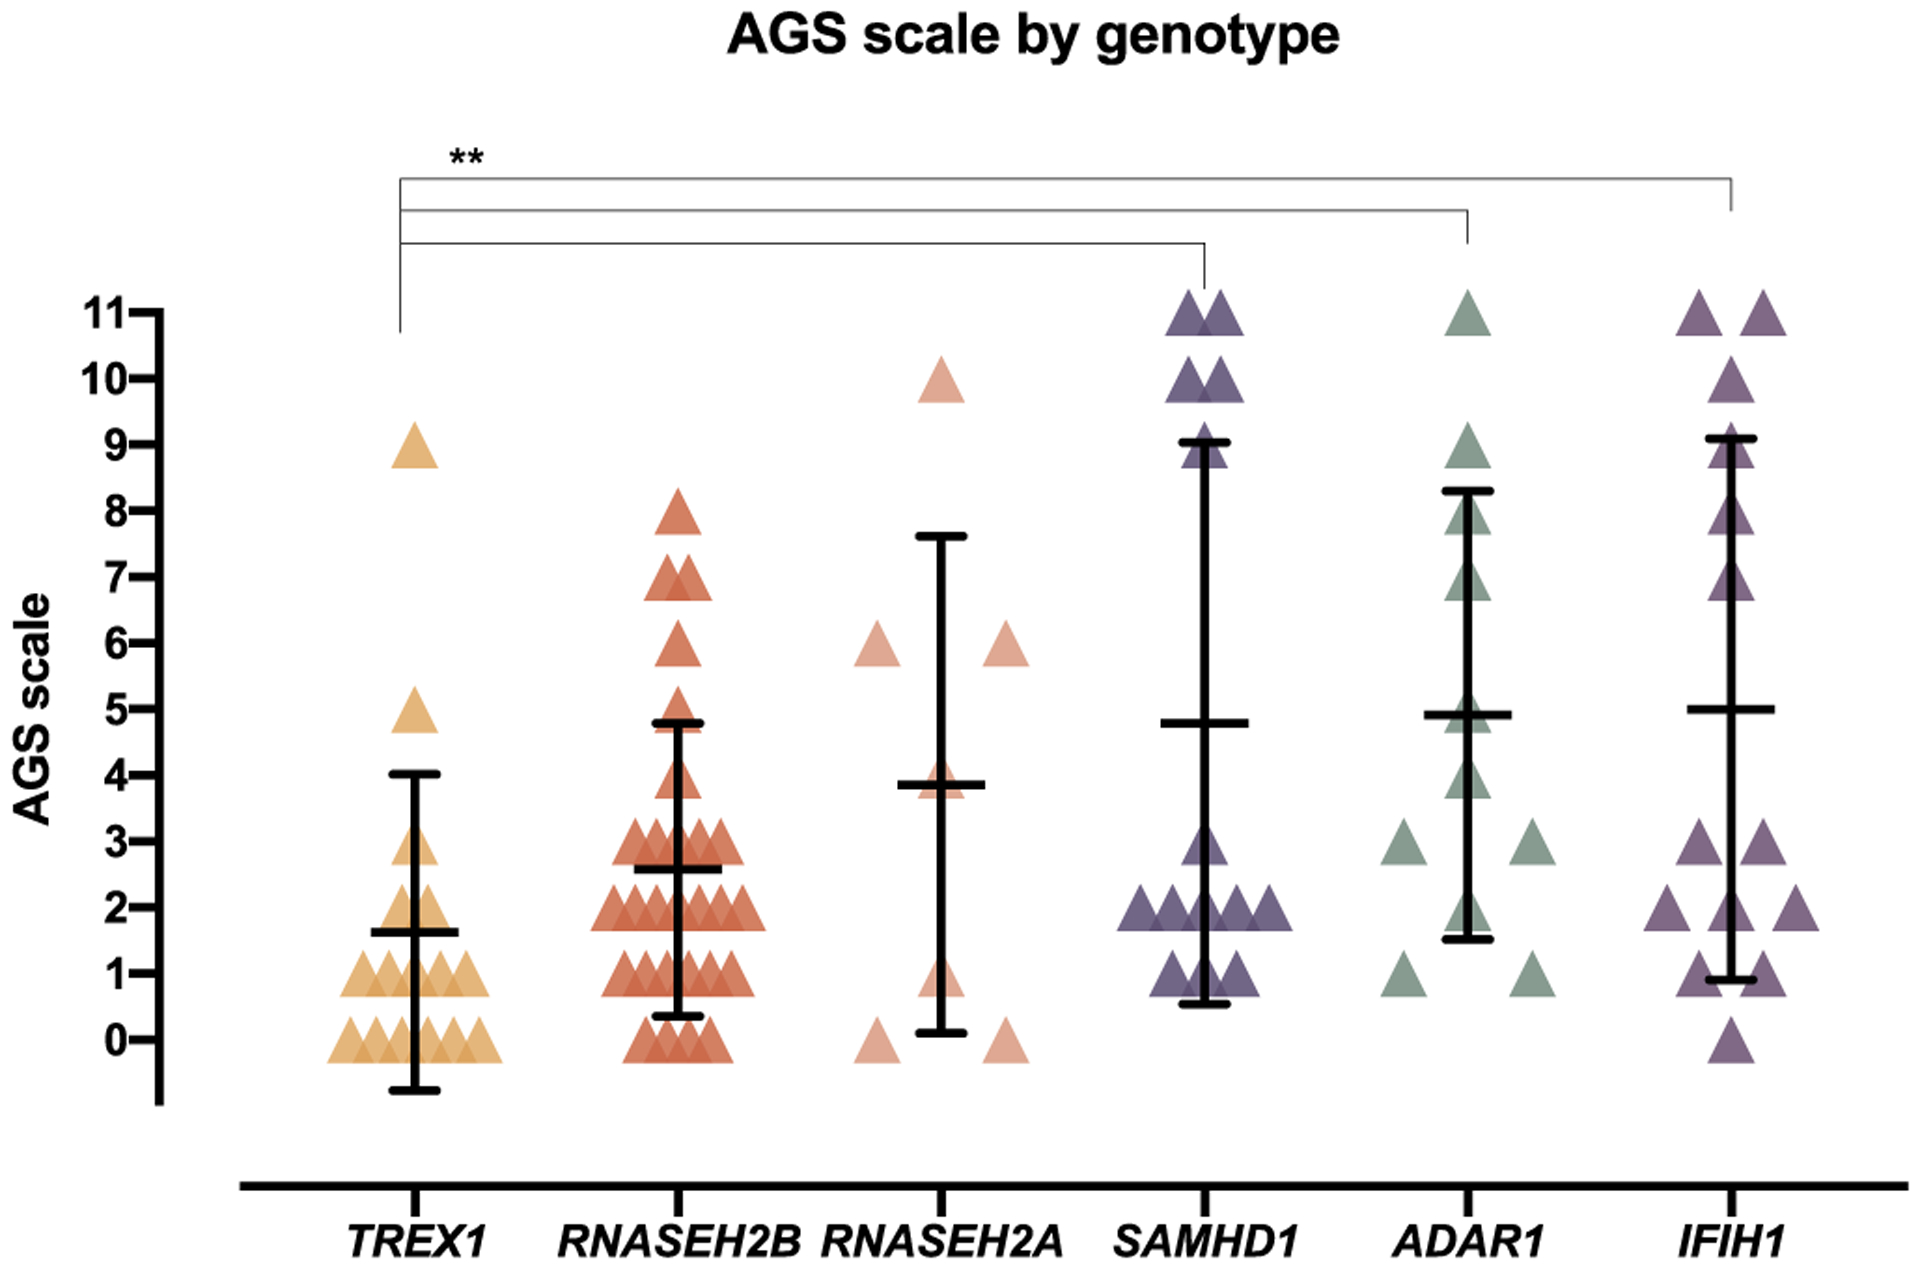
Comparison of the AGS Scale to genotype. The nadir AGS Scale was compared across genotypes (n = 90; mean with SD bars; Kruskal-Wall test: TREX1 vs SAMHD1 p value 0.0053; TREX1 vs ADAR1 p value 0.0022; TREX1 vs IFIH1 p value 0.0032).
Formal testing of gross motor function was available in a subset of individuals (n = 24) (Fig. 5). GMFM-88 is an intensive gross motor test administered by a qualified physical therapist. We compared the GMFM-88 percentiles to our simple AGS scale, noting that the latter also encompasses fine motor and cognitive function as well. There was a significant correlation between the two measures (Spearman r 0.8931, 95% confidence interval 0.76–0.95, 2-tailed p value < .0001).
Fig. 5.
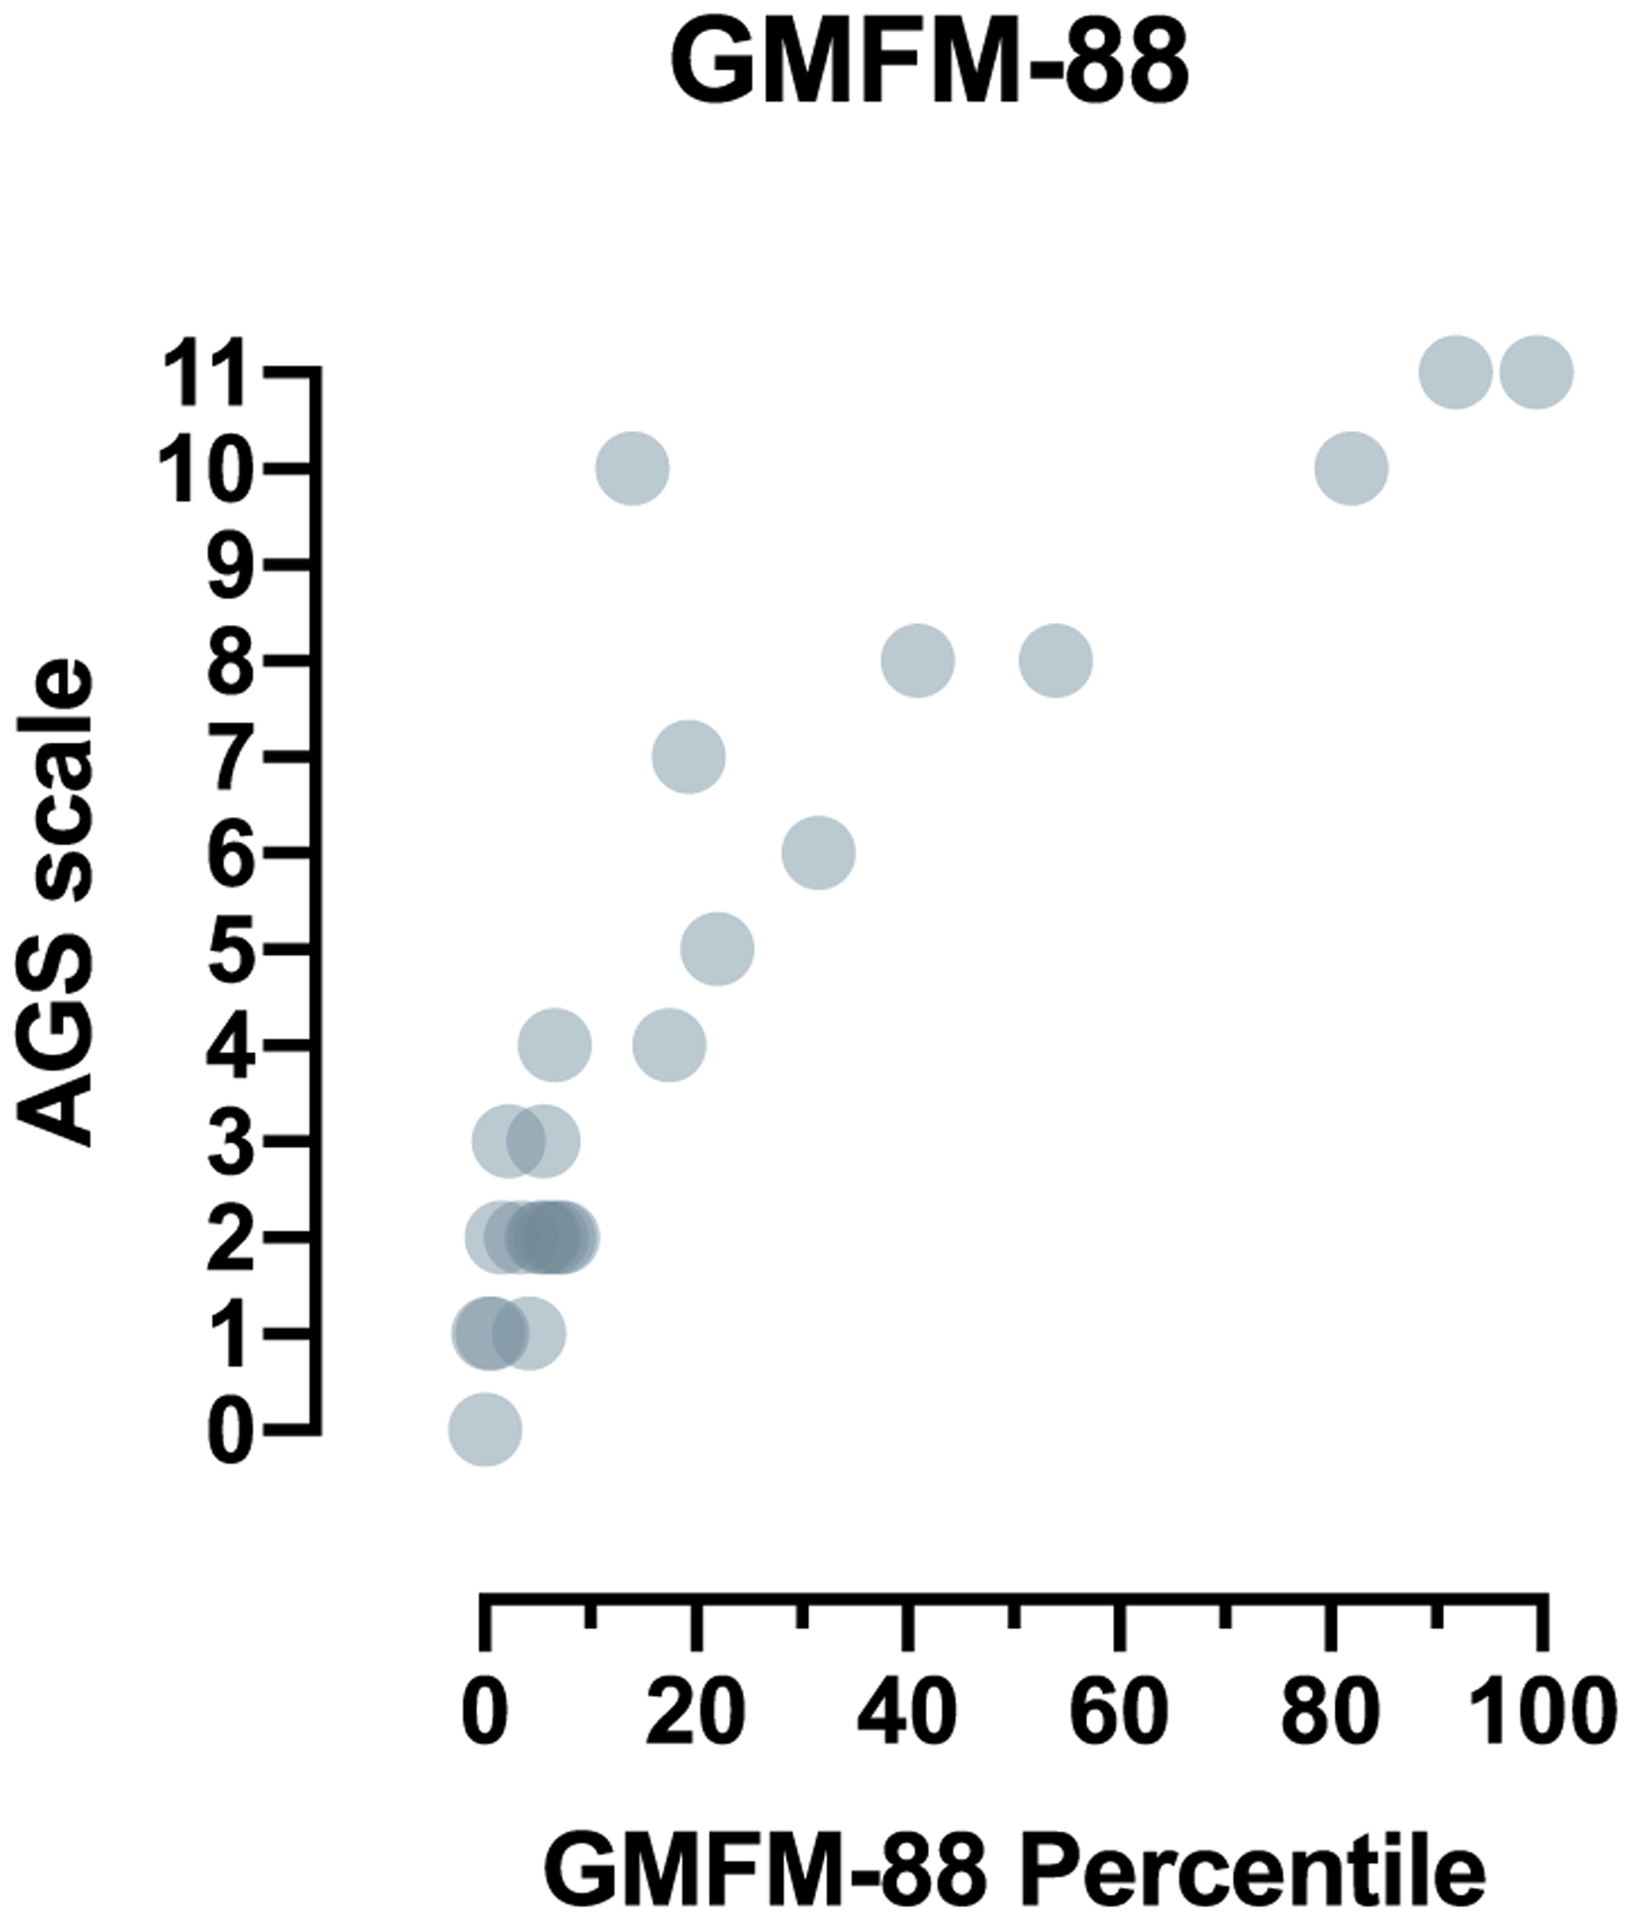
The correlation of the AGS scale to a standardized tool for gross motor function, GMFM-88. Formal testing of gross motor function was available in a subset of individuals (n = 24). The GMFM-88 overall percentile was compared to retrospective assignment of the AGS scale (Spearman r 0.8931, 95% confidence interval 0.76–0.95, 2-tailed p value < .0001).
There is no validated biomarker for AGS disease, although ISG scores are often used a diagnostic biomarker. The relevance of this biomarker to clinical status and outcomes is unknown. To begin to understand the relationship between interferon-related activity and neurologic status, we compared concurrent AGS Scale results to ISG score (n = 36) (Fig. 6). There was no correlation between ISG score and performance by the AGS scale.
Fig. 6.
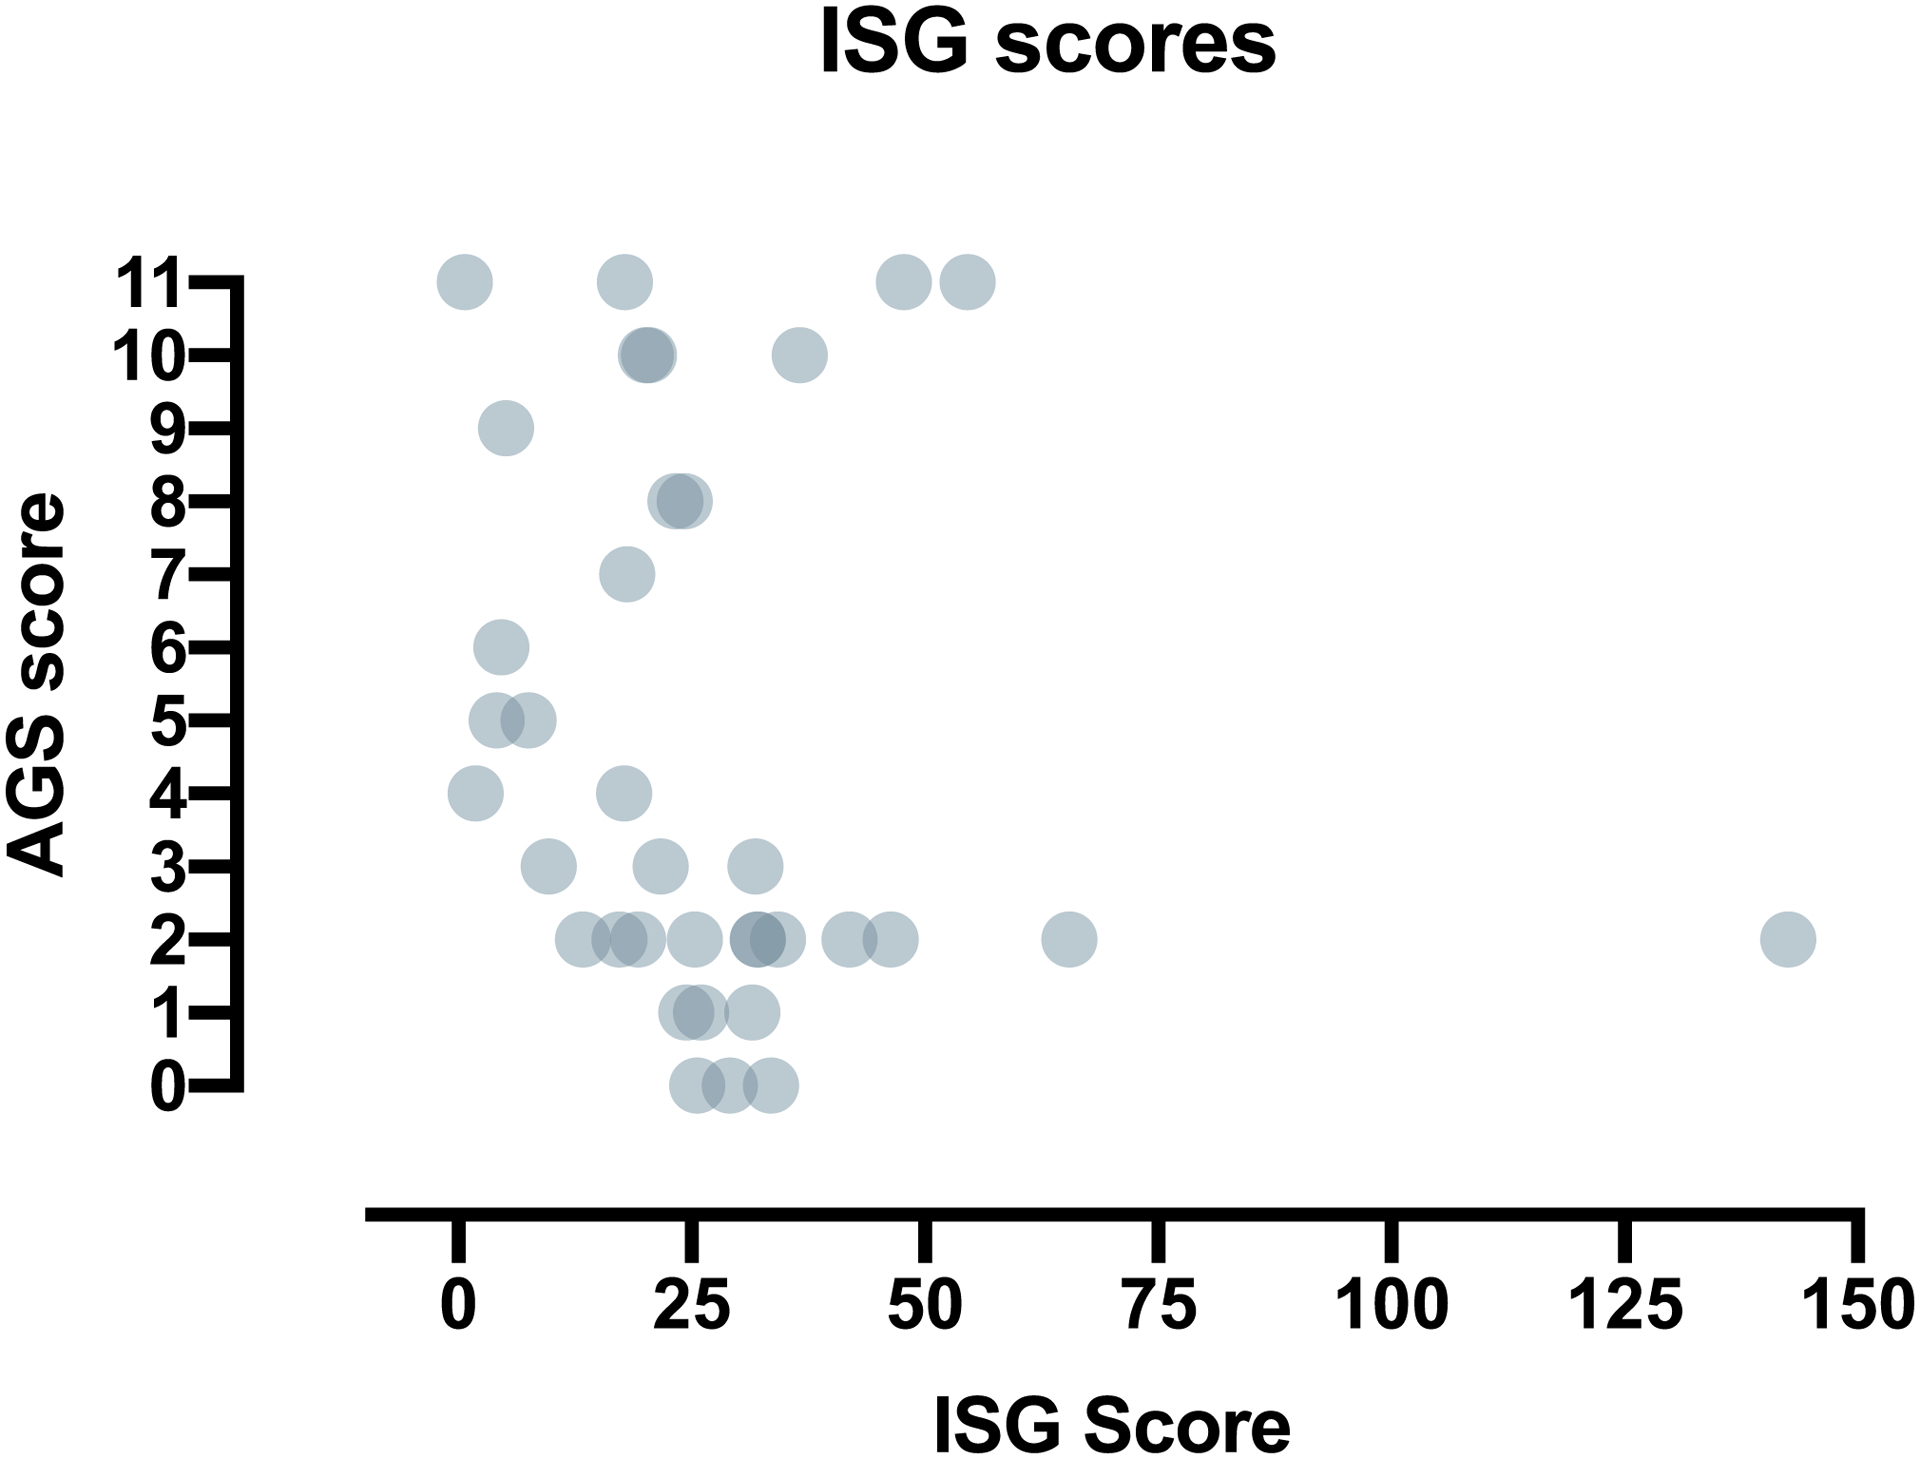
Correlation of the AGS scale to a potential AGS biomarker. The AGS Scale was retrospectively applied to clinical encounters at which ISG measurements were obtained (n = 36). There was no correlation between ISG score and performance by the AGS scale.
3.3. Longitudinal application of the AGS scale
Clinical records were scored at approximately 6-month intervals to assess for longitudinal performance and to evaluate neurologic trajectory over the first 10 years of disease (Fig. 7). The average age at clinical presentation was 8.2 months (range 0–120 months). The average age at the first AGS scale application was 28.1 months (range 0–186 months). The average age at last scale application was 83.0 months (range 2–305 months).
Fig. 7.
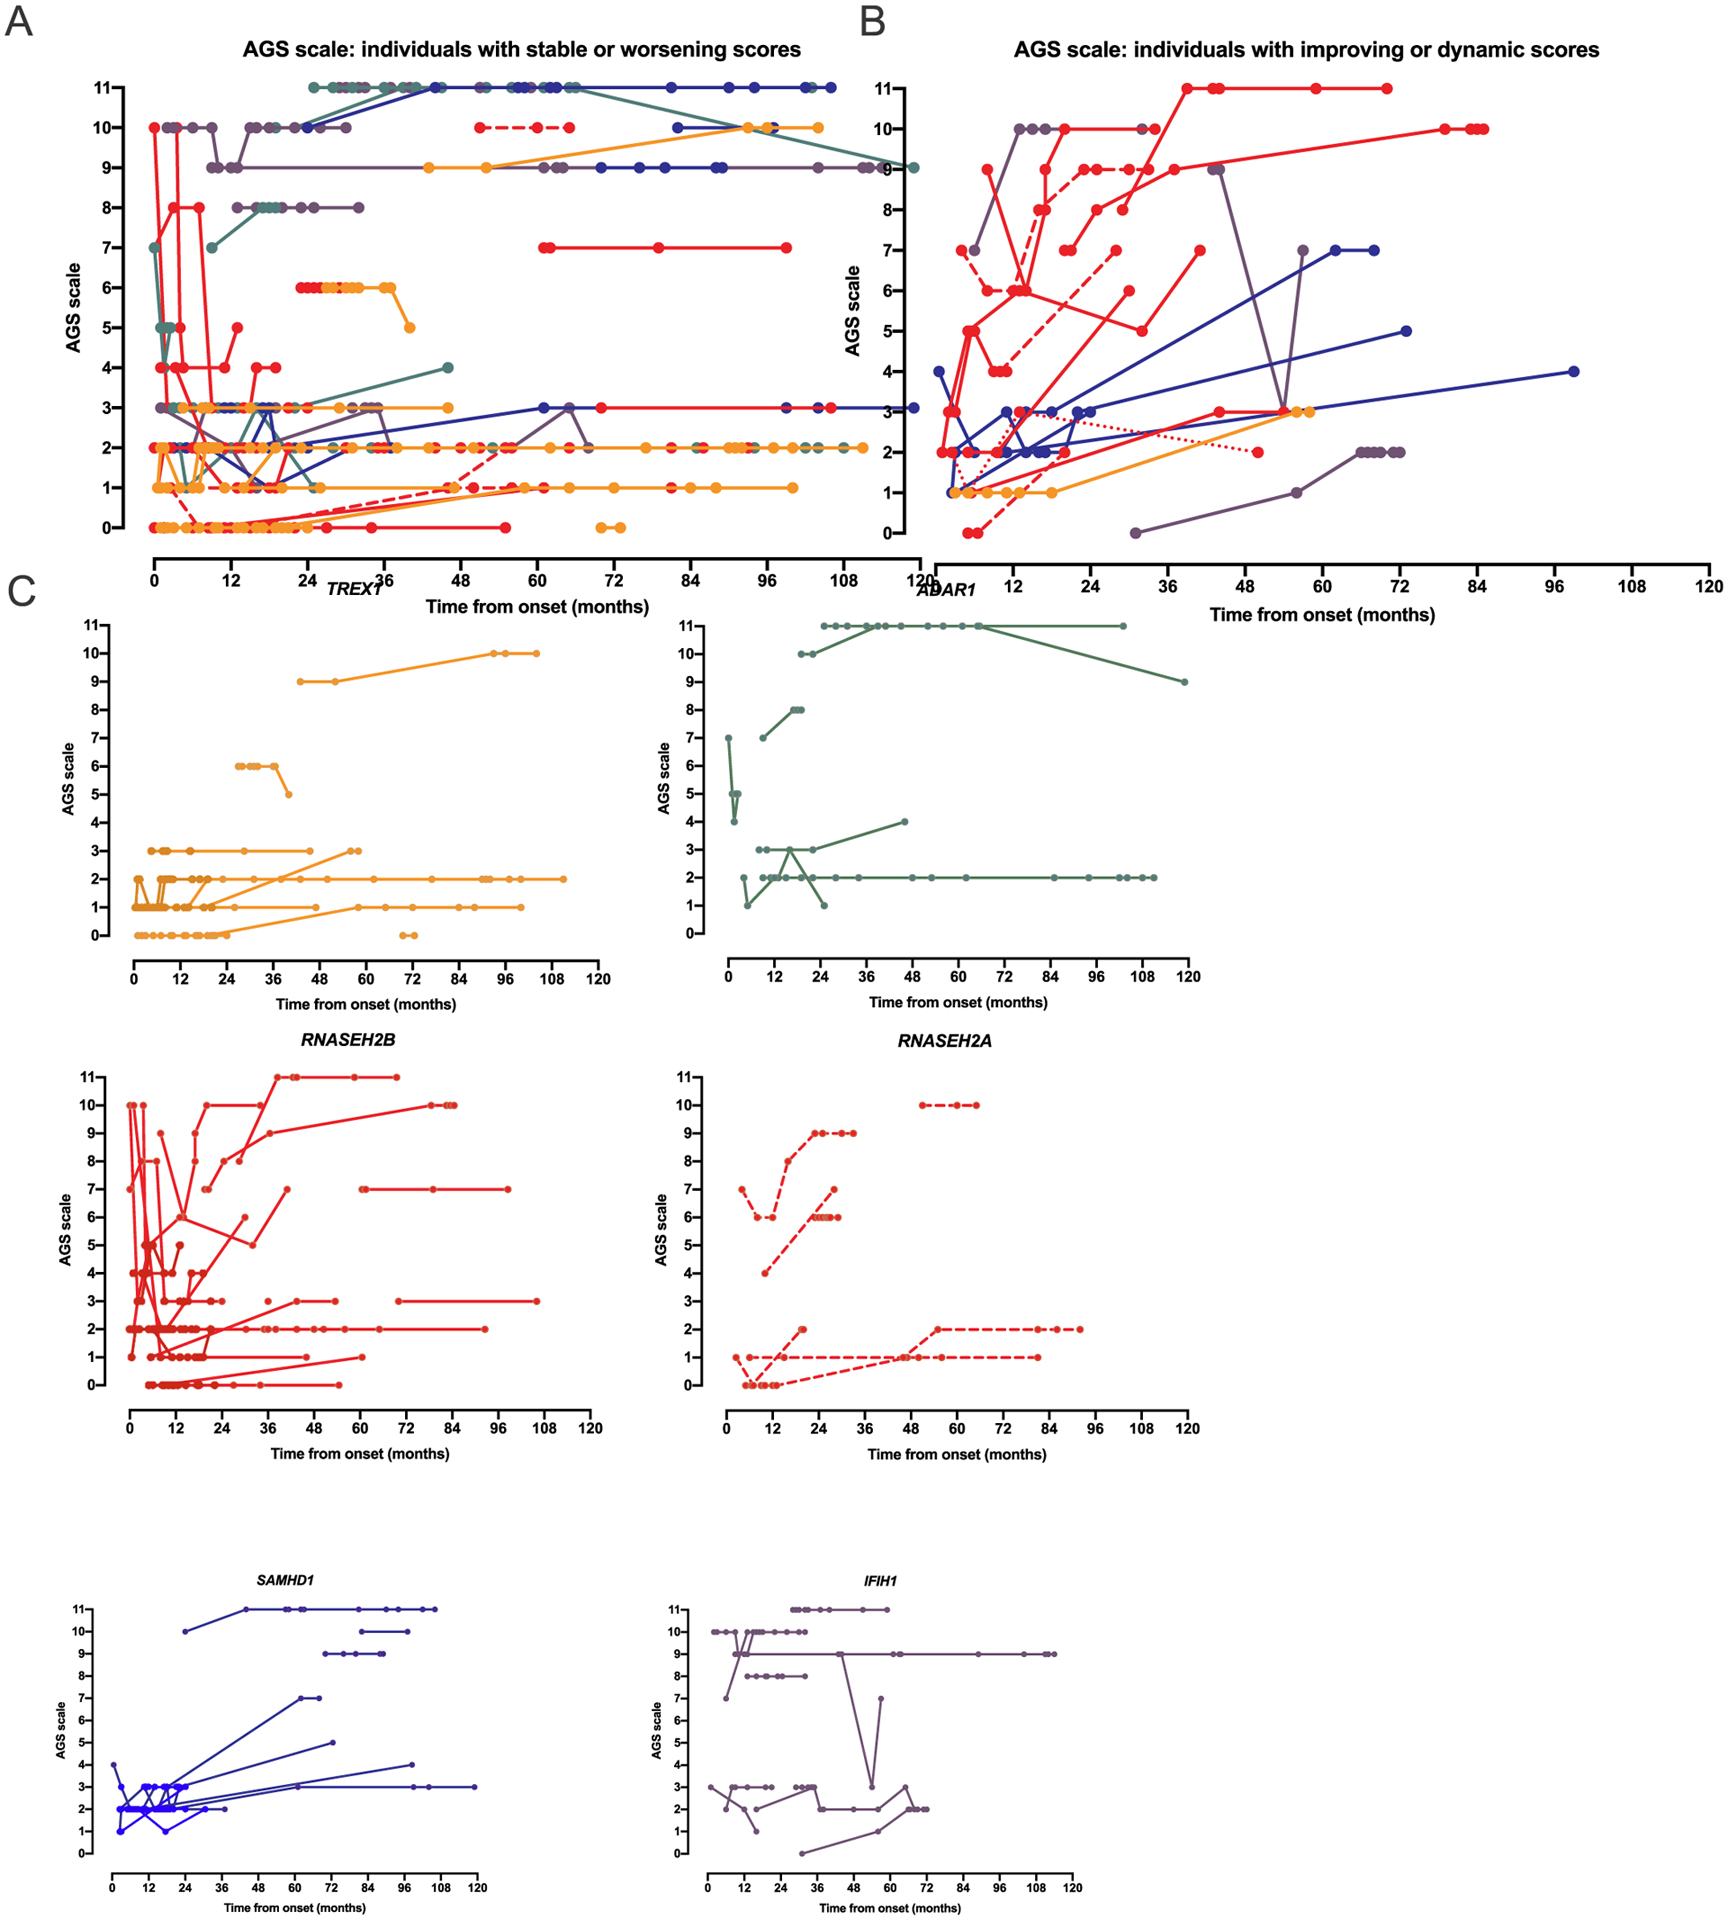
The AGS scale captures longitudinal change in individuals affected by AGS. All plots represent time from disease onset (n = 92). A. The majority of individuals across all genotypes had stable or worsening AGS scale scores (n = 66). B. A subset of individuals had improvement in their AGS scale score (≥ 2 points increase from baseline at any time point) or were dynamic (both increasing and decreasing by ≥2 points). C. Genotype specific plots are provided for the 6 genotypes with more than 2 individuals.
Change in the AGS scale was defined as improvement or decline by 2 or more points over the course of the available medical records. The majority of individuals had stable or declining neurologic function during the period of available medical records (n = 66; Fig. 7A). Neurologic function improved or was dynamic over the course of disease in 19 individuals (Fig. 7B). The longitudinal course by AGS scale by genotype is presented in Fig. 7C for the 6 most common genotypes.
Finally, the absolute change in AGS scores between the first and last evaluations was compared to the duration between symptom onset and first evaluation across the cohort for whom 2 evaluations within the first 10 years were available (n = 80; Fig. 8A). As was previously hypothesized [11], we found that the AGS scale was the most dynamic when the first available encounter was within the first 6 months of disease (Fig. 8B).
Fig. 8.
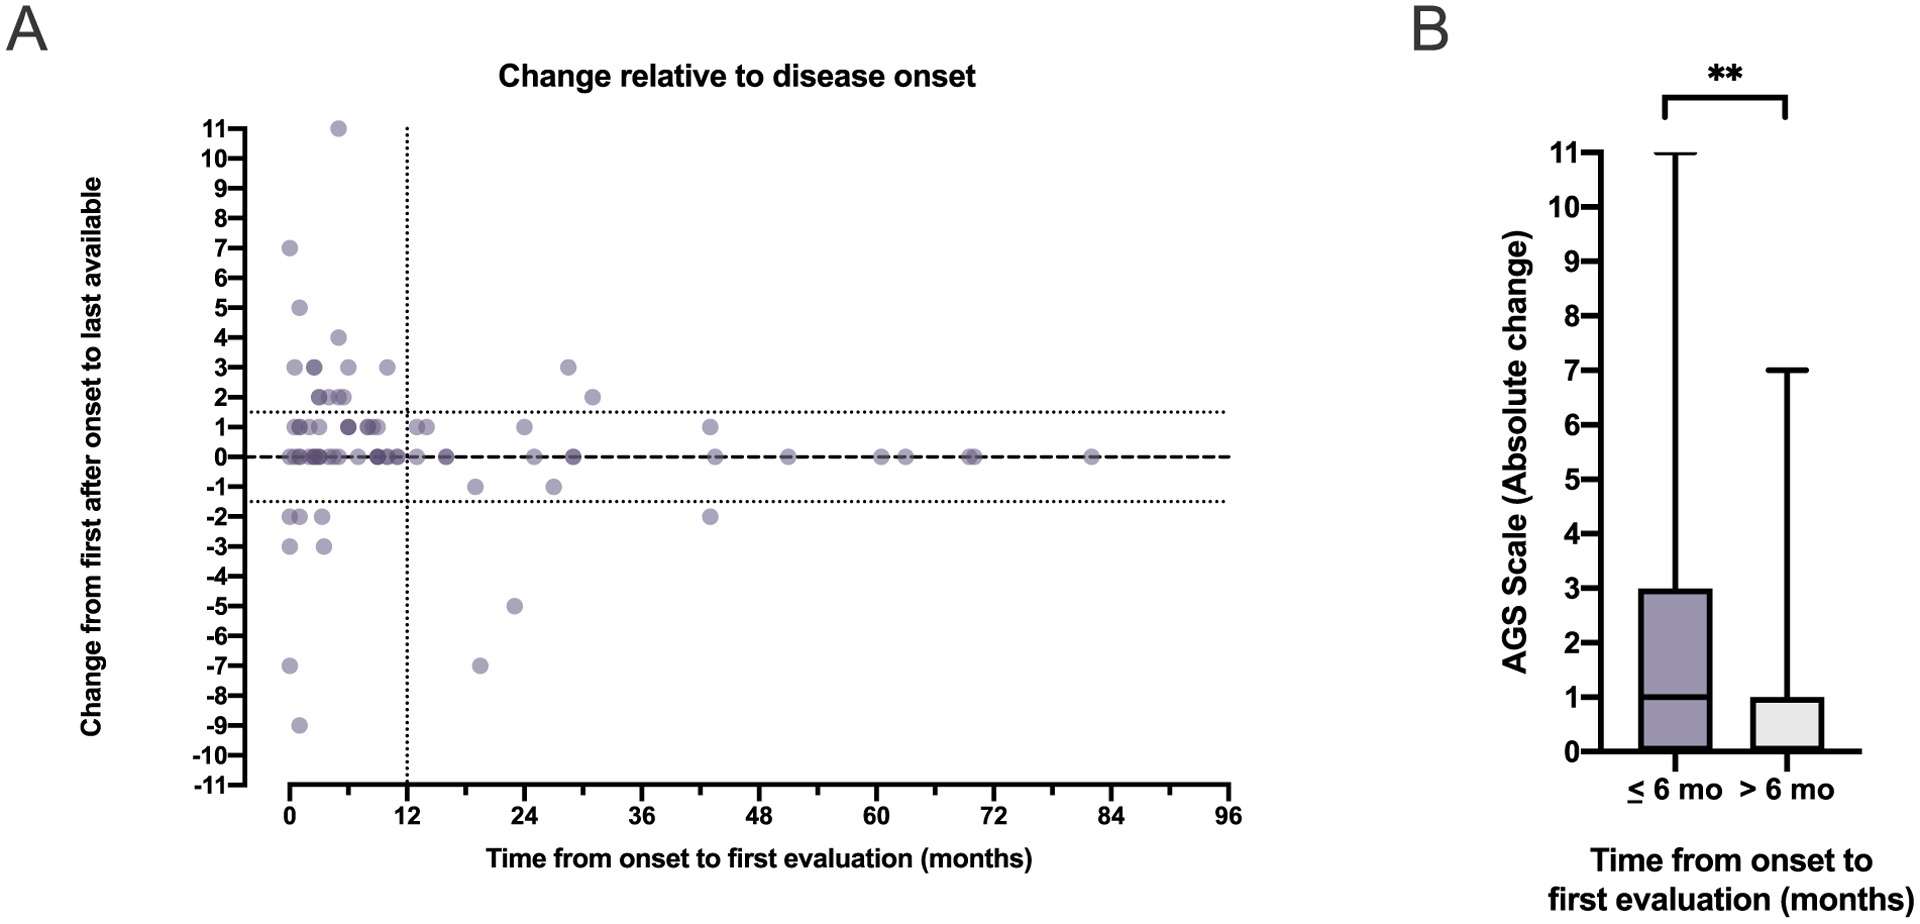
AGS scale change correlates with proximity to disease onset. (A) The change in AGS scale between the first and last evaluations was compared to the duration between symptom onset and first evaluation in the 80 individuals for whom 2 evaluations within the first 10 years of disease were available. (B) Dynamic AGS scores (absolute change between the first and last evaluation) were more likely when the first evaluation occurred within the first 6 months of disease (Mann Whitney, two-tailed p = .0057).
4. Conclusions
Our detailed understanding of the neurologic course of AGS has been limited by the rarity of the disease and the lack of validated assessment tools. Disease-specific measures have been successful in assessing therapeutic benefit in other rare, neurologic disorders [5,10,13–15,19]. Most existing assessment tools are unable to sufficiently evaluate individuals at the lower end of function. In this study, approximately half of the AGS population was severely affected (Fig. 2). To address the need for simple assessment tools for neurologic function in this population, we developed an AGS scale to measure key items relevant to development in AGS abilities. This AGS scale was able to assess neurologic function, had excellent interrater reliability, and correlated with overall severity. Important for a rare disease, this scale could be applied retrospectively as it is dependent on key developmental steps often included in medical encounters. The prospective application of this tool is currently underway.
While AGS affects all domains of development, most existing tools focus on a single area: gross motor, fine motor, or cognitive skills. As such, to measure the full impact of AGS on neurologic function, multiple tools may be required. We hypothesize that future interventions in AGS may result in small, but meaningful improvements, across the modalities. Separate measures may be insensitive to these changes, but a single tool including key neurologic milestones could potentially capture improvements across neurologic domains.
Because gross motor function is impaired in most individuals affected by AGS, we compared performance on the AGS scale to a validated measure of gross motor function, GMFM-88. The AGS Scale and the GMFM-88 demonstrated significant correlation. This underscores the potential utility of the simpler AGS Scale. Of note, half of the values for GMFM-88 were below the 10th percentile, suggestive of a significant floor effect (Fig. 3A).
We also compared the AGS scale to a biomarker of disease, the ISG score. We found no correlation between this diagnostic biomarker and the AGS scale. This finding is supported by other reports that do not correlate ISG scores with severity [2,21]. One confounder of our results is that ISG scores can be dynamic both day-to-day and over the lifetime of a patient. External influences, such as viral infection, would increase the ISG score. Because of these reasons, a single ISG measurement can be difficult to interpret. It is possible that initial ISG scores correlates with severity and the AGS scale.
Given the genetic heterogeneity of AGS, we next characterized performance of the AGS scale across genotypes. In order to minimize the bias from unequal numbers of clinical encounters, we compared nadir AGS scores. We found that individuals with TREX1-related AGS demonstrated the lowest scores, which is consistent with clinical experience.
We were able to map the dynamic neurologic function found in AGS by retrospectively applying the scale to historical clinical encounters. We were able to identify several distinct patterns: those with stable disease, those with recurrent relapses, and those with progressive improvement. Future work is needed to identify variables associated with each trajectory, although we hypothesize that genotype and age at disease onset will be influential in future neurologic recovery. The overall rate of recovery after the periods of regression are unknown, although few children are suspected to return to their full neurologic baseline. Importantly, we found that most improvement occurred in the first 6 months after disease onset. This is an important consideration in clinical trial design, as the expected disease trajectory may be dependent on the time from disease onset. Of note, our data are limited by the availability of detailed and complete medical records, including variable distance from disease onset to first available encounter. Future studies will be designed to assess which variables are associated with neurologic improvement, even in the absence of therapeutic intervention.
As this novel tool provides the first opportunity to easily map neurologic function over time, we wished to characterize the dynamic nature of the disease (Fig. 8). We found the majority of dynamic AGS scores coincided with when the first post-disease onset encounter was within the first 6 months of disease (Fig. 8B). This suggests that after an early dynamic period, there is a trend toward neurologic stability in the majority of patients.
Our novel AGS tool allows for the easy assessment of basic neurologic function in this unique population. This scale correlates with established measures, microcephaly, and genotype. With the longitudinal and prospective application of this instrument, we can begin to characterize the dynamic neurologic function of this rare disease. Moreover, because this scale does not include AGS-specific parameters, this scale holds promise for use across other severe neurologic disorders with dynamic function.
Supplementary Material
Funding
LAA Research reported in this publication was supported by the National Center for Advancing Translational Sciences of the National Institutes of Health under award number KL2TR001879 and the National Institute of Neurological Disorders and Stroke of the National Institutes of Health under Award Number K23NS114113. AV research supported by the Kamens endowed chair for Translational Neurotherapeutics and the Myelin Disorders Bioregistry Project. AV and LA receive research support from 1 U54TR002823-01 (Vanderver) from the NIH/NINDS. The content is solely the responsibility of the authors and does not necessarily represent the official views of the National Institutes of Health.
Footnotes
Appendix A. Supplementary data
Supplementary data to this article can be found online at https://doi.org/10.1016/j.ymgme.2020.03.008.
References
- [1].Adang L, Gavazzi F, De Simone M, Fazzi E, Galli J, Koh J, et al. , Developmental outcomes of Aicardi Goutières Syndrome, J. Child Neurol 35 (1) (2020. January) 7–16, 10.1177/0883073819870944 [Epub 2019 Sep 27]. [DOI] [PMC free article] [PubMed] [Google Scholar]
- [2].Adang LA, Frank DB, Gilani A, Takanohashi A, Ulrick N, Collins A, et al. , Aicardi goutieres syndrome is associated with pulmonary hypertension, Mol. Genet. Metab (2018), 10.1016/j.ymgme.2018.09.004. [DOI] [PMC free article] [PubMed] [Google Scholar]
- [3].Alotaibi M, Long T, Kennedy E, Bavishi S, The efficacy of GMFM-88 and GMFM-66 to detect changes in gross motor function in children with cerebral palsy (CP): a literature review, Disabil. Rehabil 36 (8) (2014) 617–627, 10.3109/09638288.2013.805820. [DOI] [PubMed] [Google Scholar]
- [4].Armangue T, Orsini JJ, Takanohashi A, Gavazzi F, Conant A, Ulrick N, et al. , Neonatal detection of Aicardi Goutieres Syndrome by increased C26:0 lysopho-sphatidylcholine and interferon signature on newborn screening blood spots, Mol. Genet. Metab (2017), 10.1016/j.ymgme.2017.07.006. [DOI] [PMC free article] [PubMed] [Google Scholar]
- [5].Augustine EF, Adams HR, Mink JW, Clinical trials in rare disease: challenges and opportunities, J. Child Neurol 28 (9) (2013) 1142–1150, 10.1177/0883073813495959. [DOI] [PMC free article] [PubMed] [Google Scholar]
- [6].Boateng GO, Neilands TB, Frongillo EA, Melgar-Quinonez HR, Young SL, Best practices for developing and validating scales for health, social, and behavioral research: a primer, Front. Public Health 6 (2018) 149, 10.3389/fpubh.2018.00149. [DOI] [PMC free article] [PubMed] [Google Scholar]
- [7].Crow YJ, Aicardi-Goutieres syndrome, Handb. Clin. Neurol 113 (2013) 1629–1635, 10.1016/b978-0-444-59565-2.00031-9. [DOI] [PubMed] [Google Scholar]
- [8].Crow YJ, Chase DS, Lowenstein Schmidt J, Szynkiewicz M, Forte GM, Gornall HL, et al. , Characterization of human disease phenotypes associated with mutations in TREX1, RNASEH2A, RNASEH2B, RNASEH2C, SAMHD1, ADAR, and IFIH1, Am J Med Genet A 167a (2) (2015) 296–312, 10.1002/ajmg.a.36887. [DOI] [PMC free article] [PubMed] [Google Scholar]
- [9].Eliasson AC, Krumlinde-Sundholm L, Rosblad B, Beckung E, Arner M, Ohrvall AM, Rosenbaum P, The Manual Ability Classification System (MACS) for children with cerebral palsy: scale development and evidence of validity and reliability, Dev. Med. Child Neurol 48 (7) (2006) 549–554, 10.1017/s0012162206001162. [DOI] [PubMed] [Google Scholar]
- [10].Finkel RS, Mercuri E, Darras BT, Connolly AM, Kuntz NL, Kirschner J, et al. , Nusinersen versus sham control in infantile-onset spinal muscular atrophy, N. Engl. J. Med 377 (18) (2017) 1723–1732, 10.1056/NEJMoa1702752. [DOI] [PubMed] [Google Scholar]
- [11].Livingston JH, Crow YJ, Neurologic phenotypes associated with mutations in TREX1, RNASEH2A, RNASEH2B, RNASEH2C, SAMHD1, ADAR1, and IFIH1: Aicardi-Goutieres Syndrome and beyond, Neuropediatrics 47 (6) (2016) 355–360, 10.1055/s-0036-1592307. [DOI] [PubMed] [Google Scholar]
- [12].Lundkvist Josenby A, Jarnlo GB, Gummesson C, Nordmark E, Longitudinal construct validity of the GMFM-88 total score and goal total score and the GMFM-66 score in a 5-year follow-up study, Phys. Ther 89 (4) (2009) 342–350, 10.2522/ptj.20080037. [DOI] [PubMed] [Google Scholar]
- [13].Marshall FJ, de Blieck EA, Mink JW, Dure L, Adams H, Messing S, et al. , A clinical rating scale for batten disease: reliable and relevant for clinical trials, Neurology 65 (2) (2005) 275–279, 10.1212/01.wnl.0000169019.41332.8a. [DOI] [PubMed] [Google Scholar]
- [14].Mercuri E, Darras BT, Chiriboga CA, Day JW, Campbell C, Connolly AM, et al. , Nusinersen versus sham control in later-onset spinal muscular atrophy, N. Engl. J. Med 378 (7) (2018) 625–635, 10.1056/NEJMoa1710504. [DOI] [PubMed] [Google Scholar]
- [15].Montes J, Glanzman AM, Mazzone ES, Martens WB, Dunaway S, Pasternak A, et al. , Spinal muscular atrophy functional composite score: a functional measure in spinal muscular atrophy, Muscle Nerve 52 (6) (2015) 942–947, 10.1002/mus.24670. [DOI] [PubMed] [Google Scholar]
- [16].Palisano RJ, Avery L, Gorter JW, Galuppi B, McCoy SW, Stability of the gross motor function classification system, manual ability classification system, and communication function classification system, Dev. Med. Child Neurol 60 (10) (2018) 1026–1032, 10.1111/dmcn.13903. [DOI] [PubMed] [Google Scholar]
- [17].Passemard S, Kaindl AM, Verloes A, Microcephaly, Handb. Clin. Neurol 111 (2013) 129–141, 10.1016/b978-0-444-52891-9.00013-0. [DOI] [PubMed] [Google Scholar]
- [18].Paulson A, Vargus-Adams J, Overview of four functional classification systems commonly used in cerebral palsy, Children (Basel) 4 (4) (2017), 10.3390/children4040030. [DOI] [PMC free article] [PubMed] [Google Scholar]
- [19].Ramsey D, Scoto M, Mayhew A, Main M, Mazzone ES, Montes J, et al. , Revised Hammersmith scale for spinal muscular atrophy: a SMA specific clinical outcome assessment tool, PLoS One 12 (2) (2017) e0172346,, 10.1371/journal.pone.0172346. [DOI] [PMC free article] [PubMed] [Google Scholar]
- [20].Rice GI, Bond J, Asipu A, Brunette RL, Manfield IW, Carr IM, et al. , Mutations involved in Aicardi-Goutieres syndrome implicate SAMHD1 as regulator of the innate immune response, Nat. Genet 41 (7) (2009) 829–832, 10.1038/ng.373. [DOI] [PMC free article] [PubMed] [Google Scholar]
- [21].Rice GI, Park S, Gavazzi F, Adang LA, Ayuk LA, Van Eyck L, et al. , Genetic and phenotypic spectrum associated with IFIH1 gain-of-function, Hum. Mutat 41 (4) (2020) 837–849, 10.1002/humu.23975. [DOI] [PMC free article] [PubMed] [Google Scholar]
- [22].Wood E, Rosenbaum P, The gross motor function classification system for cerebral palsy: a study of reliability and stability over time, Dev. Med. Child Neurol 42 (5) (2000) 292–296. [DOI] [PubMed] [Google Scholar]
Associated Data
This section collects any data citations, data availability statements, or supplementary materials included in this article.


