Summary
T regulatory type 1 (Tr1) cells are a class of regulatory T cells (Tregs) participating in peripheral tolerance, hence the rationale behind their testing in clinical trials in different disease settings. One of their applications is tolerance induction to allogeneic islets for long‐term diabetes‐free survival. Currently the cellular and molecular mechanisms that promote Tr1‐cell induction in vivo remain poorly understood. We employed a mouse model of transplant tolerance where treatment with granulocyte colony‐stimulating factor (G‐CSF)/rapamycin induces permanent engraftment of allogeneic pancreatic islets in C57BL/6 mice via Tr1 cells. The innate composition of graft and spleen cells in tolerant mice was analyzed by flow cytometry. Graft phagocytic cells were co‐cultured with CD4+ T cells in vitro to test their ability to induce Tr1‐cell induction. Graft phagocytic cells were depleted in vivo at different time‐points during G‐CSF/rapamycin treatment, to identify their role in Tr1‐cell induction and consequently in graft survival. In the spleen, the site of Tr1‐cell induction, no differences in the frequencies of macrophages or dendritic cells (DC) were observed. In the graft, the site of antigen uptake, a high proportion of macrophages and not DC was detected in tolerant but not in rejecting mice. Graft‐infiltrating macrophages of G‐CSF/rapamycin‐treated mice had an M2 phenotype, characterized by higher CD206 expression and interleukin (IL)‐10 production, whereas splenic macrophages only had an increased CD206 expression. Graft‐infiltrating cells from G‐CSF/rapamycin‐treated mice‐induced Tr1‐cell expansion in vitro. Furthermore, Tr1‐cell induction was perturbed upon in‐vivo depletion of phagocytic cells, early and not late during treatment, leading to graft loss suggesting that macrophages play a key role in tolerance induction mediated by Tr1 cells. Taken together, in this mouse model of Tr1‐cell induced tolerance to allogeneic islets, M2 macrophages infiltrating the graft upon G‐CSF/rapamycin treatment are key for Tr1‐cell induction. This work provides mechanistic insight into pharmacologically induced Tr1‐cell expansion in vivo in this stringent model of allogeneic transplantation.
Keywords: macrophage, regulatory T cells, tolerance, transplantation
A mechanism of Tr1‐cell induction was investigated using a mouse model of transplant tolerance where treatment with G‐CSF/rapamycin induces permanent engraftment of allogeneic pancreatic islets via Tr1 cells. Early graft‐infiltrating cells are IL10‐producing M2 macrophages, and are capable of inducing Tr1‐cell expansion in vitro. Depletion via clodronate liposomes leads to a halt in Tr1‐cell induction consequently loss of graft function suggesting an essential role for these early graft‐infiltrating macrophages in tolerance induction via Tr1cells.

Introduction
T regulatory type 1 (Tr1) cells are a subset of CD4+ T cells that induce immune tolerance. They were first discovered in two severe combined immunodeficiency (SCID) patients exhibiting mixed chimerism after successful treatment with human leukocyte antigen (HLA)‐mismatched fetal liver hematopoietic progenitor cell transplantation [1, 2]. Tr1 cells were detected in the peripheral blood of healthy donors and were correlated with better glucose control in type 1 diabetic (T1D) patients, if detected at disease onset [3]. Additionally, the absence or lack of induction of Tr1 cells has been associated with disease progression in autoimmune conditions (T1D, psoriasis, multiple sclerosis and celiac disease) and allergic diseases, while their presence in HIV/HCV infections or different tumor conditions has been associated with disease progression (reviewed in [4]).
Upon activation of their T cell receptor (TCR) by the cognate antigen, Tr1 cells mediate direct suppression of effector T cells and bystander suppression of professional antigen‐presenting cells (APC), mainly by secretion of interleukin (IL)‐10, granzyme B and transforming growth factor (TGF)‐β [5]. Their ability to confer immune tolerance lies behind the rationale for their ex‐vivo expansion and administration in clinical trials of different disease settings: control of autoimmunity, control of graft‐versus‐host disease (GVHD) or prevention of graft rejection in solid organ transplantation [6, 7].
Tr1 cells can be generated in vitro from naive CD4+ T cells by repetitive TCR stimulation in the presence of high doses of IL‐10 [8, 9]. Early studies have shown that IL‐10‐producing dendritic cells (DC) promote Tr1 cell development in vivo [10]. Later, IL‐10 was shown not to play a crucial role in vivo, while DC‐derived IL‐27 induced Tr1‐cell generation, with TGF‐β amplifying this process [11, 12]. IL‐27 produced by conventional dendritic cells (DC) [13, 14] and T‐bet and donor‐macrophage‐derived IL‐27 [15] have also been reported in different mouse models of inflammation. Hence, mechanisms of Tr1‐cell induction in vivo (cells and cytokine environment) remain heterogeneous and not well understood. Although IL‐10 and/or IL‐27 can induce Tr1 cells in vivo, the same suppressive properties of these cytokines prevent Tr1 cells from proliferating. This may suggest that other factors and cells might be required for the differentiation and expansion of Tr1 cells.
We have previously established a murine model of streptozotocin (STZ)‐induced diabetes whereby allogeneic islet transplantation was tolerated upon treatment with granulocyte colony‐stimulating factor (G‐CSF)/rapamycin. Long‐term tolerance was associated with increased Tr1 cell generation, detected at the time using their cytokine secretion profile CD4+IL‐10+IL4− T cells [16, 17].
With surface marker LAG‐3 identifying putative Tr1 cells [18, 19], we confirmed our previous findings and reported on their ability to transfer and maintain tolerance in an antigen‐specific manner [20]. While we reported splenic Tr1 cells mediating peripheral tolerance, Yu et al. described Tr1‐cell migration from the gut to the site of inflammation, the pancreatic islets of diabetic mice, to manifest tolerance [21]. Therefore, the site of conferring tolerance (site of inflammation or lymphoid tissue) adds another layer of complexity.
In this study, we investigate using our stringent mouse model of islet transplantation: which phagocytic cells are mobilized during Tr1‐promoting G‐CSF/rapamycin treatment, their phenotype and the mechanisms by which they induce Tr1 cells responsible for graft survival.
Methods
Mice
BALB/c and C57BL/6 mice were purchased from Charles River (Calco, Italy). Blood glucose levels were monitored twice per week with a monitoring system (OneTouch Ultra; LifeScan, Milpitas, CA, USA). Diabetes onset and graft rejection were defined as blood glucose values above 250 mg/dL on 2 consecutive days. All animals were housed under specific pathogen‐free conditions in compliance with the guidelines of the San Raffaele Institutional Animal Care and Use Committee (Protocol no. 860).
Islet transplant and in‐vivo treatments
Pancreatic islets from BALB/c donors were transplanted under the kidney capsule of STZ‐induced diabetic recipient mice (C57BL/6), as previously described [16]. G‐CSF [Myelostim, recombinant human (rHu)G‐CSF; Italfarmaco, Milan, Italy] was diluted in phosphate‐buffered saline (PBS) and injected subcutaneously (s.c.) for 30 consecutive days at 200 mg/kg from the day of transplant. Rapamycin (Rapamune; Wyeth Europe, Taplow, UK) was diluted in water and administered by gavage for 30 consecutive days once a day at 1 mg/kg. Clodronate liposomes were purchased from clodronateliposomes.org (Vrije Universiteit, Amsterdam, the Netherlands), reconstituted in PBS at the concentration of 1 mg/ml and injected intraperitoneally (i.p.) at 10 mg/kg three times at 3‐day intervals.
Flow cytometry for surface staining
Antibodies to CD45 (clone 30F11, dilution 1/100), IA(b) (clone AF6‐120.1, 1/100), CD11b (clone M1/70, 1/100) and CD223/LAG3 (clone c9b7w, 1/50) were obtained from BD Pharmingen (San Diego, CA, USA), antibody to F4/80 (clone CI:A3‐1, 1/200) from Bio‐Rad Laboratories (Hercules, CA, USA), antibody to CD11c (clone N418, 1/100) from eBiosciences (San Diego, CA, USA) and antibody to CD4 (clone RM4‐5, 1/1000) from Miltenyi Biotec (Bergisch‐Gladbach, Germany). All antibodies were titrated before use. A 2.4G2 (Fc) blocking step preceded surface staining. Cell acquisition was performed on a fluorescence‐activated cell sorter (FACS) Canto II cytometer (Beckman Coulter, Brea, CA, USA) and analysis was performed using FCS Express version 4.0 (De Novo Software, Glendale, CA, USA).
Intracellular cytokine staining
Graft‐infiltrating cells and splenocytes were harvested and cultured unstimulated with 3 μg/ml brefeldin and 2 μM monensin A for 4 h, after which surface staining for macrophages was performed (preceded by FcBlock) with antibody to CD206 (clone C068C2, 1/100) from Biolegend. Permeabilization (BD Biosciences) was followed by intracellular staining for IL‐10 (clone JES5‐16E3, 1/50 from Biolegend) with fluorescence minus one (FMO) and acquisition performed on a FACS Canto II cytometer.
Co‐culture
Graft‐infiltrating cells were harvested and pooled by group of mice (G‐CSF/rapamycin treatment or untreated). In parallel, splenocytes of naive CD45.1 C57BL/6 mice were harvested and the red blood cells (RBC) were lysed. This was followed by a CD4+ T cell enrichment step using the EasySep Mouse immunomagnetic selection kit (StemCell Technologies, Vancouver, Canada), which employs a negative selection cocktail of antibodies against CD11b, CD19, CD45R, CD49b and TER119. Co‐culture was performed at a 1 : 1 ratio in 96‐well round‐bottomed wells for 7 days, with flow cytometry performed at days 5 and 7 for Tr1 cells, gating on CD45.1+ cells.
Statistical analysis
All statistical analyses were performed using GraphPad Prism version 5 software (GraphPad Software, La Jolla, CA, USA). Graft survival curves were plotted using the Kaplan–Meier method. Comparisons between groups were performed using the Mann–Whitney test.
Results
Macrophages infiltrate the grafts of tolerant mice
Tr1 cells accumulate in the spleens of tolerant mice in a model of allogeneic islet transplantation to treat diabetes [16] and in a mouse model of inflammatory bowel disease [19]. To dissect the cells key in the in‐vivo Tr1‐cell induction, we looked at APC change after transplantation and during a Tr1‐cell‐inducing treatment. Macrophages and DC are the two major known phagocytic APC subsets in inflammatory environments that dynamically interact to establish the balance between immune activation and tolerance [22, 23, 24]. Furthermore, they mature into tolerogenic cells in response to rapamycin and/or granulocyte–macrophage colony‐stimulating factor (GM‐CSF) [25, 26]. Splenocytes of transplanted treated and untreated mice were analyzed by flow cytometry to determine APC content. The frequency of macrophages and DC was not different between treated and untreated mice immediately following the transplant and during the 30 days of G‐CSF/rapamycin treatment (Fig. 1a,b). Islets are transplanted under the kidney capsule, the tissue where APC are likely to uptake antigens and transport them to secondary lymphoid tissues [27, 28]. Islet allografts were therefore also analyzed. Macrophages infiltrated the graft as early as 5 days after transplant and were significantly more frequent (P = 0·0021) in the graft of G‐CSF/rapamycin‐treated animals compared to that of control rejecting mice (Fig. 1c). This graft infiltration gradually decreased to reach the same levels as control mice at day 30. Conversely, DC infiltrating the grafts were not different in G‐CSF/rapamycin‐treated compared to untreated mice (Fig. 1c).
Fig. 1.
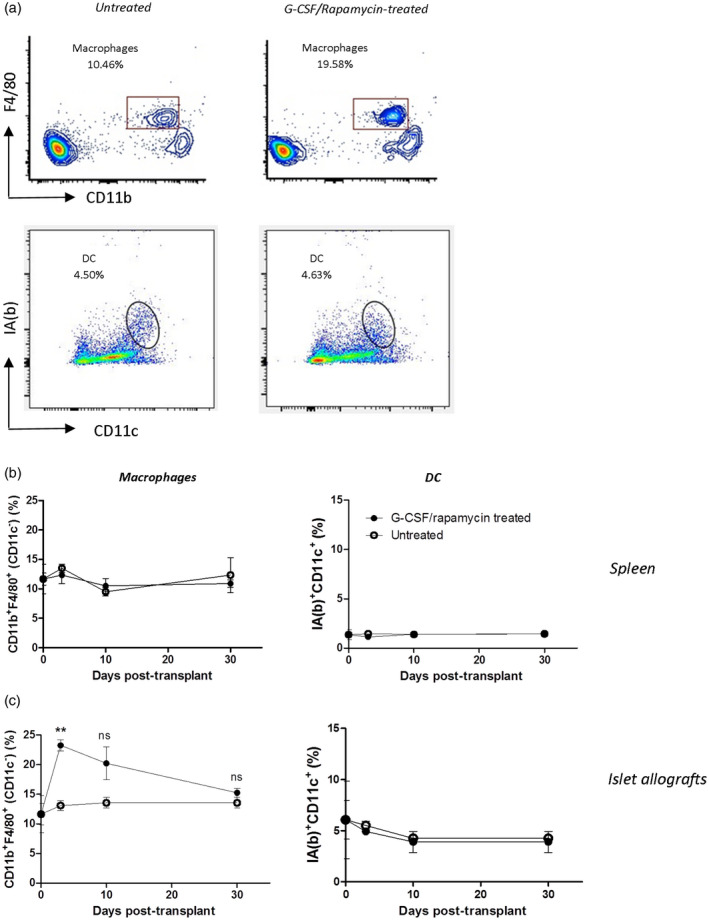
Early surge in phagocytic cells in the grafts of granulocyte colony‐stimulating factor (G‐CSF)/rapamycin‐treated and transplanted mice. Diabetic C57BL/6 mice were transplanted with Balb/c‐derived pancreatic islets and treated for 30 days with G‐CSF/rapamycin. Grafts and spleens were harvested and cells were collected and detected by flow cytometry. One representative dot‐plot (out of four per group) of flow cytometry staining of graft‐infiltrating F4/80+CD11b+ macrophages gated on CD11c− cells [untreated mice: upper left panel (a), treated mice: upper right panel (a)] and dendritic cells (DC) gated on live cells [untreated mice: lower left panel (a), treated mice: lower right panel (a)] infiltrating the spleens (b) and the grafts (c) of G‐CSF/rapamycin‐treated (closed circles) and untreated (open circles) diabetic C57BL/6 mice over time. Data are presented as mean ± standard error of the mean (s.e.m.), n = 4–6/group, **P < 0·01, n.s. = non‐significant, Mann–Whitney test.
These data demonstrate that macrophage frequencies increase upon a Tr1‐cell inducing treatment in vivo and localize during the first days after treatment in the graft, thus suggesting their important role for in‐vivo Tr1‐cell induction.
Early in‐vivo removal of phagocytic cells prevents transplant tolerance
We next tested whether the early surge of macrophages in the grafts of G‐CSF/rapamycin‐treated mice contributes to graft survival. Consequently, clodronate liposomes, that are known to deplete circulating and tissue‐infiltrating phagocytic cells [29], were administered in vivo starting at different time‐points after islet transplantation in G‐CSF/rapamycin‐treated mice. We first confirmed that three i.p. injections of clodronate liposomes at 3‐day intervals deplete graft‐ and spleen‐residing macrophages and DC (Supporting information, Fig. S1a,b). Of interest, liposome‐mediated phagocytic cell depletion from the day of islet transplant until 14 days after leads to graft loss and lack of tolerance induction (Fig. 2). No such effect was observed upon depleting phagocytic cells at 21 or 30 days after allogeneic transplant and G‐CSF/rapamycin treatment initiation. These data show that phagocytic cells are indispensable for tolerance induction upon G‐CSF/rapamycin treatment during the first 2 weeks after transplant.
Fig. 2.
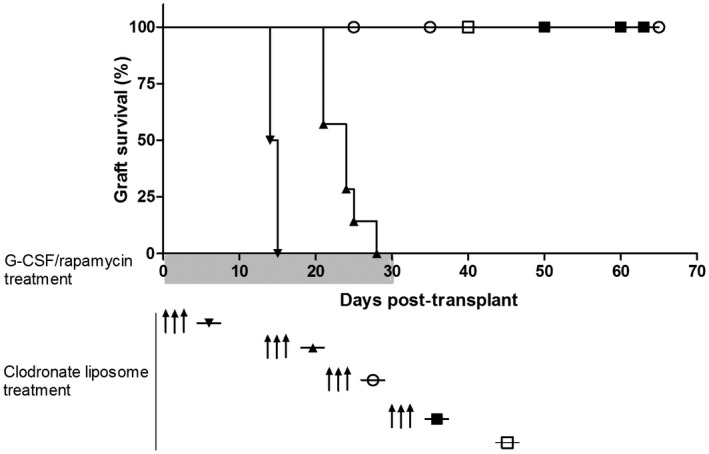
Depletion of early and not late phagocytic cells leads to graft loss. Phagocytic cell‐depleting clodronate liposomes were administered to transplanted mice at several time‐points during the course of granulocyte colony‐stimulating factor (G‐CSF)/rapamycin treatment. Graph shows graft survival curves without ( ) or with clodronate liposome treatment at day 0 (
 ), day 14 (
 ), day 21 (
 ) and day 30 (
 ); n = 4–6/group.
An anti‐inflammatory phenotype characterizes graft‐infiltrating macrophages of G‐CSF/rapamycin‐treated mice
To investigate the phenotype of macrophages infiltrating grafts early during G‐CSF/rapamycin treatment, we monitored the expression of CD206 (anti‐inflammatory M2 macrophage phenotype [30]) and production of IL‐10 [31] by these cells upon their isolation at days 3 and 7 during treatment. F4/80+CD11b+CD11c− macrophages in both allograft and spleen showed an increased expression of CD206 in G‐CSF/rapamycin‐treated mice (Fig. 3a–c). A threefold increased expression of IL‐10 by graft macrophages was observed in treated versus untreated mice, while this was not seen in the spleens.
Fig. 3.
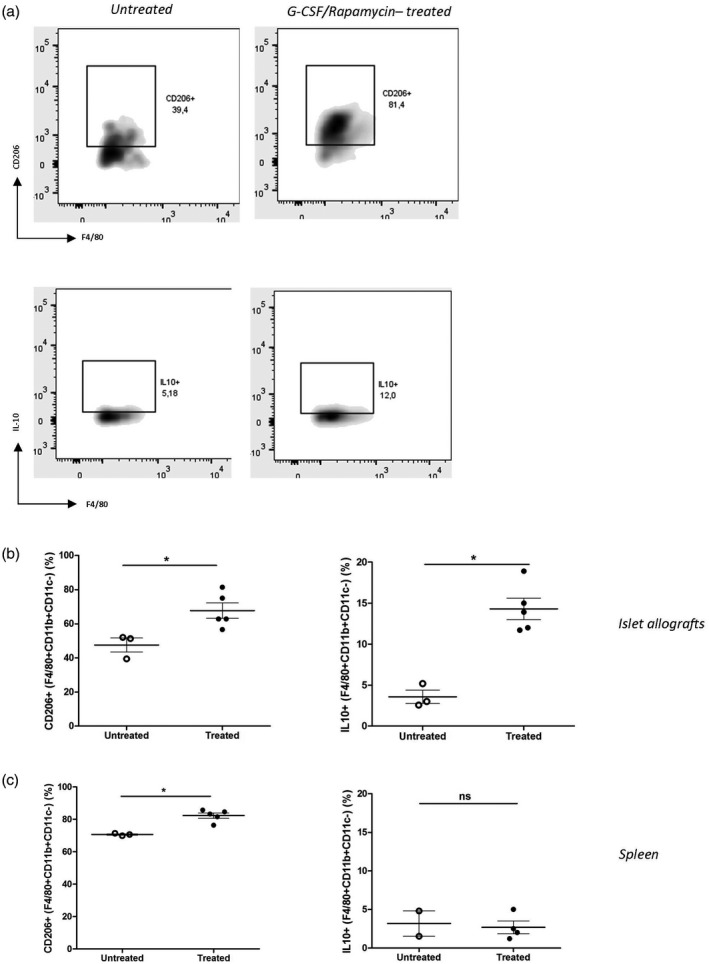
Alternatively activated and interleukin (IL)‐10‐producing macrophages predominate in the grafts of granulocyte colony‐stimulating factor (G‐CSF)/rapamycin‐treated mice. Diabetic C57BL/6 mice were transplanted with Balb/c‐derived pancreatic islets and treated for 3 or 7 days with G‐CSF/rapamycin before euthanizing on days 3 or 7. Grafts and spleens were harvested and cells were collected and detected by flow cytometry. One representative dot‐plot (out of three to five per group) of flow cytometry staining of CD206+ graft‐infiltrating macrophages F4/80+CD11b+CD11c− cells (untreated mice: upper left panel, treated mice: upper right panel) and IL‐10+ graft‐infiltrating macrophages F4/80+CD11b+CD11c− cells [untreated mice: lower left panel (b), treated mice: lower right panel (a)]. Data on percentages of CD206+ macrophages and IL‐10+ macrophages infiltrating the islet allografts (b) and the spleens (c) of G‐CSF/rapamycin‐treated (closed circles) and untreated (open circles) diabetic C57BL/6 mice is presented as mean ± standard error of the mean (s.e.m.), n = 3–5/group, *P < 0·05,**P < 0·01, n.s. = non‐significant, Mann‐Whitney test.
Together these data show that the macrophages are necessary for graft survival during G‐CSF/rapamycin treatment, and are prevalent early during the treatment in the graft, have an M2 phenotype and produce more IL‐10.
Early graft‐infiltrating macrophages induce Tr1‐cell expansion in vitro
To understand whether these M2 phenotype IL‐10‐producing macrophages are capable of inducing Tr1 cells from CD4+ T cells, in‐vitro co‐culture experiments were performed. A pronounced expansion of Tr1 cells from naive splenic CD4+ cells (0·1–3% CD4+CD25−LAG3+ Tr1 cells) was observed as a result of a 7‐day co‐culture with graft‐infiltrating cells derived from G‐CSF/rapamycin‐treated mice versus untreated mice in vitro (Fig. 4).
Fig. 4.
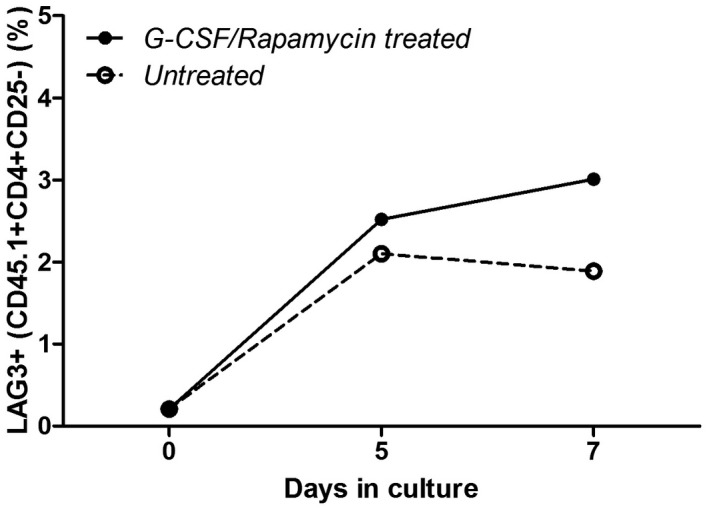
Macrophages infiltrating the grafts early during granulocyte colony‐stimulating factor (G‐CSF)/rapamycin treatment induce T regulatory type 1 (Tr1)‐cell expansion in vitro. Graft‐infiltrating cells harvested earlier were pooled by group [G‐CSF/rapamycin‐treated (closed circles) and untreated (open circles) mice] and used for co‐culture experiments. A total of 100 000 cells were cultured with CD4+ cells, isolated by negative immunomagnetic selection from naive splenocytes of CD45.1 C57BL/6 mice, at a 1 : 1 ratio in 96‐well round‐bottomed plates in complete medium for 5 or 7 days. Upon collection, Tr1 cells were detected by flow cytometry: LAG3+CD4+CD25−CD45.1+ and represented over time.
Early graft phagocytic cells are crucial for a continued Tr1‐cell expansion in vivo
To investigate their role and the time‐line of Tr1‐cell induction in vivo, graft‐infiltrating macrophages were depleted at days 14 and 21 after transplantation. The reason for this is to give time for Tr1‐cell induction to take place, hence clodronate liposomes were administered at 14 and 21 days during the course of G‐CSF/rapamycin treatment and mice were euthanized 1 week later to detect splenic Tr1‐cell frequency. A gradual increase over time (days 7–28) in Tr1‐cell frequency was observed in the absence of clodronate liposome administration (Fig. 5a,b). A discontinuation in Tr1‐cell induction was observed upon phagocytic cell depletion starting at 14 days after transplantation, consistent with graft loss upon clodronate liposome treatment at this time‐point. Conversely, Tr1‐cell induction continued unaffected by phagocytic cell depletion at 21 days post‐transplant. A statistically significant difference (P = 0·0299) in Tr1‐cell frequencies was observed between mice treated with clodronate liposomes at 14 days and untreated mice. Together, these data strongly suggest that the phagocytic cells present early during G‐CSF/rapamycin treatment are necessary for a continued Tr1‐cell induction, which in turn mediate transplant tolerance.
Fig. 5.
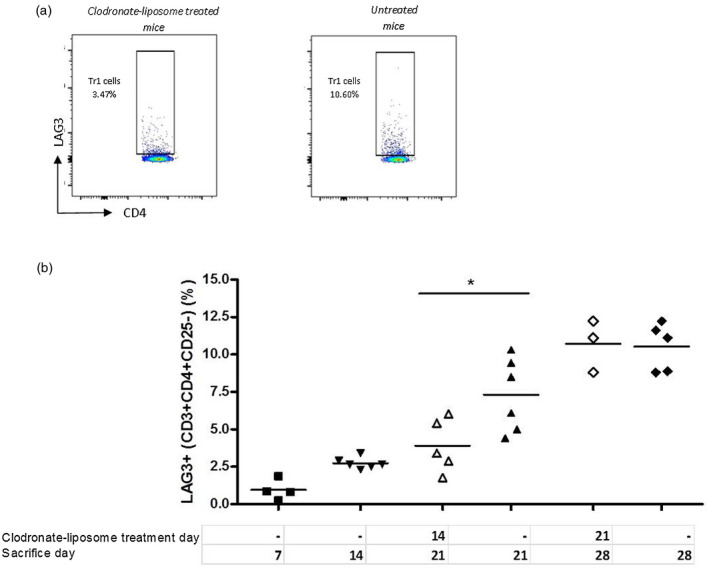
Early phagocytic cell depletion in vivo leads to a halt in T regulatory type 1 (Tr1)‐cell induction. Clodronate liposomes were administered at 14 or 21 days during the course of granulocyte colony‐stimulating factor (G‐CSF)/rapamycin treatment of transplanted mice. Mice were euthanized 1 week after clodronate treatment, their spleens were harvested and the frequency of Tr1 cells was detected by flow cytometry. One representative dot‐plot (out of six) of flow cytometry staining of Tr1 cells gated on CD4+ cells in mice treated [left panel (a)] or untreated [right panel (a)] with clodronate liposomes (CLO) at days 14 or 28 post‐transplant (open forms) or no treatment (closed forms) (b). Data are presented as mean ± standard error of the mean (s.e.m.), n = 3–6/group, *P < 0·05, Mann–Whitney test.
Discussion
Building upon our previous observations, that Tr1 cells are the key players in maintaining tolerance in a STZ‐induced diabetes mouse model of transplantation of allogeneic islets [16, 32, 33], we report on macrophages constituting the early phagocytic cells infiltrating the grafts of tolerant mice. The early infiltration of grafts plays a crucial role in Tr1‐cell generation and maintaining tolerance.
Our mouse model was used to dissect the events building up to tolerance induction by Tr1 cells upon short‐term treatment with G‐CSF/rapamycin. This model allows not only identification of the role of early graft‐infiltrating macrophages, but also suggests the requirement for a continuing generation of Tr1 cells and possibly macrophage‐mediated control of tissue inflammation to establish tolerance. This could be inferred from in‐vivo data showing that graft loss occurs when Tr1‐cell induction discontinues, and in‐vitro data showing an increased expansion of Tr1 cells from naive CD4 cells in the presence of IL‐10‐producing macrophages.
One limitation of our study is that the data for IL‐10 production by these macrophages need to be cautiously interpreted. Intracellular cytokine staining was performed on graft‐infiltrating cells, using appropriate controls. Quantification of IL‐10 mRNA transcripts of these cells or quantification of IL‐10 released into a culture supernatant would provide more assurance of this finding.
Our data on temporary reprogramming of graft‐infiltrating macrophage function early during G‐CSF/rapamycin treatment is similar to the findings reported by Nemeth et al. on the effect of bone marrow stromal cells on monocytes and macrophages in a mouse model of sepsis [31]. Our results implicating macrophages in Tr1‐cell induction are partly in agreement with the observations reported by Zhang et al., where donor‐derived macrophages produced IL‐27, stimulating Tr1‐cell development in a mouse model of GVHD [15]. Conversely, the requirement for recipient DC for initial stimulation, observed by Zhang et al., was contradicted by our data where a role for DC was limited. Differences in the modes of action of the administered compounds could explain this conclusion: therapeutic induction of Tr1 cells via nasal anti‐CD3 leads to the production of IL‐10, TGF‐β and IL‐27 by CD11c+ DC and not by CD11b+ macrophages, while G‐CSF/rapamycin stimulates CD11b+F4/80+CD11c− macrophages. The cytokine profile of these macrophages as IL‐10‐producing and their phenotype as alternatively activated macrophages was demonstrated. These macrophages correspond to the IL‐10‐producing M2 macrophage phenotype proposed by Mantovani et al. implicated in immunoregulation and tissue remodeling [34], with M‐CSF being an established stimulus for M2 polarization [26, 35]. Considering both the immunoregulatory nature of this setting and the M2‐polarizing stimulus used in this model would strongly support an IL‐10‐producing M2 macrophage profile. Nevertheless, molecular confirmation of IL‐10 synthesis by these macrophages would give more certainty.
Our data show an M2 macrophage profile slightly different between the graft, the site of inflammation and the spleen, the site of Tr1‐cell expansion, hence favoring an indirect role for macrophage‐produced IL‐10 over a migration of these macrophages from the graft to the spleen. Furthermore, one cannot exclude the possibility that tolerance can be mediated (at least early during G‐CSF/rapamycin treatment) by two independent events: directly by IL‐10‐producing graft‐infiltrating M2 macrophages and indirectly via Tr1‐cell induction. Another hypothesis would be that IL‐10‐producing M2 macrophages induce forkhead box protein 3 (FoxP3+) Tregs cells in the graft early post‐transplantation. Although requiring investigation, this would be in agreement with previous work from our group implicating FoxP3+ Tregs in initiating tolerance in the graft and Tr1 cells maintaining tolerance from the spleen [36].
Our group and others have identified DC as potent inducers of Tr1 cells in vitro, Tr1‐cell expansion in healthy humans or mouse models of autoimmunity [8, 21, 37]. Data from our current stringent islet transplant model in diabetes contrasts such findings and points to a key role for M2 macrophages with tolerogenic properties and ability to induce Tr1 cells in vivo and in vitro.
These data offer insight into one mechanism of in‐vivo induction of Tr1 cells in diabetes. Macrophage modulation could be explored therapeutically, as an alternative to adoptive transfer of ex‐vivo expanded Tr1 cells, currently under active clinical investigation to control autoimmune diseases [5].
Disclosures
The authors declare no financial and commercial conflicts of interest.
Supporting information
Fig. S1. Macrophages and DC are the phagocytic cells sensitive to depleting treatment by clodronate liposomes.
Acknowledgements
The authors thank FRACTAL facility (San Raffaele Hospital) for technical assistance with flow cytometry. For this work, B. M. was supported by the 7th framework programme of the EU (Marie Curie Initial Training Network‐FP7‐PEOPLE‐2011‐ITN) under the Marie Skłodowska‐Curie Grant Agreement no. 289903: EUTRAIN. M. B. is supported by research grants from JDRF (Grant 7‐2006‐328 for this work), NIH and the Italian Ministry of Health.
References
- 1. Bacchetta R, Bigler M, Touraine JL et al High levels of interleukin 10 production in vivo are associated with tolerance in SCID patients transplanted with HLA mismatched hematopoietic stem cells. J Exp Med 1994; 179:493–502. [DOI] [PMC free article] [PubMed] [Google Scholar]
- 2. Roncarolo MG, Yssel H, Touraine JL, Betuel H, De Vries JE, Spits H. Autoreactive T cell clones specific for class I and class II HLA antigens isolated from a human chimera. J Exp Med 1988; 167:1523–34. [DOI] [PMC free article] [PubMed] [Google Scholar]
- 3. Sanda S, Roep BO, von Herrath M. Islet antigen specific IL‐10+ immune responses but not CD4+CD25+FoxP3+ cells at diagnosis predict glycemic control in type 1 diabetes. Clin Immunol 2008; 127:138–43. [DOI] [PubMed] [Google Scholar]
- 4. Roncarolo MG, Gregori S, Bacchetta R, Battaglia M, Gagliani N. The biology of T regulatory type 1 cells and their therapeutic application in immune‐mediated diseases. Immunity 2018; 49:1004–19. [DOI] [PubMed] [Google Scholar]
- 5. Gregori S, Roncarolo MG. Engineered T regulatory type 1 cells for clinical application. Front Immunol 2018; 9:233. [DOI] [PMC free article] [PubMed] [Google Scholar]
- 6. Mfarrej B, Tresoldi E, Stabilini A et al Generation of donor‐specific Tr1 cells to be used after kidney transplantation and definition of the timing of their in vivo infusion in the presence of immunosuppression. J Transl Med 2017; 15:40. [DOI] [PMC free article] [PubMed] [Google Scholar]
- 7. Creusot RJ, Battaglia M, Roncarolo MG, Fathman CG. Concise review: cell‐based therapies and other non‐traditional approaches for type 1 diabetes. Stem Cells 2016; 34:809–19. [DOI] [PMC free article] [PubMed] [Google Scholar]
- 8. Gregori S, Tomasoni D, Pacciani V et al Differentiation of type 1 T regulatory cells (Tr1) by tolerogenic DC‐10 requires the IL‐10‐dependent ILT4/HLA‐G pathway. Blood 2010; 116:935–44. [DOI] [PubMed] [Google Scholar]
- 9. Groux H, O'Garra A, Bigler M et al A CD4+ T‐cell subset inhibits antigen‐specific T‐cell responses and prevents colitis. Nature 1997; 389:737–42. [DOI] [PubMed] [Google Scholar]
- 10. Groux H, Cottrez F, Rouleau M et al A transgenic model to analyze the immunoregulatory role of IL‐10 secreted by antigen‐presenting cells. J Immunol 1999; 162:1723–9. [PubMed] [Google Scholar]
- 11. Maynard CL, Harrington LE, Janowski KM et al Regulatory T cells expressing interleukin 10 develop from Foxp3+ and Foxp3‐ precursor cells in the absence of interleukin 10. Nat Immunol 2007; 8:931–41. [DOI] [PubMed] [Google Scholar]
- 12. Awasthi A, Carrier Y, Peron JP et al A dominant function for interleukin 27 in generating interleukin 10‐producing anti‐inflammatory T cells. Nat Immunol 2007; 8:1380–9. [DOI] [PubMed] [Google Scholar]
- 13. Iwasaki Y, Fujio K, Okamura T et al Egr‐2 transcription factor is required for Blimp‐1‐mediated IL‐10 production in IL‐27‐stimulated CD4+ T cells. Eur J Immunol 2013; 43:1063–73. [DOI] [PubMed] [Google Scholar]
- 14. Hooper KM, Kong W, Ganea D. Prostaglandin E2 inhibits Tr1 cell differentiation through suppression of c‐Maf. PLOS ONE 2017; 12:e0179184. [DOI] [PMC free article] [PubMed] [Google Scholar]
- 15. Zhang P, Lee JS, Gartlan KH et al Eomesodermin promotes the development of type 1 regulatory T (TR1) cells. Sci Immunol 2017;2 10.1126/sciimmunol.aah7152. [DOI] [PMC free article] [PubMed] [Google Scholar]
- 16. Gagliani N, Gregori S, Jofra T et al Rapamycin combined with anti‐CD45RB mAb and IL‐10 or with G‐CSF induces tolerance in a stringent mouse model of islet transplantation. PLOS ONE 2011; 6:e28434. [DOI] [PMC free article] [PubMed] [Google Scholar]
- 17. Fousteri G, Jofra T, Di Fonte R, Battaglia M. Combination of an antigen‐specific therapy and an immunomodulatory treatment to simultaneous block recurrent autoimmunity and alloreactivity in non‐obese diabetic mice. PLOS ONE 2015; 10:e0127631. [DOI] [PMC free article] [PubMed] [Google Scholar]
- 18. Okamura T, Fujio K, Shibuya M et al CD4+CD25‐LAG3+ regulatory T cells controlled by the transcription factor Egr‐2. Proc Natl Acad Sci USA 2009; 106:13974–9. [DOI] [PMC free article] [PubMed] [Google Scholar]
- 19. Gagliani N, Magnani CF, Huber S et al Coexpression of CD49b and LAG‐3 identifies human and mouse T regulatory type 1 cells. Nat Med 2013; 19:739–46. [DOI] [PubMed] [Google Scholar]
- 20. Jofra T, Di Fonte R, Galvani G et al Tr1 cell immunotherapy promotes transplant tolerance via de novo Tr1 cell induction in mice and is safe and effective during acute viral infection. Eur J Immunol 2018; 48:1389–99. [DOI] [PubMed] [Google Scholar]
- 21. Yu H, Gagliani N, Ishigame H et al Intestinal type 1 regulatory T cells migrate to periphery to suppress diabetogenic T cells and prevent diabetes development. Proc Natl Acad Sci USA 2017; 114:10443–8. [DOI] [PMC free article] [PubMed] [Google Scholar]
- 22. Denning TL, Wang YC, Patel SR, Williams IR, Pulendran B. Lamina propria macrophages and dendritic cells differentially induce regulatory and interleukin 17‐producing T cell responses. Nat Immunol 2007; 8:1086–94. [DOI] [PubMed] [Google Scholar]
- 23. Chabtini L, Mfarrej B, Mounayar M et al TIM‐3 regulates innate immune cells to induce fetomaternal tolerance. J Immunol 2013; 190:88–96. [DOI] [PMC free article] [PubMed] [Google Scholar]
- 24. Hadis U, Wahl B, Schulz O et al Intestinal tolerance requires gut homing and expansion of FoxP3+ regulatory T cells in the lamina propria. Immunity 2011; 34:237–46. [DOI] [PubMed] [Google Scholar]
- 25. Turnquist HR, Cardinal J, Macedo C et al mTOR and GSK‐3 shape the CD4+ T‐cell stimulatory and differentiation capacity of myeloid DCs after exposure to LPS. Blood 2010; 115:4758–69. [DOI] [PMC free article] [PubMed] [Google Scholar]
- 26. Akagawa KS. Functional heterogeneity of colony‐stimulating factor‐induced human monocyte‐derived macrophages. Int J Hematol 2002; 76:27–34. [DOI] [PubMed] [Google Scholar]
- 27. Huang FP, Platt N, Wykes M et al A discrete subpopulation of dendritic cells transports apoptotic intestinal epithelial cells to T cell areas of mesenteric lymph nodes. J Exp Med 2000; 191:435–44. [DOI] [PMC free article] [PubMed] [Google Scholar]
- 28. Kirby AC, Coles MC, Kaye PM. Alveolar macrophages transport pathogens to lung draining lymph nodes. J Immunol 2009; 183:1983–9. [DOI] [PMC free article] [PubMed] [Google Scholar]
- 29. Buiting AM, Zhou F, Bakker JA, van Rooijen N, Huang L. Biodistribution of clodronate and liposomes used in the liposome mediated macrophage ‘suicide’ approach. J Immunol Methods 1996; 192:55–62. [DOI] [PubMed] [Google Scholar]
- 30. Kambara K, Ohashi W, Tomita K et al In vivo depletion of CD206+ M2 macrophages exaggerates lung injury in endotoxemic mice. Am J Pathol 2015; 185:162–71. [DOI] [PubMed] [Google Scholar]
- 31. Németh K, Leelahavanichkul A, Yuen PS et al Bone marrow stromal cells attenuate sepsis via prostaglandin E(2)‐dependent reprogramming of host macrophages to increase their interleukin‐10 production. Nat Med 2009; 15:42–9. [DOI] [PMC free article] [PubMed] [Google Scholar]
- 32. Battaglia M, Stabilini A, Draghici E et al Induction of tolerance in type 1 diabetes via both CD4+CD25+ T regulatory cells and T regulatory type 1 cells. Diabetes 2006; 55:1571–80. [DOI] [PubMed] [Google Scholar]
- 33. Battaglia M, Stabilini A, Draghici E et al Rapamycin and interleukin‐10 treatment induces T regulatory type 1 cells that mediate antigen‐specific transplantation tolerance. Diabetes 2006; 55:40–9. [PubMed] [Google Scholar]
- 34. Mantovani A, Sica A, Sozzani S, Allavena P, Vecchi A, Locati M. The chemokine system in diverse forms of macrophage activation and polarization. Trends Immunol 2004; 25:677–86. [DOI] [PubMed] [Google Scholar]
- 35. Lacey DC, Achuthan A, Fleetwood AJ et al Defining GM‐CSF‐ and macrophage‐CSF‐dependent macrophage responses by in vitro models. J Immunol 2012; 188:5752–65. [DOI] [PubMed] [Google Scholar]
- 36. Gagliani N, Jofra T, Valle A et al Transplant tolerance to pancreatic islets is initiated in the graft and sustained in the spleen. Am J Transplant 2013; 13:1963–75. [DOI] [PMC free article] [PubMed] [Google Scholar]
- 37. Wu HY, Quintana FJ, da Cunha AP et al In vivo induction of Tr1 cells via mucosal dendritic cells and AHR signaling. PLOS ONE 2011; 6:e23618. [DOI] [PMC free article] [PubMed] [Google Scholar]
Associated Data
This section collects any data citations, data availability statements, or supplementary materials included in this article.
Supplementary Materials
Fig. S1. Macrophages and DC are the phagocytic cells sensitive to depleting treatment by clodronate liposomes.


