Summary
Regulatory T (Treg) cell therapy is a promising approach for immune tolerance induction in autoimmunity conditions and cell/organ transplantations. Insufficient isolation yields and impurity during downstream processes and Treg instability after adoptive transfer in inflammatory conditions are major limitations to Treg therapy, and indicate the importance of seeking a valid, reliable method for de‐novo generation of Tregs. In this research, we evaluated Treg‐like cells obtained from different Treg differentiation protocols in terms of their yield, purity and activity. Differentiation was performed on naive CD4+ cells and a naive CD4+/Treg co‐culture by using three different protocols – ectopic expression of forkhead box protein P3 (E‐FoxP3), soluble transforming growth factor β (S‐TGF) and small molecules [N‐acetyl puromycin and SR1555 (N‐Ac/SR)]. The results showed that a high yield of a homogeneous population of Treg‐like cells could be achieved by the N‐Ac/SR method under a T helper type 17 (Th17)‐polarizing condition, particularly interleukin (IL)‐6 and TGF‐β, when compared with the E‐FoxP3 and S‐TGF methods. Surprisingly, SR completely inhibited the differentiation of IL‐17‐producing cells and facilitated Treg generation in the inflammatory condition and had highly suppressive activity against T cell proliferation without Treg‐specific demethylase region (TSDR) demethylation. For the first time, to our knowledge, we report the generation of efficient, pure Treg‐like cells by using small molecules during in‐vitro inflammatory conditions. Our results suggested that the N‐Ac/SR method has several advantages for Treg generation when compared with the other methods, including a higher purity of Tregs, easier procedure, superior suppressive activity during the inflammatory condition and decreased cost.
Keywords: differentiation of Treg, exogenous FoxP3, N‐acetyl puromycin, SR1555, Treg therapy
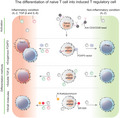
We performed de novo generation of regulatory T cell from naïve CD4+ T cells using different methods including the ectopic expression of FoxP3, soluble TGF‐β and small molecules, SR1555 and N‐acetylpuromycin. Our results showed that naïve T cells were significantly differentiated into Treg using combination of small molecules (N‐Ac/SR) in inflammatory condition. Further, we observed that exogenous FoxP3‐induced Treg cells have a relative resistance to inflammatory condition.
Introduction
Regulatory T (Treg) cells are a critical fraction of CD4+ T cells that are indispensable for self‐tolerance and immune homeostasis [1]. A breakdown of self‐tolerance due to several quantitative and/or functional defects in Treg cells is seen in different autoimmune disorders [2]. However, induction of self‐tolerance may have tremendous therapeutic potential in preventing allograft rejection of transplanted cells, tissues and organs [2, 3]. Clinical studies have confirmed the safety and efficacy of autologous Treg therapy [4]. This approach presents a new opportunity for control of autoreactive immune cells in autoimmune disorders such as type 1 diabetes (T1D), multiple sclerosis (MS) and colitis [5, 6, 7].
Forkhead box protein P3 (FoxP3) is a crucial transcription factor that controls Treg differentiation and function [8] and is expressed in Tregs and other activated T cells. In order to overcome this challenge, the use of other markers was suggested to identify functional Tregs, such as cytotoxic T lymphocyte‐associated antigen 4 (CTLA‐4), which is essential for in‐vivo and in‐vitro suppression [8]. Constitutive expression of FoxP3 is necessary for long‐term Treg stability and specific functionality while affected by epigenetic mechanisms, especially the methylation/demethylation of the FoxP3 conserved non‐coding DNA sequence elements (CNS), which is a member of the Treg‐specific demethylase region (TSDR) [9].
Transforming growth factor (TGF)‐β‐induced Treg (iTreg) cells, known as peripheral Treg (pTreg), are anatomically distinguishable from natural Treg (nTreg) cells that are differentiated in the thymus [10]. During peripheral differentiation, TGF‐β acts as an endocrine factor that profoundly affects FoxP3 expression during Treg differentiation and function [11]. In‐vitro‐generated Treg‐like cells (TGF‐β + IL‐2) express high levels of FoxP3 and exhibit robust suppressive activity, while FoxP3 has methylated in the TSDR regions [12].
During inflammatory conditions, TGF‐β induces Treg cells towards an effector fate, the IL‐17‐producing cells, which are known as T helper type 17 (Th17) cells. This phenomenon is called Treg instability [13]. According to several reports, instability in the Treg population is completely abrogated through suppression of receptor‐related orphan receptor gamma (RORγ) function by ROR‐inverse agonists such as SR1555 (SR) and SR1001 [14, 15].
Of note, there is a scant amount of isolated CD4+CD25+CD127dim/‐ Tregs obtained from peripheral blood. The related process is expensive, labor‐intensive and accompanied by impurity with an undesired cell population [16, 17, 18]. A highly homogeneous and functional population is essential for Treg infusion and can be achieved by directed differentiation of Treg cells from naive T cells [19]. However, in order to circumvent the problems of Treg abundance and instability it is necessary to have an inexpensive, safe and effective method for Treg generation that prevents Th17 differentiation.
In this research, we developed an inexpensive, safe and effective protocol to generate Treg cells. This protocol combines a RORγ‐specific inverse agonist (SR) and a TGF‐β signaling promoter [N‐acetyl puromycin (N‐Ac)]. We compared this method to two routine Treg generation protocols, ectopic expression of FoxP3 (E‐FoxP3) and soluble TGF‐β (S‐TGF), and assessed the quantity, quality and purity of Treg cells generated with each method under inflammatory and non‐inflammatory conditions. We evaluated these three protocols based on yield, FoxP3 expression, suppressive activity and cytokine production of generated Treg cells.
Materials and methods
Antibodies and reagents
The following monoclonal antibodies were used for flow cytometry analysis: anti‐FoxP3 peridinin chlorophyll (PerCP) (no. 561493), anti‐CD4‐fluorescein isothiocyanate (FITC) (no. 561842), anti‐IL‐17‐phycoerythrin (PE) (no. 560436), cytotoxic T lymphocyte antigen (CTLA)‐4‐PE (no. 557301) and anti‐CD45RA‐PE (no. 555489) (all from BD Biosciences, Heidelberg, Germany); anti‐CD25‐PE (no. 555432; Biolegend, Koblenz, Germany); anti‐CD127‐APC (no. 17‐1278‐42, Thermo Fisher Scientific, Fremont, CA, USA). Cytofix/Cytoperm solution and Perm/Wash buffer (no. 554714) for intracellular staining of FoxP3, CTLA‐4 and IL‐17A and the Human Regulatory T Cell Sorting Kit (no. 560753) were purchased from BD Biosciences (Germany). Hydroxyethyl starch solution (Voluven®) was purchased from Fresenius Kabi (Bad Homburg, Germany). Lymphodex (no. 002041600) was purchased from Inno‐Train (Germany). Anti‐CD3/CD28 beads (Dynabead T cell activator, no. 11161D) and TGF‐β (no. 14‐8348‐62) were purchased from Thermo Fisher (Erlangen, Germany). RPMI‐1640 medium (no. 11875119) was obtained from gibco (Carlsbad, CA, USA). Carboxyfluorescein succinimidyl ester (CFSE, no. C1157) and Turbofect (R0533) were purchased from Invitrogen (Carlsbad, CA, USA). RetroNectin (no. T100A/B) and TaqMan were purchased from Takara Biomedical (Shiga, Japan). pRV.green fluorescent protein (GFP) FoxP3 (no. 13250) was purchased from Addgene (Watertown, MA, USA). Naive T Cell Isolation Kit II (no. 130‐094‐131) and IL‐6 (no. 130‐095‐365) were purchased from Miltenyi Biotec (Bergisch Gladbach, Germany). Penicillin and streptomycin (no. 15140122) were obtained from gibco. IL‐2 (no. R0012) was purchased from Royan Biotech (Teheran, Iran); 2‐mercaptoethanol (no. 60‐24‐2) and SR1555 (SR) (no. SML0765) were obtained from Sigma‐Aldrich (St Louis, MO, USA). N‐Ac (no. 5679) was purchased from Tocris Bioscience (Bristol, UK) and the UK RNeasy Mini Kit (no. 74104) was obtained from Qiagen (Hilden, Germany). Enzyme‐linked immunosorbent assay (ELISA) kits were purchased from Bioassay Technology Laboratory (Shanghai, China) and a DNA extraction kit was obtained from Qiagen (Germany). Sodium sulfate and hydroquinone were obtained from Sigma‐Aldrich. A viral RNA kit was purchased from Qiagen (Manchester, UK).
Selection of healthy donors
For this experimental research, human peripheral blood samples were obtained from healthy adult donors. Written informed consent was signed by all volunteers before enrollment. The study was approved by the local human Ethics Committees of Tehran University of Medical Sciences and the Royan Institute. All donors were determined to be healthy and without any serious disorders, autoimmunity conditions, infections or asthma. The donors were not obese, nor was there any reported smoking history.
T cell sorting, culture and activation
Whole blood was collected 2–4 h before isolation of the peripheral blood mononuclear cells (PBMCs). Ficoll density gradient centrifugation was used to isolate the PBMCs by Lymphodex. The isolated PBMCs were sorted by fluorescence‐activated cell sorting (FACS) to obtain Treg cells (98% purity) and naive T cells were isolated (92 ± 5% purity) by magnetic activated cell sorting (MACS), both according to the manufacturer’s guidelines (Fig. 1a). The remaining cells from each sample were preserved as autologous conventional T cells (Tconv) cells to be used for the suppressive activity test. The purified cells were defined with the CD4+CD45RA+ marker as naive T cells and the CD4+CD25+CD127dim/‐ marker was used to identify the Treg cells. We isolated the Treg cells by staining the PBMCs in FACS buffer [PBS, 1% fetal bovine serum (FBS)] with anti‐CD4, anti‐CD25 and anti‐CD127 for 45 min on ice. These PBMCs were then washed and resuspended in 3 ml of FACS buffer.
Fig. 1.
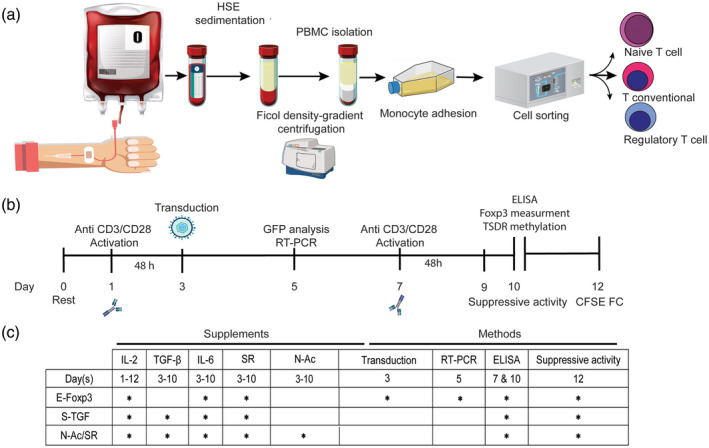
Schematic diagram of the experimental plan to optimize the regulatory T (Treg) cell generation protocol. (a) Collected blood was sorted to isolate the target cells. Magnetic‐activated cell sorting (MACS) was performed for naive T cell isolation and fluorescence‐activated cell sorting (FACS) for Treg isolation. (b) Outline of the overall study plan. (c) The schedule of the assays and supplements according to the study groups.
To optimize the activation procedure, the naive T cells were activated with anti‐CD3/CD28 at a 1 : 1 cell/bead ratio and different concentrations (30, 50, 100 and 200 IU) of IL‐2. The most effective ratio of cells/beads was determined. Complete medium without IL‐2 was the control. The morphological changes in activated naive T cells were examined by fluorescence microscope and flow cytometry 48 h after activation. During 10 days of culture the isolated cells were activated from day 3 for 48 h, followed by an overnight rest period at 37°C in medium with IL‐2 alone. Restimulation was performed again on day 7. TGF‐β‐1 (3 ng/ml), IL‐6 (30 ng/ml), SR (10 μM) and N‐Ac (10 μg/ml) were selectively added to the related wells of a 96‐well plate that contained 150 μl complete RPMI‐1640 and 8 × 10⁴ cells/well after day 3 (Fig. 1b). The Treg phenotype was determined after activation. In the E‐FoxP3 group, relative expressions of endogenous and exogenous FoxP3 were assessed 72 h post‐transduction (day 5) by reverse transcription–polymerase chain reaction (RT–PCR) (Fig. 1c). FoxP3‐GFP expression was quantitatively analyzed by flow cytometry and visualized by fluorescent microscopy. In all groups, the number of Treg‐like cells and cytokine release were assessed by flow cytometry on day 7 and ELISA on day 10 (Fig. 1b,c). ELISA was performed to measure the concentrations of released IL‐17A, IFN‐γ, IL‐10 and TGF‐β in the medium at days 7 and 10, according to the manufacturer’s instructions. Finally, suppressive activity was determined at day 12. After 48 h, flow cytometry results indicated a downward shift in CFSE intensity (Fig. 1b,c). In addition to ELISA, intracellular staining of IL‐17A was performed for flow cytometry analysis of the CD4+FoxP3+IL‐17+ cells. Next, the Treg‐like cells were co‐cultured with naive T cells at a 1 : 1 ratio under anti‐CD3/CD28 activation to generate Tregs with the two protocols, N‐Ac and SR and S‐TGF, for assessment under inflammatory and non‐inflammatory conditions. Finally, the percentage of Treg phenotype cells was determined on day 10. The culture medium was RPMI‐1640 supplemented with 10% FBS, 100 IU/ml penicillin, 100 mg/ml streptomycin, 2 mM L‐glutamine, 50 μM mercaptoethanol, 1 mM sodium pyruvate and 1× non‐essential amino acids. Flow cytometry was performed using a FACSCalibur flow cytometer (Becton Dickinson, Palo Alto, CA, USA) and the related data were analyzed by FlowJo software (Tree Star, Inc., Ashland, OR, USA).
ELISA
ELISA was performed to measure the concentrations of released IL‐17A, IFN‐γ, IL‐10 and TGF‐β‐1 in the medium at days 7 and 10, according to the manufacturer’s instructions. Briefly, cell‐free supernatants were collected and added to the 96‐well plates that were coated with the related monoclonal antibody and incubated at 37°C for 1 h. Next, the plates were washed three times with washing buffer and streptavidin–horseradish peroxidase (HRP)‐conjugated secondary antibody was added to the wells. The plates were incubated for 1 h at 37°C and washed three times. A substrate solution was added to each well and the plates were incubated for 10 min at room temperature in the dark. Subsequently, a stop solution was added to terminate the reaction and the intensity was determined at 450 nm with a microplate reader (Bio‐Tek, Winooski, VT, USA). In this study, we used the serum‐free medium 24 h after supernatant harvesting during the stimulation and restimulation days in some of the wells to measure the cytokines. Serum‐free medium (no antigen) was used as the blank for ELISA.
Suppressive activity test
The suppressive activity test was performed based on CFSE labeling. Briefly, Tconv cells that had been separated from naive T cells during MACS sorting were cryopreserved in 90% heat‐inactivated FBS and 10% dimethyl sulfoxide (DMSO) until the suppressive assay was performed. Tconv were thawed in a 37°C water bath and labeled with CFSE. Conditioned CD4+ cells were co‐cultured with CFSE‐labeled T cells at different ratios of conditioned CD4+/Tconv (1 : 1, 1 : 5, 1 : 25 and 1 : 125) in 200 IU/ml IL‐2, at a 1 : 3 ratio of cells/beads at 37°C. After 48 h, flow cytometry results showed a downward shift in CFSE intensity. CFSE‐labeled T cells were considered to be the negative control group.
Virus production and FoxP3 transduction
The vector production process was carried out in platinum A, a retrovirus packaging cell line provided by the Royan Institute Vector Bank. The platinum A cell line was transfected with pRV.GFP FoxP3 using Turbofect® reagent. The activated cells were transfected twice after 24 and 36 h to increase the transfection rate. In order to determine the transfection efficiency, we measured the GFP expression levels of the released viruses by flow cytometry at 48 h post‐transfection.
We used the double high‐spin transduction method for retroviral transduction. For the E‐FoxP3 subgroup, the viral particles were harvested 48 and 72 h after transfection and placed in a RetroNectin‐coated 96‐well plate that contained 4 µg/ml polybrene. Briefly, the transduction was performed 48 and 54 h after activation. The transduced cells were centrifuged (at 2000 g) for 1 h and incubated at 37°C for 6 h. The previously incubated cells were transduced and centrifuged again at 2000 g and incubated for a second time at 37°C for 6 h. Transduction efficiency was determined by GFP expression, qualitatively by fluorescent microscopy and quantitatively by flow cytometry. The PMX‐GFP vector was the control vector.
RT–PCR
Total RNA was extracted by RNeasy Mini Kits and reverse transcribed to cDNA. Isolated Tregs were the positive control and transduced PMX‐GFP‐HT1080 was the negative control for FoxP3 expression. We used four pairs of primers to amplify endogenous FoxP3, exogenous FoxP3, GAPDH, and RORγ‐t as follows: endogenous FoxP3 forward: 5′‐CAGCACATTCCCAGAGTTCCTC‐3′, reverse: 5′‐GCGTGTGAACCAGTGGTAGATC‐3′; exogenous FoxP3‐GFP forward: 5′‐TTTCTGTCAGTCCACTTCACC‐3′, reverse: 5′‐GGTCTGAGGCTTTGGGTG‐3′; GAPDH forward: 5′‐ATTCCACCCATGGCAAATTC‐3′, reverse: 5′‐GCATCGCCCCACTTGATT‐3′; and RORγ‐t forward: 5′‐TGAGAAGGACAGGGAGCCAA‐3′, reverse: 5′‐CCACAGATTTTGCAAGGGATCA‐3′. Each reaction consisted of a total volume of 25 µl when combined with reagents from the TaKaRa Ex Taq® Kit (Takara) and were stained with SYBR green. Thermocycling conditions consisted of 35 cycles of denaturing at 94°C for 30 s, annealing at 55°C for 15 s, and extension at 72°C for 60 s.
We assessed the relative methylation of TSDR. Each reaction consisted of a total volume of 20 μl with 50–100 ng of bisulfite‐treated DNA and 25 pmol of each primer.
FoxP3 methylation analysis by RT‐PCR
We collected all samples from male donors to prevent the effect of X inactivation in females. DNA was extracted from the cultured cells by Qiagen DNA extraction kit, according to the manufacturer’s instructions. A NanoDrop 1000 (Thermo Scientific, Wilmington, DE, USA) was used to determine the concentration of extracted DNA. Electrophoresis (1% agarose) was used to assess the purity of the extracted DNA, which was kept at −20°C until use. The primers used for DNA methylation analysis of FoxP3 TSDR have been reported elsewhere [20]. The denatured DNA was treated by sodium bisulfite. The composition of the bisulfite solution has been described previously [21]. Briefly, 4·25 g of sodium bisulfite was reconstituted with 7·5 ml H2O followed by the addition of 450 μl hydroquinone solution (50 mmol/l); its pH was adjusted to 5·15 with NaOH (10 mol/l). The extracted DNA was denatured by 3 mol/l NaOH, incubated for 20 min at 54°C, and mixed with 1 ml of the bisulfite solution. The final solution was incubated in the dark at 50°C for 15 h. Sodium bisulfite‐treated DNA was recovered using a viral RNA mini kit according to the method of Ogino et al. [22]. nTreg was the positive control for the demethylated primer and untreated DNA was used as the negative control for both the methylated and demethylated primers.
Relative TSDR methylation was calculated on the basis of the cycle threshold (Ct) of the demethylated and methylated DNA as follows:
where CtTG represents the Ct values obtained by the TG (demethylated) primers and CtCG represents the Ct achieved with the CG (methylated) primers.
Experimental groups
There were three main experimental groups compared under inflammatory and non‐inflammatory conditions. In the first group, activated naive T cells were transduced with retroviral FoxP3–GFP (E‐FoxP3). In the second group, activated naive T cells received S‐TGF. The third group was the small molecule group N‐Ac/SR). Finally, the co‐culture of Treg/naive T cells was separately examined in the presence of TGF‐β and N‐Ac/SR under inflammatory and non‐inflammatory conditions. The control group was cultivated in 200 IU IL‐2.
Statistical analysis
At least three sets of samples from the selected time‐points were statistically analyzed using Prism version 8 software (GraphPad Software, Inc., San Diego, CA, USA). All data were written as mean ± standard deviation (s.d.). Student’s unpaired two‐tailed t‐test was used for comparisons between two groups. Differences among means were tested for more than two groups with one‐way analysis of variance (anova) followed by multiple‐comparison using Bonferroni’s correction. Differences between groups and time‐points were analyzed using two‐way anova followed by a multiple‐comparison using Bonferroni’s correction. *P < 0·05; **P < 0·001; ***P = 0·0002; and ****P < 0·0001 indicated statistical significance.
Results
FoxP3 expression in activated naive T cells was IL‐2 dose‐dependent and mediated by ligation of CD3/CD28
We sought to define the optimum concentration of IL‐2 that would give high yields of activated naive T cells. To accomplish this, we cultured naive T cells in different concentrations of IL‐2 for 48 h and assessed FoxP3 expression levels. Our results revealed that the different ratios of IL‐2 showed vastly different levels of cell activation at the 1 : 1 ratio of cells/beads (Fig. 2a). Although cell activation occurred with all the 30–200 IU concentrations, a significant increase was observed with the 100 and 200 IU concentrations (Fig. 2b). We observed that naive T cells could be activated at ratios of 1 : 1, 1 : 3 and 1 : 5 cells/beads. The percentage of activated T cells at the 1 : 5 ratio was significantly lower than the other groups, and there was no significant difference between the 1 : 1 and 1 : 3 ratios (Fig. 2c). During the first day, the proportion of FoxP3+ cells significantly increased in the presence of 200 IU of IL‐2 compared to the other concentrations (Fig. 2d and Supporting information, Fig. S1). For the following experiments, activation was performed with 200 IU of IL‐2 at the 1 : 3 cell/beads ratio (86 ± 8%).
Fig. 2.
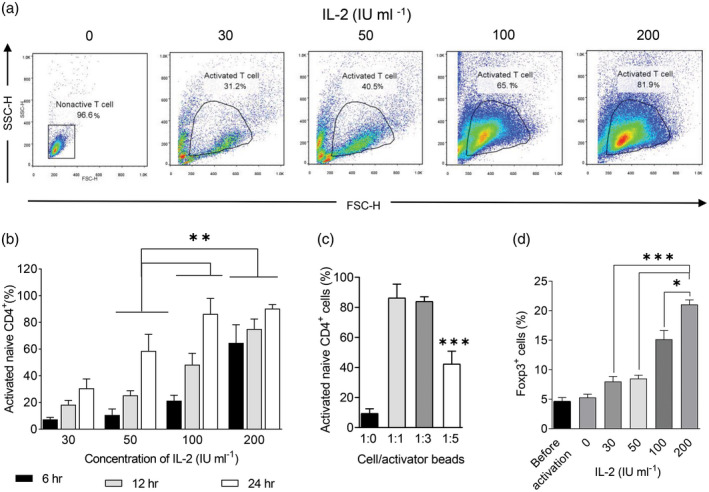
Naive T cell activation after ligation of CD3/CD28 in the presence of high levels of interleukin (IL)‐2. (a) After 24 h, naive T cell activation was determined by flow cytometry. (b) The activated naive T cells were compared at 6, 12 and 24 h in the presence of 30, 50, 100 and 200 IU of IL‐2 at a 1 : 1 cell/bead ratio [two‐way analysis of variance (anova)]. (c) Naive T cell activation with different ratios of cells/beads at 200 IU of IL‐2 was determined (one‐way anova). (d) Forkhead box protein P3 (FoxP3) expression level in activated naive T cells at 1 : 3 cells/beads was compared at different concentrations of IL‐2 (two‐tailed unpaired t‐test). All samples were analyzed in duplicate. The results are presented as mean ± standard deviation. *P < 0·05; **P < 0·001; ***P = 0·0002; ****P < 0·0001; five to six donors in the independent experiments.
Ectopic expression of E‐FoxP3 is the most efficient protocol for Treg cell generation from naive T cells under the non‐inflammatory condition
Treg‐like cells derived from the E‐FoxP3 protocol (Fig. 3a and Supporting information, Fig. S2) significantly increased at day 10 (69·26 ± 5·88%) compared with the cells derived from the S‐TGF (59·23 ± 3·28%) and N‐Ac/SR (45·02 ± 4·21%) protocols under the non‐inflammatory condition (Fig. 3a). Our results showed that retroviral transduction of FoxP3 was sufficient to generate high percentages of Treg‐like cells when compared with the control vector group (Supporting information, Fig. S3).
Fig. 3.
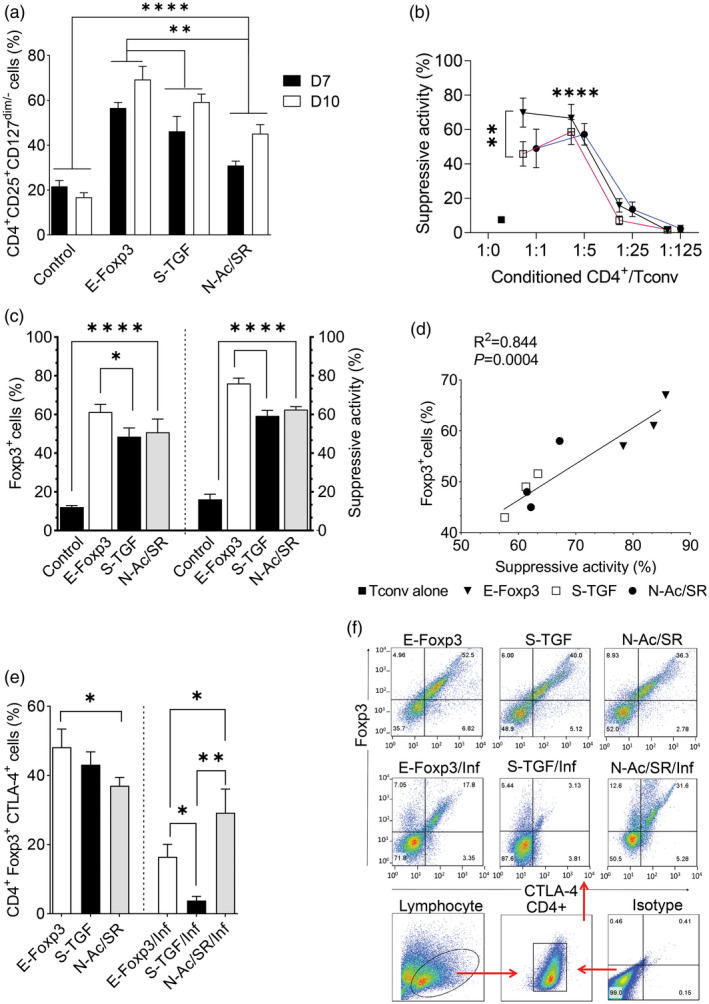
Comparison of ectopic expressions of forkhead box protein P3 (E‐FoxP3), soluble transforming growth factor‐β (S‐TGF) and N‐acetyl puromycin and SR1555 (N‐Ac/SR) protocols for de‐novo generation of regulatory T (Treg) cells. (a) In the three protocols, activated naive T cells responded with reduced levels of CD127 and differentiated towards Treg‐like cells [two‐way analysis of variance (anova)]. (b) Conditioned CD4+ was examined to determine the suppressive activity at different ratios of conditioned CD4+/conventional T (Tconv) cells (two‐way anova). (c) The percentages of FoxP3+ cells and suppressive activity in the selected ratio were compared between the three methods and the control group at day 10 (one‐way anova). (d) Correlations between the percentage of FoxP3+ cells and suppressive activity were determined by linear regression in the three different protocols. All samples were analyzed in duplicate. The results are presented as mean ± standard deviation. (e) Comparison of FoxP3+cytotoxic T lymphocyte antigen 4 (CTLA‐4+)‐generated cells according to the different methods under the inflammatory and non‐inflammatory conditions. (f) Representative flow cytometry plots of FoxP3+CTLA‐4+ cells in the different methods (one‐way anova). *P < 0·05; **P < 0·001; ***P = 0·0002; ****P < 0·0001; three to four donors in the independent experiments.
The proportion of Treg cells generated by the E‐FoxP3 protocol was significantly higher than the S‐TGF and N‐Ac/SR groups (Fig. 3a). We observed a similar suppressive activity of generated Treg‐like cells in different groups at the same ratio of conditioned CD4+/Tconv, with the exception of the 1 : 1 ratio (Fig. 3b). There was a significant difference between the 1 : 1 ratio and the other ratios (1 : 25 and 1 : 125), and also between the 1 : 5 ratio and the 1 : 25 and 1 : 125 ratios. A significant difference was observed between the E‐FoxP3 protocol and the other protocols at the 1 : 1 ratio (P = 0·009), while the suppressive activity was relatively similar at the 1 : 5 ratio (P = 0·189) (Fig. 3b). Therefore, in the following experiments, we reported all suppressive activities at the 1 : 5 ratio of conditioned CD4+/Tconv. Our data demonstrated that retroviral transduction of FoxP3 drove higher percentages of FoxP3+ cells with high suppressive activity in comparison with the other groups. Inhibition of T cell proliferation exerted by the generated Treg‐like cells was relatively equal in the S‐TGF and N‐Ac/SR groups at day 10 (Fig. 3c). Linear regression analysis showed that increased numbers of FoxP3+ cells significantly increased suppressive activity in all of the protocols (Fig. 3d). In addition, the percentage of CD4+FoxP3+CTLA‐4+ cells was higher in the E‐FoxP3 group compared with the other groups in the non‐inflammatory condition (Fig. 3e,f).
Treg cells generated with the ectopic E‐FoxP3 protocol showed relative resistance to instability under the inflammatory condition
We designed a Th‐17 polarizing condition (Inf) that consisted of IL‐6 and TGF‐β, and used it for IL‐17 producer cell polarization. After de‐novo Treg generation in the inflammatory condition, we observed a decrease in the percentage of Treg‐like cells. IL‐17 significantly increased in the S‐TGF group compared with the E‐FoxP3 group. The addition of IL‐6 profoundly decreased FoxP3+ cells and concurrently increased IL‐17A in TGF‐β‐iTreg‐like cells. E‐FoxP3‐iTreg‐like cells showed relative resistance to instability (Fig. 4a,b). Also, we observed a significant reduction in Treg‐like cell generation at day 7 compared to day 10 in the E‐FoxP3 group (Fig. 4a). This was accompanied by an increase in TGF‐β levels at day 10 compared to day 7 (Fig. 4c). We observed significantly more FoxP3+ cells in the E‐FoxP3 and SR groups than in the S‐TGF and N‐Ac groups (Fig. 4d). There was a significantly higher IL‐10 level in the supernatant of the E‐FoxP3 group compared to the S‐TGF group, but no significant difference in IFN‐γ secretion (Fig. 4e). There was a negative correlation in both the E‐FoxP3 and S‐TGF groups between FoxP3+ cells and IL‐17A secretion (Fig. 4f). There were significantly more IL‐17A producer cells in the S‐TGF group in the inflammatory condition, which showed high instability and low suppressive activity (Fig. 5a,b). Flow cytometry analysis showed a high percentage of CD4+IL‐17+FoxP3+ cells generated by the E‐FoxP3 method, whereas the S‐TGF method had greater capability to generate CD4+IL‐17+FoxP3− cells under the inflammatory condition (Fig. 5c,d).
Fig. 4.
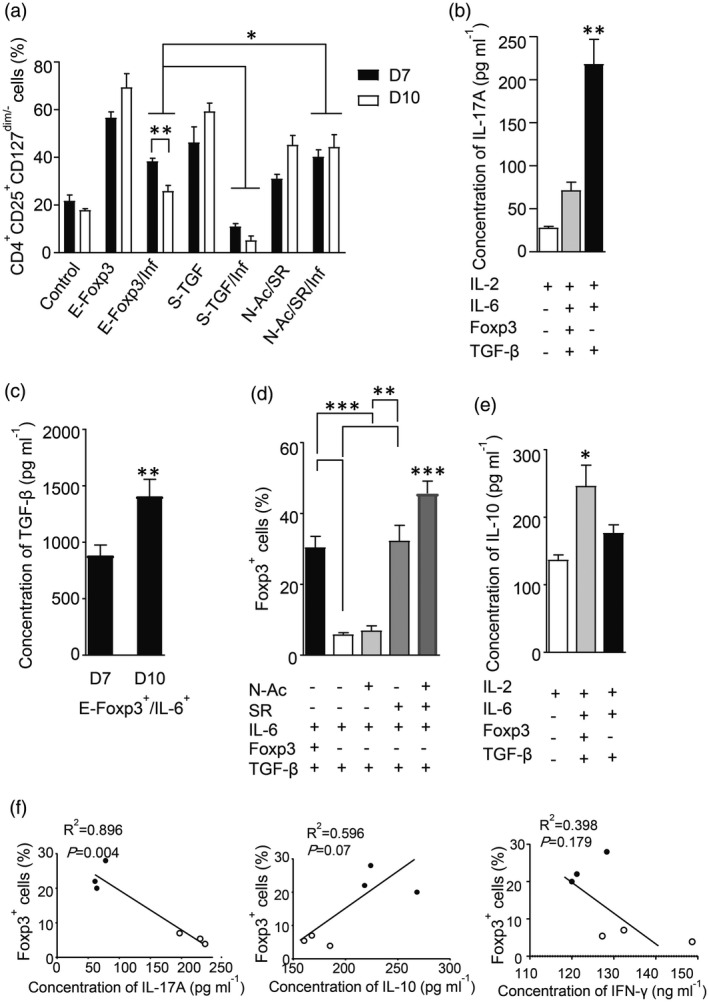
The protective and differentiation effects of SR1555 (SR) in the inflammatory condition. Three differentiation protocols were used to evaluate plasticity in de‐novo regulatory T (Treg) cells generated under inflammatory and non‐inflammatory conditions. (a) Differences in Treg generation between the three groups in the inflammatory and non‐inflammatory conditions [two‐way analysis of variance (anova)]. (b) The differences in interleukin (IL)‐17A concentrations between E‐FoxP3 and soluble transforming growth factor‐β (S‐TGF) groups (one‐way anova). (c) The differences in transforming growth factor‐β (TGF‐β) concentration at days 7 and 10 in the ectopic expression of FoxP3 (E‐FoxP3) group in the presence of interleukin (IL)‐6 (unpaired t‐test). (d) The differences in forkhead box protein P3 (FoxP3)+ cells in the inflammatory and non‐inflammatory conditions (one‐way anova). (e) The differences in IL‐10 concentrations between the E‐FoxP3 and soluble TGF‐β (S‐TGF) groups (one‐way anova). (f) Linear regression was used to determine the correlations between FoxP3 and IL‐17A, IL‐10 and interferon (IFN)‐γ. The results are presented as mean ± standard deviation. *P < 0·05; **P < 0·001; ***P = 0·0002; ****P < 0·0001; three to four donors in the independent experiments.
Fig. 5.
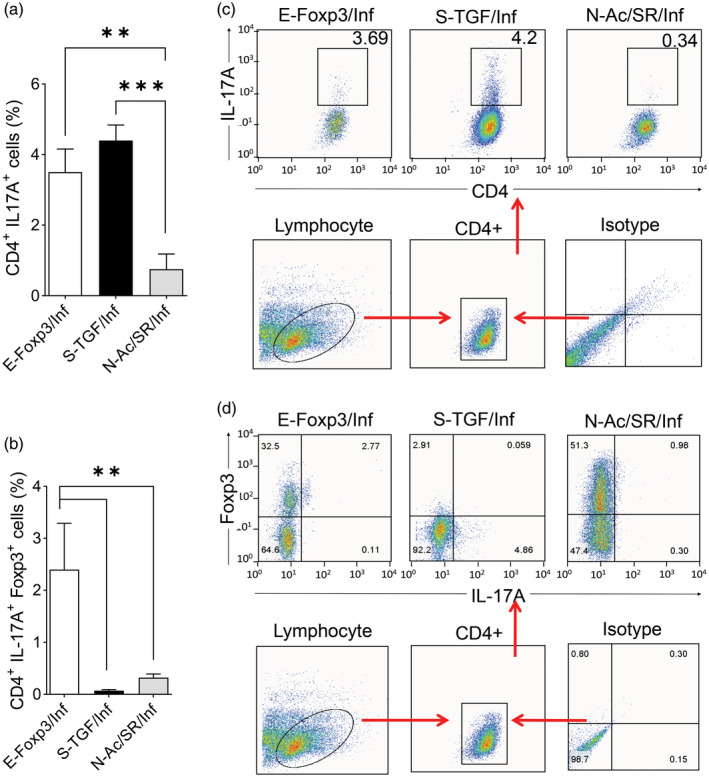
Flow cytometry characterization of the generated regulatory T (Treg)‐like cells based on interleukin (IL)‐17A and forkhead box protein P3 (FoxP3). (a) A comparison of the percentages of CD4+IL‐17A+ cells generated by ectopic expression of FoxP3 (E‐FoxP3), soluble transforming growth factor‐β (S‐TGF) and N‐acetyl puromycin and SR1555 (N‐Ac/SR) methods under the inflammatory condition [one‐way analysis of variance (anova)]; three to four donors in the independent experiments. (b) A comparison of the percentages of CD4+IL‐17A+FoxP3+ cells generated by E‐FoxP3, S‐TGF and N‐Ac/SR in the inflammatory condition (one‐way anova); three to four donors in the independent experiments. (c) Representative flow cytometry plots of CD4+IL‐17+ cells in the different methods. (d) Representative flow cytometry plots of CD4+IL‐17+FoxP3+ cells in the different methods; three to four donors in the independent experiments. *P < 0·05; **P < 0·001; ***P = 0·0002; ****P < 0·0001.
SR increased the percentages of Treg‐like cells and improved their suppressive activity during the inflammatory condition
In the presence of SR, both E‐FoxP3 and S‐TGF produced more Treg‐like cells (CD4+CD25+CD127dim/‐) under the inflammatory condition than the non‐inflammatory condition at day 10 (Fig. 6a,b).
Fig. 6.
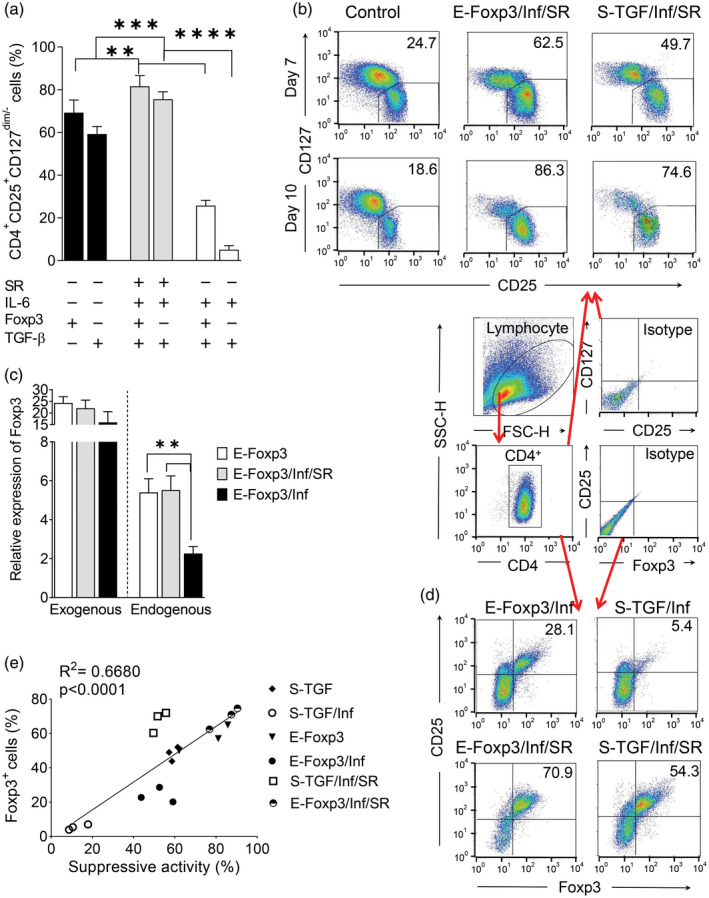
SR1555 (SR)‐enriched regulatory T (Treg) cells and increased the capacity for T cell suppression. (a) A comparison of Treg‐like cells generated by the ectopic expression of forkhead box protein P3 (E‐FoxP3) and soluble transforming growth factor‐β (S‐TGF) protocols under the non‐inflammatory and inflammatory conditions, with and without SR. (b) Flow cytometry analysis of the conditioned T cells to determine the percentages of the Treg‐like cell population according to CD4+CD25+CD127dim/‐ (c) Relative expression of exogenous and endogenous FoxP3 in the non‐inflammatory and inflammatory conditions, with and without SR [one‐way analysis of variance (anova)]. (d) Flow cytometry analysis of the conditioned T cells to determine the percentages of the Treg‐like cell population according to CD4+CD25+FoxP3+. (e) Linear regression to determine the correlation between FoxP3 and suppressive activity in the E‐FoxP3 and S‐TGF subgroups. The results are presented as mean ± standard deviation. *P < 0·05; **P < 0·001; ***P = 0·0002; ****P < 0·0001; three to four donors in the independent experiments.
The results showed that the inflammatory condition had a low influence on the retrovirus‐mediated forced expression of exogenous FoxP3 compared with an elevated influence observed on endogenous FoxP3 expression (Fig. 6c). In this study, a relatively high yield of FoxP3+ was obtained after the addition of SR to the E‐FoxP3 and S‐TGF groups (Fig. 6d). Linear regression analysis of the E‐FoxP3 and S‐TGF groups showed that the percentage of FoxP3+ cells was positively correlated with the suppressive activity in both the inflammatory and non‐inflammatory conditions (Fig. 6e). After 10 days, the relative expression of the FoxP3 was higher in the N‐Ac/SR group than the other groups. The TSDR region showed a similar methylation to the E‐FoxP3 and S‐TGF groups, and the control TSDR was completely demethylated (Fig. 7a,b). Based on the analysis of Th17 differentiation under the inflammatory condition, we observed significantly lower RORγ‐t expression in the N‐Ac/SR group compared with the other groups (Fig. 7b). In the N‐Ac/SR group, the RORγ‐t inverse agonist (SR) was responsible for instability prevention (Fig. 7b). The presence of exogenous FoxP3 in the E‐FoxP3/SR/Inf group resulted in increased FoxP3 expression compared to S‐TGF/SR/Inf, but this finding was not statistically significant (Fig. 7b).
Fig. 7.
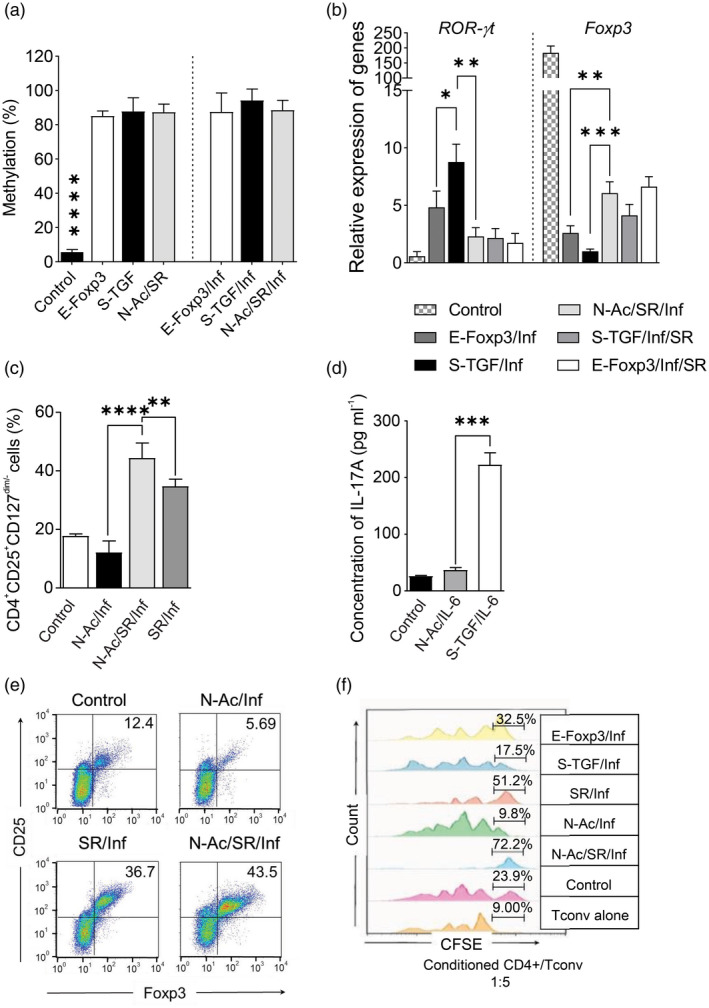
The combination of small molecules converts naive T cells into regulatory T (Treg) cells that show high suppressive activity in the inflammatory condition. (a) Analysis of Treg‐specific demethylation region (TSDR) demethylation in the generated Treg‐like cells by different methods under inflammatory and non‐inflammatory conditions. nTreg was used as the control [one‐way analysis of variance (anova)]. (b) The relative expressions of receptor‐related orphan receptor gamma (RORγ)‐t and forkhead box protein P3 (FoxP3) in Treg‐like cells generated by the different methods in the inflammatory condition; two to three donors in the independent experiments. nTreg was used as the control (one‐way anova). (c) De‐novo generation of Treg cells using small molecules in the presence of interleukin (IL)‐6 was compared in the three N‐acetyl puromycin and SR1555 (N‐Ac/SR) subgroups (one‐way anova). (d) IL‐17A levels were measured in the different N‐Ac/SR subgroups after 10 days in the inflammatory condition (one‐way anova). (e) CD25+FoxP3+ cells were identified by flow cytometry gating on CD4+ cells after 10 days in the inflammatory condition. (f) Suppressive activity was analyzed by carboxyfluorescein succinimidyl ester (CFSE) after 10 days. A comparison was made between the different N‐Ac/SR subgroups in the inflammatory condition. The results are presented as mean ± standard deviation. *P < 0·05; **P < 0·001; ***P = 0·0002; ****P < 0·0001; three to four donors in the independent experiments.
Synergistic effect of N‐Ac/SR on Treg cell generation in the inflammatory condition
We observed a significant increase in Treg‐like cells in the presence of N‐Ac/SR without exogenous TGF‐β and exogenous expression of FoxP3 compared to the control group (Fig. 3a and Supporting information, Fig. S4). The combined use of N‐Ac and SR generated higher levels of Treg‐like cells (CD4+FoxP3+CTLA‐4+ and CD4+CD25+CD127dim/‐) in the inflammatory condition compared to each compound individually (Figs. 3e, 7c). We sought to determine whether N‐Ac could be an alternative to TGF‐β in Treg instability. Therefore, we examined N‐Ac in the presence of IL‐6 without TGF‐β and compared it with the results obtained with S‐TGF. In the N‐Ac group in the presence of IL‐6 there were significantly fewer Treg‐like cells generated than the SR group, and the result was similar to S‐TGF. However, the level of IL‐17A was similar to the control group (Fig. 7d). We examined the potential for Treg generation by small molecules in the inflammatory condition for the SR/IL‐6, N‐Ac/IL‐6 and N‐Ac/SR/IL‐6 groups. There were high percentages of FoxP3+ cells in the N‐Ac/SR group after 10 days compared to the other groups (Fig. 7e). In both the inflammatory and non‐inflammatory conditions, N‐Ac/SR‐iTreg cells were at relatively the same level, and there was no significant difference between any two groups (Fig. 4a). A high suppressive capacity was observed for the Treg cells in the N‐Ac/SR group compared to the E‐FoxP3 and S‐TGF groups in the inflammatory condition (Fig. 7f and Supporting information, Fig. S5).
The combination of small molecules iTreg generation with lower instability during the naive/Treg co‐culture in the inflammatory condition
We examined the potential for the combination of small molecules in the de‐novo generation of Treg via a naive/Treg co‐culture system. We observed similar levels of generated Treg‐like cells in the non‐inflammatory condition. FoxP3+ cells were similar in the S‐TGF and N‐Ac/SR groups in the non‐inflammatory condition (Fig. 8a and Supporting information, Fig. S6). In the inflammatory condition, the S‐TGF group showed a significant decrease in the amount of Treg cells (Fig. 8a) and IL‐10 levels and a significant increase in IL‐17A levels compared to the N‐Ac/SR group (Fig. 8b). IFN‐γ levels significantly decreased in both the S‐TGF and N‐Ac/SR groups compared to the control group (Fig. 8b). Nevertheless, Treg suppressive activity was similar between the N‐Ac/SR and S‐TGF groups, and higher than the control group in the non‐inflammatory condition (Fig. 8c).
Fig. 8.
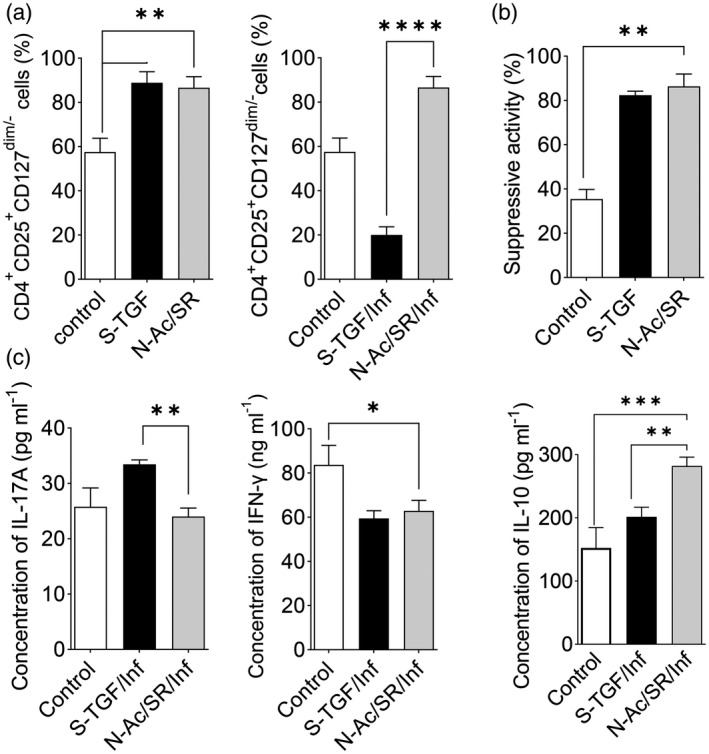
Different methods for regulatory T cell (Treg) differentiation in the co‐culture of naive T and nTreg cells. (a) In the co‐culture groups, CD25+forkhead box protein 3 (FoxP3+) cells were compared in two differentiation groups, soluble transforming growth factor‐β (S‐TGF) group and the N‐acetyl puromycin and SR1555 (N‐Ac/SR) group, under inflammatory and non‐inflammatory conditions [one‐way analysis of variance (anova)]. (b) In the co‐culture groups, the levels of interleukin (IL)‐17A, IL‐10 and interferon (IFN)‐γ were measured in the two groups after 10 days in the non‐inflammatory condition (one‐way anova). (c) Suppressive activity was analyzed by carboxyfluorescein succinimidyl ester (CFSE) after 10 days. A comparison was made between the N‐Ac/SR and S‐TGF protocols (one‐way anova). The results are presented as mean ± standard deviation. *P < 0·05; **P < 0·001; ***P = 0·0002; ****P < 0·0001; three to four donors in the independent experiments.
Discussion
Tregs are key immune cells associated with multiple immunomodulatory functions [2]. There is a shortage of Tregs, in particular for Treg immunotherapy. Therefore, de‐novo generation of Tregs from naive T cells is of great importance. [5, 23]. Due to the high costs of the current methods for Treg expansion, there is a need to define a cost‐effective protocol to generate these cells that would result in higher amounts of pure, safe and efficient Treg cells. There are immunopathological evidences which suggest that Treg cells are prone to functional instability towards an effector phenotype via down‐regulation of FoxP3 and production of inflammatory cytokines such as IL‐17A and IFN‐γ [24]. One possible solution could be the use of synthetic chemical inducers that can specifically contribute to Treg differentiation and prevent Treg inflammation‐mediated instability, instead of the currently used expensive cytokines and growth factors [25]. Therefore, we have attempted to develop a de‐novo generation protocol suitable for the production of high amounts of pure Treg cells that have an efficient suppressive activity and compare them with conventional routine Treg expansion protocols.
The differentiation of naive T cells into Treg cells requires an established TCR stimulation in the presence of IL‐2 [26]. Different concentrations of IL‐2 (30–200 IU/ml) have been used in vitro for naive T cell activation [27, 28, 29]. However, the optimum concentration of IL‐2 for activating a pool of undifferentiated naive T cells for the de‐novo generation of Treg cells remains unclear. Therefore, we optimized the activation of naive CD4+ T cells for Treg generation purposes. We observed that anti‐CD3/CD28 stimulation of naive T cells in the presence of 200 IU of IL‐2 for 24 h markedly increased FoxP3 expression and provided sufficient resources for de‐novo generation of Tregs.
Naive T cells could be used as precursors for the directed differentiation of Treg cells with normal suppressive activity via different techniques [8, 11, 30]. The E‐FoxP3 protocol could be one way to achieve a high yield of functional Treg‐like cells from naive T cells. Several studies have successfully generated de‐novo Tregs using this strategy and the results showed prolonged stability of achieved Tregs, including a study in which Treg deficiency occurred after a FOXP3 mutation and another study in which antigen‐specific Treg immunotherapy was performed [31, 32]. We reported a high‐yield generation of Tregs with the E‐FoxP3 protocol in the non‐inflammatory condition. These E‐FoxP3‐iTregs were relatively resistant to instability. Several studies have reported that the proinflammatory cytokine IL‐6 promotes Treg instability towards IL‐17A‐producing cells in the presence of TGF‐β. It is known that the functional repression of RORγ by FoxP3 is alleviated by IL‐6 [33]. Considerable synergy between TGF‐β and IL‐6 signaling to FoxP3 repression has been reported [34]. Combined IL‐6 and TGF‐β facilitate direct RORγ binding to the FoxP3 promoter, and plays a crucial role in skewed Treg differentiation towards Th17 cells [34, 35]. Most probably, the different promoter used in the exogenous FoxP3 construct (LTR) was responsible for the low instability in Tregs generated with E‐FoxP3 in the presence of IL‐6. Conversely, Tregs generated in the S‐TGF group were considerably affected by IL‐6. RORγ‐t had a higher expression than the other groups and there was a down‐regulation of FoxP3 expression, where Treg differentiation skewed into TH‐17. We assessed the three groups in terms of quantity of Treg cells and their suppressive activity after 10 days of culture. This comparison of generated CD4+FoxP3+ and CD4+FoxP3+CTLA‐4+ cells showed a highly significant difference between the groups. The E‐FoxP3‐iTreg‐like cells had superior suppression capabilities than the other groups. The differences in suppressive activity could be explained by the differences in the percentages of FoxP3+CTLA‐4+ cells.
Induction of high expression levels of endogenous FoxP3 in the presence of soluble TGF‐β in the culture media is an important strategy for de‐novo Treg generation [36]. We observed an increased level of IL‐17A in the S‐TGF group in the inflammatory condition, which indicated high Treg instability. There was significantly less IL‐17A in the E‐FoxP3 group compared with S‐TGF under the same condition. Our results supported previous research, which showed that transduced cells produced low levels of IL‐17A [37].
Although TGF‐β can generate Treg, limitations for the use of this strategy in clinical studies include unstable suppressive activity, risk of instability during inflammatory conditions and high cost of the cytokine for large‐scale Treg production [38]. Naive T cells have an increased differentiation potential towards the Treg phenotype in the presence of chemical inducers such as rapamycin (RAPA), vitamin D, retinoic acid and ROR‐inverse agonists [17, 25, 39, 40]. SR, a RORγ‐specific inverse agonist, has been used to block Th17 differentiation [14]. Solt et al. examined the effect of SR on Treg instability and reported that it inhibited IL‐17A production and induced FoxP3 expression in cultured Tregs [15]. Solt et al. observed a reduction in diabetes incidence and treatment of insulitis with oral administration of SR1001, a specific inverse agonist to RORα‐γ [14]. Here, we showed enhanced generation of iTreg cells in the presence of small molecules in the inflammatory condition, which represented an acceptable suppressive activity while the TSDR region was highly methylated. Recently, iTreg were generated by the combination of small molecules that included RAPA, all‐trans retinoic acid (ATRA) and TGF‐β. Although these were not demethylated in the TSDR region, they exhibited an elevated suppressive activity in vitro [41]. Because Treg stability is associated with TSDR demethylation and subsequent continuative FoxP3 expression, in‐vivo therapeutic applications of Treg cells that have high suppressive activity under inflammatory conditions should be a future goal.
Recently, Bing and co‐workers have shown that AS101, as an organotellurium compound, increased Treg generation independently of TGF‐β [42]. According to our results, in the presence of SR, Treg generation was promoted and its instability was abrogated.
Down‐regulation of TGF‐β signaling is under the control of Sloan‐Kettering Institute (Ski) and Ski novel (SnoN), which are disrupted by N‐Ac. Thus, this small molecule can act as a TGF‐β signaling booster [43]. Due to the TGF‐ β signaling, the consecutive transduction of TGF‐β signaling is controlled by the expression of SnoN expression during the negative feedback. [44]. Recently, Hernández‐Damián et al. reported that N‐Ac down‐regulated Ski and SnoN and promoted TGF‐β signaling [43]. Despite this, the potential of N‐Ac for Treg generation and expansion is unclear.
We observed that instability did not occur in the presence of IL‐6 and N‐Ac, while the combination of SR and N‐Ac significantly increased the de‐novo generation of Treg cells, particularly in the inflammatory condition.
Naive T cells can also be differentiated into Tregs through a co‐culture of Tregs [45]. We examined the ability of N‐Ac/SR to generate Tregs in a co‐culture and observed the high capability of N‐Ac/SR to generate Tregs, particularly in the Th17 polarizing condition.
Conclusion
We propose a new cost‐effective protocol to overcome the low yield of Tregs and its undesired instability. These generated Treg‐like cells exogenously expressed FoxP3 and showed moderate resistance to instability in the presence of IL‐6. The N‐Ac/SR‐generated Tregs were completely resistant to IL‐6. SR selectively inhibited Treg instability and increased the Treg phenotype with elevated suppressive activity in the three different protocols. Our results suggested that SR could be an acceptable supplement for Treg differentiation and expansion, while it negatively regulated Treg instability. The synergistic effects of SR and N‐Ac indicated that their simultaneous use might have considerable effects in the clinical setting for improvements in Treg purity, yield and efficacy in inflammatory conditions such as autoimmunity and allotransplantation. The advantages of this new protocol include high yield, prevention of Treg instability, superior suppressive activity, easily exploitable and cost‐effectiveness. However, its clinical application requires additional investigation. The results of this study further support the clinical development of SR and N‐Ac.
Conflict of interests
The authors have no conflicts of interest.
Supporting information
Fig. S1. Different levels of forkhead box protein P3 (FoxP3)+ cells in different concentrations of IL‐2. The abundance of FoxP3+ cells after naïve T cell activation for 1:3 cells/beads at 100 and 200 IU/ml IL‐2 as analyzed by flow cytometry.
Fig. S2. Optimization of efficient transduction method. Double transduction was performed in order to obtain a high transduction rate. Different levels of forkhead box protein P3 (FoxP3)+ cells in different concentrations of IL‐2. The abundance of FoxP3+ cells after naïve T cell activation for 1:3 cells/beads at 100 and 200 IU/ml IL‐2 as analyzed by flow cytometry.
Fig. S3. Comparison of percentages of Treg‐like cell in E‐FoxP3 and control, control vector groups.
Fig. S4. Regulatory T (Treg) cell generation from naïve T cells via a combination of small molecules. (a) The percentage of the regulatory T (Treg) cell phenotype as determined by flow cytometry. (b) Comparison of suppressive activities between the N‐acetyl puromycin and SR1555 (N‐Ac/SR) group and the control group. Conventional T (Tconv) cells were the negative control.
Fig. S5. Representative plots of suppressive activity.
Fig. S6. CD4+CD25+FoxP3+ regulatory T (Treg) cell generation during naïve/Treg cell co‐culture. The level of FoxP3+ cells was similar in the soluble TGF‐β (S‐TGF) and N‐acetyl puromycin and SR1555 (N‐Ac/SR) groups. The combination of small molecules considerably increased forkhead box protein P3 (FoxP3)+ levels compared with the control group.
Acknowledgment
M.‐H.H. wrote the original draft and created the figures and tables. M‐H.H. and E.H.‐S participated in the study design. M.‐H.H. and H.D. performed the RT–PCR analysis. E.H.‐S., H.B. and B.N. reviewed and edited the final manuscript. All authors approved the final manuscript. This study was supported by the Royan Institute of Stem Cell Biology and Technology (96030204 RFCT), Tehran University of Medical Sciences (9321437002) and the Royan Stem Cell Technology Company (95000278).
Contributor Information
B. Negahdari, Email: b-negahdari@tums.ac.ir.
E. Hajizadeh‐Saffar, Email: Hajizadeh.ehs@royaninstitute.org.
H. Baharvand, Email: Baharvand@Royaninstitute.org.
References
- 1. Kalekar LA, Schmiel SE, Nandiwada SL et al CD4+ T cell anergy prevents autoimmunity and generates regulatory T cell precursors. Nat Immunol 2016; 17:304–14. [DOI] [PMC free article] [PubMed] [Google Scholar]
- 2. Lu L, Barbi J, Pan F. The regulation of immune tolerance by FOXP3. Nat Rev Immunol 2017; 17:703–17. [DOI] [PMC free article] [PubMed] [Google Scholar]
- 3. Romano M, Fanelli G, Albany CJ, Giganti G, Lombardi G. Past, Present, and future of regulatory T cell therapy in transplantation and autoimmunity. Front Immunol 2019; 10:43. [DOI] [PMC free article] [PubMed] [Google Scholar]
- 4. Gregori S, Passerini L, Roncarolo M‐G. Clinical outlook for type‐1 and FOXP3+ T regulatory cell‐based therapy. Front Immunol 2015; 6:593. [DOI] [PMC free article] [PubMed] [Google Scholar]
- 5. Bluestone JA, Buckner JH, Fitch M et al Type 1 diabetes immunotherapy using polyclonal regulatory T cells. Sci Transl Med 2015; 7:315ra189. [DOI] [PMC free article] [PubMed] [Google Scholar]
- 6. Gitelman SE, Bluestone JA. Regulatory T cell therapy for type 1 diabetes: may the force be with you. J Autoimmun 2016; 71:78–87. [DOI] [PubMed] [Google Scholar]
- 7. Passos GRD, Sato DK, Becker J, Fujihara K. Th17 cells pathways in multiple sclerosis and neuromyelitis optica spectrum disorders: pathophysiological and therapeutic implications. Mediat Inflamm 2016; 2016:1–11. [DOI] [PMC free article] [PubMed] [Google Scholar]
- 8. Wing K, Onishi Y, Prieto‐Martin P et al CTLA‐4 control over FoxP3+ regulatory T cell function. Science 2008; 322:271–5. [DOI] [PubMed] [Google Scholar]
- 9. Lal G, Zhang N, Van Der Touw W et al Epigenetic regulation of FoxP3 expression in regulatory T cells by DNA methylation. J Immunol 2009; 182:259–73. [DOI] [PMC free article] [PubMed] [Google Scholar]
- 10. Ito T, Hanabuchi S, Wang Y‐H et al Two functional subsets of FOXP3+ regulatory T cells in human thymus and periphery. Immunity 2008; 28:870–80. [DOI] [PMC free article] [PubMed] [Google Scholar]
- 11. Fantini MC, Becker C, Monteleone G, Pallone F, Galle PR, Neurath MF. Cutting edge: TGF‐β induces a regulatory phenotype in CD4+ CD25− T cells through FoxP3 induction and down‐regulation of Smad7. J Immunol 2004; 172:5149–53. [DOI] [PubMed] [Google Scholar]
- 12. Rossetti M, Spreafico R, Saidin S et al Ex vivo‐expanded but not in vitro‐induced human regulatory T cells are candidates for cell therapy in autoimmune diseases thanks to stable demethylation of the FOXP3 regulatory T cell‐specific demethylated region. J Immunol 2015; 194:113–24. [DOI] [PMC free article] [PubMed] [Google Scholar]
- 13. Bettelli E, Carrier Y, Gao W et al Reciprocal developmental pathways for the generation of pathogenic effector T H 17 and regulatory T cells. Nature 2006; 441:235–8. [DOI] [PubMed] [Google Scholar]
- 14. Solt LA, Banerjee S, Campbell S, Kamenecka TM, Burris TP. ROR inverse agonist suppresses insulitis and prevents hyperglycemia in a mouse model of type 1 diabetes. Endocrinology 2015; 156:869–81. [DOI] [PMC free article] [PubMed] [Google Scholar]
- 15. Solt LA, Kumar N, He Y, Kamenecka TM, Griffin PR, Burris TP. Identification of a selective RORγ ligand that suppresses Th17 cells and stimulates T regulatory cells. ACS ChemBiol 2012; 7:1515–19. [DOI] [PMC free article] [PubMed] [Google Scholar]
- 16. Dwivedi M, Kumar P, Laddha NC, Kemp EH. Induction of regulatory T cells: a role for probiotics and prebiotics to suppress autoimmunity. Autoimmun Rev 2016; 15:379–92. [DOI] [PubMed] [Google Scholar]
- 17. Liu Y, Qin T, Zhao X et al Skewed balance of regulatory T cell and inflammatory T cell in IL‐17 defect with human metapneumovirus infection. Cell Immunol 2018; 331:161–7. [DOI] [PubMed] [Google Scholar]
- 18. Melnik B, John S, Chen W, Plewig G. T helper 17 cell/regulatory T‐cell imbalance in hidradenitis suppurativa/acne inversa: the link to hair follicle dissection, obesity, smoking and autoimmune comorbidities. Br J Dermatol 2018; 179:260–72. [DOI] [PubMed] [Google Scholar]
- 19. Dons EM, Raimondi G, Cooper DK, Thomson AW. Induced regulatory T cells: mechanisms of conversion and suppressive potential. Hum Immunol 2012; 73:328–34. [DOI] [PMC free article] [PubMed] [Google Scholar]
- 20. Zafari P, Yari K, Mostafaei S et al Analysis of Helios gene expression and FoxP3 TSDR methylation in the newly diagnosed rheumatoid arthritis patients. Immunol Invest 2018; 47:632–42. [DOI] [PubMed] [Google Scholar]
- 21. Kehrmann J, Zeschnigk M, Buer J et al FOXP3 expression in GARP‐transduced helper T cells is not associated with FOXP3 TSDR demethylation. Transfus Med Hemoth 2011; 38:287–91. [DOI] [PMC free article] [PubMed] [Google Scholar]
- 22. Ogino S, Kawasaki T, Brahmandam M et al Precision and performance characteristics of bisulfite conversion and real‐time PCR (MethyLight) for quantitative DNA methylation analysis. J Mol Diagn 2006; 8:209–17. [DOI] [PMC free article] [PubMed] [Google Scholar]
- 23. Qiu R, Zhou L, Ma Y et al Regulatory T cell plasticity and stability and autoimmune diseases. Clin Rev Allergy Immunol 2020; 58:52–70. [DOI] [PubMed] [Google Scholar]
- 24. d’Hennezel E, Piccirillo CA. Functional plasticity in human FOXP3+ regulatory T cells: implications for cell‐based immunotherapy. Hum Vaccin Immunother 2012; 8:1001–5. [DOI] [PubMed] [Google Scholar]
- 25. MacDonald KN, Piret JM, Levings MK. Methods to manufacture regulatory T cells for cell therapy. J Clin Exp Immunol 2019; 196:1–17. [DOI] [PMC free article] [PubMed] [Google Scholar]
- 26. Guo F, Iclozan C, Suh W‐K, Anasetti C, Yu X‐Z. CD28 controls differentiation of regulatory T cells from naive CD4 T cells. J Immunol 2008; 181:2285–91. [DOI] [PMC free article] [PubMed] [Google Scholar]
- 27. Dong C, Yang DD, Tournier C et al JNK is required for effector T‐cell function but not for T‐cell activation. Nature 2000; 405:91–4. [DOI] [PubMed] [Google Scholar]
- 28. Moura J, Rodrigues J, Gonçalves M, Amaral C, Lima M, Carvalho E. Impaired T‐cell differentiation in diabetic foot ulceration. Cell Mol Immunol 2017; 14:758. [DOI] [PMC free article] [PubMed] [Google Scholar]
- 29. Scott DW, Kim YC. Design and use of specific regulatory t‐cells to induce immune tolerance (US20190203174A1). Google Patents 2019. [Google Scholar]
- 30. Kopf H, Gonzalo M, Howard OZ, Chen X. Rapamycin inhibits differentiation of Th17 cells and promotes generation of FoxP3+ T regulatory cells. Int Immunopharmacol 2007; 7:1819–24. [DOI] [PMC free article] [PubMed] [Google Scholar]
- 31. Hori S, Nomura T, Sakaguchi S. Control of regulatory T cell development by the transcription factor FoxP3. Science 2003; 299:1057–61. [DOI] [PubMed] [Google Scholar]
- 32. Tenspolde M, Zimmermann K, Weber LC et al Regulatory T cells engineered with a novel insulin‐specific chimeric antigen receptor as a candidate immunotherapy for type 1 diabetes. J Autoimmun 2019; 103:102289. [DOI] [PubMed] [Google Scholar]
- 33. Korn T, Mitsdoerffer M, Croxford AL et al IL‐6 controls Th17 immunity in vivo by inhibiting the conversion of conventional T cells into FoxP3+ regulatory T cells. Proc Natl Acad Sci USA 2008; 105:18460–5. [DOI] [PMC free article] [PubMed] [Google Scholar]
- 34. Samanta A, Li B, Song X et al TGF‐β and IL‐6 signals modulate chromatin binding and promoter occupancy by acetylated FOXP3. Proc Natl Acad Sci USA 2008; 105:14023–7. [DOI] [PMC free article] [PubMed] [Google Scholar]
- 35. Gao Z, Gao Y, Li Z et al Synergy between IL‐6 and TGF‐β signaling promotes FOXP3 degradation. Int J Clin Exp Pathol 2012; 5:626–33. [PMC free article] [PubMed] [Google Scholar]
- 36. Li MO, Sanjabi S, Flavell RA. Transforming growth factor‐β controls development, homeostasis, and tolerance of T cells by regulatory T cell‐dependent and‐independent mechanisms. Immunity 2006; 25:455–71. [DOI] [PubMed] [Google Scholar]
- 37. Wang Y, Souabni A, Flavell RA, Wan YY. An intrinsic mechanism predisposes FoxP3‐expressing regulatory T cells to Th2 conversion in vivo. J Immunol 2010; 185:5983–92. [DOI] [PMC free article] [PubMed] [Google Scholar]
- 38. Allan SE, Alstad AN, Merindol N et al Generation of potent and stable human CD4+ T regulatory cells by activation‐independent expression of FOXP3. Mol Ther 2008; 16:194–202. [DOI] [PubMed] [Google Scholar]
- 39. Kang SW, Kim SH, Lee N et al 1, 25‐Dihyroxyvitamin D3 promotes FOXP3 expression via binding to vitamin D response elements in its conserved noncoding sequence region. J Immunol 2012; 188:5276–82. [DOI] [PMC free article] [PubMed] [Google Scholar]
- 40. Sun X, Xiao Y, Zeng Z et al All‐trans retinoic acid induces CD4+ CD25+ FOXP3+ regulatory T cells by increasing FOXP3 demethylation in systemic sclerosis CD4+ T Cells. J Immunol Res 2018; 2018:1–7. [DOI] [PMC free article] [PubMed] [Google Scholar]
- 41. Schmidt A, Eriksson M, Shang M‐M et al Comparative analysis of protocols to induce human CD4+ FoxP3+ regulatory T cells by combinations of IL‐2, TGF‐beta, retinoic acid, rapamycin and butyrate. PLOS ONE 2016; 11:1–9. [DOI] [PMC free article] [PubMed] [Google Scholar]
- 42. Bing SJ, Shemesh I, Chong WP et al AS101 ameliorates experimental autoimmune uveitis by regulating Th1 and Th17 responses and inducing Treg cells. J Autoimmun 2019; 100:52–61. [DOI] [PMC free article] [PubMed] [Google Scholar]
- 43. Hernández‐Damián J, Tecalco‐Cruz AC, Ríos‐López DG et al Downregulation of SnoN oncoprotein induced by antibiotics anisomycin and puromycin positively regulates transforming growth factor‐β signals. Biochim Biophys Acta Gen Subj 2013; 1830:5049–58. [DOI] [PubMed] [Google Scholar]
- 44. Massagué J, Wotton D. Transcriptional control by the TGF‐β/Smad signaling system. EMBO J 2000; 19:1745–54. [DOI] [PMC free article] [PubMed] [Google Scholar]
- 45. Guereschi MG, Araujo LP, Maricato JT et al Beta2‐adrenergic receptor signaling in CD 4+ F oxp3+ regulatory T cells enhances their suppressive function in a PKA‐dependent manner. Eur J Immunol 2013; 43:1001–12. [DOI] [PubMed] [Google Scholar]
Associated Data
This section collects any data citations, data availability statements, or supplementary materials included in this article.
Supplementary Materials
Fig. S1. Different levels of forkhead box protein P3 (FoxP3)+ cells in different concentrations of IL‐2. The abundance of FoxP3+ cells after naïve T cell activation for 1:3 cells/beads at 100 and 200 IU/ml IL‐2 as analyzed by flow cytometry.
Fig. S2. Optimization of efficient transduction method. Double transduction was performed in order to obtain a high transduction rate. Different levels of forkhead box protein P3 (FoxP3)+ cells in different concentrations of IL‐2. The abundance of FoxP3+ cells after naïve T cell activation for 1:3 cells/beads at 100 and 200 IU/ml IL‐2 as analyzed by flow cytometry.
Fig. S3. Comparison of percentages of Treg‐like cell in E‐FoxP3 and control, control vector groups.
Fig. S4. Regulatory T (Treg) cell generation from naïve T cells via a combination of small molecules. (a) The percentage of the regulatory T (Treg) cell phenotype as determined by flow cytometry. (b) Comparison of suppressive activities between the N‐acetyl puromycin and SR1555 (N‐Ac/SR) group and the control group. Conventional T (Tconv) cells were the negative control.
Fig. S5. Representative plots of suppressive activity.
Fig. S6. CD4+CD25+FoxP3+ regulatory T (Treg) cell generation during naïve/Treg cell co‐culture. The level of FoxP3+ cells was similar in the soluble TGF‐β (S‐TGF) and N‐acetyl puromycin and SR1555 (N‐Ac/SR) groups. The combination of small molecules considerably increased forkhead box protein P3 (FoxP3)+ levels compared with the control group.


