

SUMMARY
Background:
COVID-19 is a new disease which has become a global pandemic, and is caused by a novel coronavirus, SARS-CoV-2. The disease is still not very well characterized, and factors associated with severe clinical course are not well known.
Methods:
The main objectives were to determine the demographic, clinical and laboratory manifestations of COVID-19 and to identify the factors associated with severe clinical course. We searched the PubMed for studies published between Jan 1, 2020 and Mar 17, 2020, and included them if they were in English language, published in full, were retrospective or prospective observational or case control study with data on clinical, laboratory and imaging features of adult patients with COVID-19 disease from single or multiple centers. Studies that included exclusively pediatric patients were excluded. The demographic, clinical and laboratory data was displayed as n (%) or mean (SD). The meta-analysis on factors associated with severe clinical course was performed using the random effects model, and odds ratios (ORs) with 95% confidence intervals (CIs) were calculated as the effect sizes.
Findings:
We included 58 studies (6892 patients) for the systematic review on clinical manifestations and 21 studies (3496 patients) for meta-analysis on factors associated with severe clinical course. The mean age of patients with COVID-19 is 49.7±16.3 years with a male to female ratio of 1.2:1. Common symptoms and their frequency are: fever (83.4%), cough (60.5%), fatigue (33.8%), sputum (28.9%), dyspnea (22.1%), myalgia (20.6%), chest tightness / pain (16.3%), sore throat (13.5%), headache (11.2%), diarhhea (7.5%), nasal congestion / rhinorrhea (6.7%), nausea / vomiting (5.6%), pain abdomen (4.6%), and hemoptysis (1.7%). The comorbidities associated with COVID-19 are: hypertension (18.4%), diabetes mellitus (9.8%), cardiovascular diseases (8.8%), endocrine diseases (5.8%), gastrointestinal diseases (5%), CLD (3%), and COPD (2.8%). Among the laboratory parameters WBC was low in 27%, high in 9%, platelets were low in 22.9%, creatinine was high in 6.5%, AST was high in 25.3%, ALT was high in 22.7%, bilirubin was high in 8.8%, albumin was low 60.1%, CT chest was abnormal in 89%, CRP was high in 67.5%, LDH was high in 52%, D-dimer was high in 34.8%, CK was high in 14.4%, and procalcitonin was high in 15.4%. Factors significantly associated severe clinical course (with their ORs) are as follows: High CRP (5.78), high procalcitonin (5.45), age >60 (4.82), dyspnea (4.66), high LDH (4.59), COPD (4.37), low albumin (4.34), high D-dimer (4.03), cardiac disease (3.88), low lymphocyte count (3.22), any associated comorbidity (3.16), diabetes mellitus (3.11), high WBC count (2.67), high bilirubin level (2.55), high creatinine (2.34), high AST (2.31), hypertension (2.30), low platelets (1.78), High ALT (1.69), high CK (1.66), fever spikes ≥39°C (1.59), diarrhea (1.55), male gender (1.47), and sputum (1.35).
Interpretation:
Identification of these factors associated with severe COVID-19 will help the physicians working at all levels of healthcare (primary, secondary, tertiary and ICU) in determining which patients need home care, hospital care, HDU care, and ICU admission; and thus, prioritize the scarce healthcare resource use more judiciously. Many of these identified factors can also help the public at large in the current COVID-19 epidemic setting, to judge when they should seek immediate medical care.
Keywords: Coronavirus, 2019-nCoV, nCoV-2019, novel coronavirus, SARS-CoV-2, COVID-19
INTRODUCTION
COVID-19 is a new disease, which within three months of its origin, has now spread to more than 177 countries around the world, affecting more than 724,000 people and caused more than 34,000 deaths, as of 30th March, 20201. The World Health Organization (WHO) has declared COVID-19 a pandemic because of alarming levels of its spread and severity2. It is caused by SARS-CoV-2, which is sufficiently genetically divergent from SARS-CoV to be considered a new human-infecting betacoronavirus3. It mainly affects the respiratory tract and the illness ranges in severity from asymptomatic or mild to severe or critical disease. Although the current estimate of the case fatality rate of COVID-19 is <5%, up to 15–18% of patients may become severe or critically ill, some of them requiring ICU care and mechanical ventilation4.
Knowledge of this disease is still incomplete and evolving. Many retrospective case series have been published on clinical, laboratory and imaging manifestations of COVID-19. However, most of these case series have small sample size, and the data in them are heterogenous and conflicting. A few meta-analyses have also been published on clinical manifestations of COVID-19, however, these meta-analyses have either included small number of studies with limited number of patients5–7, or have included patients from the database of Chinese Center for Disease Control and Prevention8, which has a significant overlap of patients from other studies4,9. In addition, since many patients with COVID-19 have rapid course and within days may require ICU admission and mechanical ventilation, so, it is essential to identify early which patients are likely go into severe clinical course. To the best of our knowledge, no meta-analysis has been published studying the factors associated with severe clinical course.
Hence, this systematic review and meta-analysis was conducted with following objectives: (1) to study the demographic, clinical and laboratory manifestations of COVID-19; and (2) to determine the factors associated with severe clinical course of COVID-19.
MATERIALS AND METHODS
The PRISMA (Preferred Reporting Items for Systematic Reviews and Meta-Analyses) statement and guidelines were consulted during the stages of design, analysis, and reporting of this systematic review10,11. Since, this is a systematic review and meta-analysis, therefore an ethics committee and/or institutional board approval was not required.
Study Selection
Relevant papers in English language were searched in PubMed database using the following keywords: “2019-nCoV”, “nCoV-2019”, “Novel Coronavirus 2019”, “SARS-CoV-2”, “COVID-19”, “coronavirus”, “coronavirus covid-19”, and “corona virus”. The last search was performed on March 17, 2020. Since the first report of COVID-19 disease was published on 31st December, 201912, we limited our search to articles published only in 2020. Since there is a high likelihood of duplicate publications on COVID-1913, especially, same set of patients being reported in English as well as Chinese or other languages, hence we restricted our search to papers published in English language only. For the same reason we restricted our search to PubMed database only and did not search other databases.
The eligibility criteria for inclusion of studies were as follows:
The studies should be in English language;
The studies should be published in full; studies published only in abstract form (such as conference abstracts) were excluded;
the study design should be retrospective or prospective observational or case control study with data on clinical, laboratory and imaging features of COVID-19 disease from single or multiple centers; meta-analyses and systematic reviews were excluded;
the participants should be adult patients with COVID-19 disease. Studies describing exclusively pediatric population were excluded, however, studies which had both adult and pediatric patients were included.
Data extraction
The following data were extracted from each study: date of online publication, number of patients, study setting, demographic data, comorbidities, presenting symptoms, laboratory and imaging features, number of patients having severe and good clinical course. Following criteria was used to identify patients having ‘severe clinical course’:
Patients requiring ICU care; or
Patients developing ARDS, shock, respiratory failure, or those requiring mechanical ventilation as defined according to the guidance of WHO for COVID-1914;
Patients categorized as severe or critical groups according to the diagnostic and treatment guideline for SARS-CoV-2 issued by the National Health Commission of the People’s Republic of China (version 3–5)15,16; or
Patients not surviving.
Patients not having any of the feature of ‘severe clinical course’ were categorized into ‘good clinical course’. The baseline clinical and laboratory features of patients with severe clinical course and good clinical course were tabulated separately and compared using appropriate statistical methods. For studies with missing data, the corresponding authors of those studies were contacted with a request to provide the missing data.
Assessment of quality of studies
For the assessment of quality of studies, the National Institute of Health (NIH) tools were used, which were developed jointly by the National Heart, Lung and Blood Institute (NHLBI) and the Research Triangle Institute International17. For the first objective of this meta-analysis, i.e. to study the demographic, clinical and laboratory manifestations of COVID-19, the NIH tool for case series was used. It uses nine domains and based on them each study was given an overall rating of good, fair or poor, depending on ‘yes’ response in ≥7 domains, 4–6 domains, and <4 domains, respectively. For the second objective of this meta-analysis, i.e. to determine the factors associated with severe clinical course of COVID-19, the NIH tool for case-control studies was used. It uses twelve domains and based on them each study was given an overall rating of good, fair or poor, depending on ‘yes’ response in ≥8 domains, 6–7 domains, and <6 domains, respectively.
Statistical analysis
The demographic, clinical and laboratory data was displayed as n (%) or mean (SD). For data with median, IQR or range, the method described by Wan et al was used to calculate mean and SD18. The meta-analysis was performed using odds ratios (ORs) with 95% confidence intervals (CIs) as the effect sizes of dichotomous data. To assess the heterogeneity among studies I2 statistic was calculated. An I2 value >50% indicated substantial heterogeneity. The ORs were pooled using only the random effects model to calculate a more conservative result and to take care of heterogeneity among the studies. In addition, if the heterogeneity among the studies was ≥50%, a sensitivity analysis was also performed after removing the outlier studies. To obtain odds ratios from continuous data (from standardized mean difference) Hasselblad and Hedges’ method was used19. A p value of <0.05 was considered statistically significant to show a meaningful difference in the outcomes. Review Manager version 5.3.5 software (The Nordic Cochrane Centre, Copenhagen, Denmark), OpenMetaAnalyst software (version 10.12)20 and Microsoft Excel (version 16.35) were employed for the meta-analysis and statistical analyses.
RESULTS
Study selection and data collection
Using the keywords “2019-nCoV”, “nCoV-2019”, “Novel Coronavirus 2019”, “SARS-CoV-2”, “COVID-19”, “coronavirus”, “coronavirus covid-19”, and “corona virus” and limiting the Entrez date from 01-Jan-2020 to 17-Mar-2020 in the PubMed database, initially 1155 publications in English language were retrieved, which were screened for relevance (Figure 1). After carefully going through the abstracts and full texts of these publications only 69 potentially relevant studies were evaluated in detail for potential inclusion. Of these 11 studies were excluded because of the following reasons: (1) The study by Chung M et al21 was excluded because of possible overlap with patients in the study by Bernheim et al22; (2) The study by Ki M et al23 was excluded because of possible overlap with patients in the study by CNERC24; (3) The study by Chen H et al25 was excluded because it included only pregnant patients; (4) The study by Yoon SH et al26 was excluded because there was no clinical data; (5) The study by Liu H et al27 was excluded as its primary focus was pregnant women and children; (6) The study by Xu T et al28 was excluded as it was a comparative study between imported, secondary and tertiary cases; (7) The study by Qu R et al29 was excluded as it was comparison of platelet-to-lymphocyte ratio between severe and non-severe patients; (8) The study by To KK et al30 was excluded as the main focus of the study was detection of novel coronavirus in saliva; (9) The study by Pan Y et al31 was excluded as its main focus was CT scan findings with no clinical data; (10) The study by Pan F et al32 was excluded because it included only recovered patients, and had excluded patients with severe disease; and (11) The study by Liang W et al33 was excluded because it included only cancer patients. Hence, remaining 58 studies were included in the systematic review. Figure 1 summarizes the systematic review flow.
Figure 1:

PRISMA flow diagram depicting the flow of information through different phases of a systematic review.
Characteristics and quality of the included studies
The study characteristics of the included 58 studies are given in Table 1. The total number of included patients in these 58 studies was 6892. Thirty-five out of 58 (60%) studies were from single centres, while remaining 23 (40%) were multi-centre studies. Most studies (53/58, 91%) were from mainland China, and of the remaining 5 studies, one (1.7%) each was from Hong Kong, Singapore, South Korea, Australia and Europe, respectively. Thus 97.5% (6723/6892) of included patients were from mainland China.
Table 1:
Characteristics and quality of included studies.
| Author | Date of publication | Number of patients | Study setting | Study quality |
|---|---|---|---|---|
| Huang C et al44 | Jan 24, 2020 | 41 | Single centre in Wuhan, Hubei Province, China | Good |
| Chan JF et al45 | Jan 24, 2020 | 6 | Single centre in Shenzhen, Guangdong Province, China | Good |
| Li Q et al46 | Jan 29, 2020 | 425 | Multi-centre in Wuhan, Hubei Province, China | Good |
| Chen N et al47 | Jan 30, 2020 | 99 | Single centre in Wuhan, Hubei Province, China | Good |
| Song F et al48 | Feb 6, 2020 | 51 | Single centre in Shanghai, China | Good |
| Wang D et al49 | Feb 7, 2020 | 138 | Single centre in Wuhan, Hubei Province, China | Good |
| Liu K et al50 | Feb 7, 2020 | 137 | Nine tertiary hospitals in Hubei Province, China | Good |
| Chang et al51 | Feb 7, 2020 | 13 | Three hospitals in Beijing, China | Good |
| Liu Y et al52 | Feb 9, 2020 | 12 | Single centre in Shenzhen, Guangdong Province, China | Good |
| Ren LL et al53 | Feb 11, 2020 | 5 | Single centre in Wuhan, Hubei Province, China | Good |
| Tang N et al54 | Feb 19, 2020 | 183 | Single centre in Wuhan, Hubei Province, China | Good |
| Zhang JJ et al55 | Feb 19, 2020 | 140 | Single centre in Wuhan, Hubei Province, China | Good |
| Xu XW et al56 | Feb 19, 2020 | 62 | Seven hospitals in Zhejiang Province, China | Good |
| Bernheim A et al22 | Feb 20, 2020 | 121 | Four hospitals in four provinces in China | Good |
| Wu J et al57 | Feb 21, 2020 | 80 | Two hospitals in Chongqing, China | Good |
| COVID-19 National Emergency Response Center (CNERC)24 | Feb 21, 2020 | 28 | Multi-centre in South Korea | Fair |
| Kwok KO et al58 | Feb 21, 2020 | 14 | Single centre in Hong Kong | Fair |
| Shi H et al59 | Feb 24, 2020 | 81 | Two centres in Wuhan, Hubei Province, China | Good |
| Yang X et al60 | Feb 24, 2020 | 52 | Single centre in Wuhan, Hubei Province, China | Good |
| Xu YH et al61 | Feb 25, 2020 | 50 | Single centre in Beijing, China | Good |
| Ai T et al62 | Feb 26, 2020 | 1014 | Single centre in Wuhan, Hubei Province, China | Good |
| Yang W et al63 | Feb 26, 2020 | 149 | Three tertiary hospitals in Wenzhou City, Zhejiang Province, China | Good |
| Tian S et al64 | Feb 27, 2020 | 262 | Designated hospitals of Beijing Emergency Medical Service in Beijing, China | Good |
| Huang Y et al65 | Feb 27, 2020 | 34 | Single centre in Wuhan, Hubei Province, China | Good |
| Guan WJ et al34 | Feb 28, 2020 | 1099 | 552 hospitals in 30 provinces, autonomous regions, and municipalities in mainland China | Good |
| Xu X et al66 | Feb 28, 2020 | 90 | Single centre in Guangdong Province, China | Good |
| Liu W et al67 | Feb 28, 2020 | 78 | Three tertiary hospitals in Wuhan, Hubei Province, China | Good |
| Li K et al68 | Feb 29, 2020 | 83 | Single centre in Chongqing, China | Good |
| Wu J et al69 | Feb 29, 2020 | 80 | Multi-centre in Jiangsu Province, China | Good |
| Cao J et al70 | Mar 2, 2020 | 102 | Single centre in Wuhan, Hubei Province, China | Good |
| Ruan Q et al71 | Mar 3, 2020 | 150 | Two centres in Wuhan, Hubei Province, China | Good |
| Zhao W et al72 | Mar 3, 2020 | 101 | Four institutions in Hunan Province, China | Good |
| Xiao F et al73 | Mar 3, 2020 | 73 | Single centre in Guangdong Province, China | Fair |
| Xiong Y et al74 | Mar 3, 2020 | 42 | Single centre in Wuhan, Hubei Province, China | Good |
| Young BE et al75 | Mar 3, 2020 | 18 | Four hospitals in Singapore | Good |
| Zhang J et al76 | Mar 3, 2020 | 14 | Single centre in Jinhua, Zhejiang Province, China | Fair |
| Li Y et al77 | Mar 4, 2020 | 51 | Single centre in Wuhan, Hubei Province, China | Good |
| Hu Z et al78 | Mar 4, 2020 | 24 | Single centre in Nanjing, Jiangsu Province, China | Good |
| Yao Y et al79 | Mar 5, 2020 | 195 | Patients reported by the Health Commission of Shaanxi Province, China | Fair |
| Zhou S et al80 | Mar 5, 2020 | 62 | Single centre in Wuhan, Hubei Province, China | Good |
| Spiteri G et al81 | Mar 5, 2020 | 38 | WHO European region except UK | Fair |
| Wang L et al82 | Mar 5, 2020 | 18 | Single centre in Zhengzhou, Henan Province, China | Fair |
| Zhang S et al83 | Mar 5, 2020 | 17 | Single centre in Sichuan Province, China | Good |
| Zhou F et al84 | Mar 11, 2020 | 191 | Two hospitals in Wuhan, Hubei Province, China | Good |
| COVID-19 National Incident Room Surveillance Team (CNIRST)85 | Mar 11, 2020 | 71 | Multi-centre in Australia | Fair |
| Liu K et al86 | Mar 11, 2020 | 56 | Single centre in Hainan Province, China | Good |
| Chen J et al87 | Mar 11, 2020 | 249 | Single centre in Shanghai, China | Good |
| Zhao D et al88 | Mar 12, 2020 | 19 | Two hospitals in Anhui Province, China | Good |
| Chen Q et al89 | Mar 12, 2020 | 9 | Single centre in Anhui Province, China | Good |
| Wu C et al90 | Mar 13, 2020 | 201 | Single centre in Wuhan, Hubei Province, China | Good |
| Zhu W et al91 | Mar 13, 2020 | 32 | Two emergency departments in Anhui Province, China | Good |
| Cheng Z et al92 | Mar 14, 2020 | 11 | Single centre in Shanghai, China | Good |
| Mo P et al93 | Mar 16, 2020 | 155 | Single centre in Wuhan, Hubei Province, China | Good |
| Wang Z et al94 | Mar 16, 2020 | 69 | Single centre in Wuhan, Hubei Province, China | Good |
| Wang Y et al95 | Mar 17, 2020 | 55 | Single centre in Shenzhen, Guangdong Province, China | Good |
| Han R et al96 | Mar 17, 2020 | 108 | Single centre in Wuhan, Hubei Province, China | Good |
| Qian GQ et al97 | Mar 17, 2020 | 91 | Five hospitals in Zhejiang Province, China | Good |
| Gao Y et al98 | Mar 17, 2020 | 43 | Single centre in Fuyang, Anhui Province, China | Good |
The online publication date of the studies was from January 24, 2020 through March 17, 2020. The median number of patients included in the studies were 70 (IQR: 31–137). The largest study was by Guan WJ et al34, which recruited 1099 patients from 552 hospitals in 30 provinces, autonomous regions, and municipalities of mainland China.
The quality of study was assessed using the NIH tool17 and the results are shown in table 1. Fifty out of 58 studies were of good quality, while rest 8 were of fair quality. None of the included study was judged poor.
Demographic data of the patients and their baseline comorbidities
The Table 2 shows the demographic data of the included patients. The total number of patients was 6892, and of these 3709 (54%) were males. Thus the male : female ratio was approximately 1.2:1. The combined mean age of patients was 49.7±16.3 years.
Table 2:
Demographic data of the patients and their baseline comorbidities.
| Age (years) | Gender | Comorbidities | |||||||||||||
|---|---|---|---|---|---|---|---|---|---|---|---|---|---|---|---|
| Author | N | Mean | SD | Male (n) | Male (%) | COPD | DM | HT | CAD | GI Dis | CLD | CKD | Neuro | Cancer | Endocrine |
| Huang C et al44 | 41 | 49.3 | 13.1 | 30 | 73 | 1 | 8 | 6 | 6 | 1 | 1 | ||||
| Chan JF et al45 | 6 | 46.2 | 22.5 | 3 | 50 | ||||||||||
| Li Q et al46 | 425 | 55.5 | 12.4 | 240 | 56 | ||||||||||
| Chen N et al47 | 99 | 55.5 | 13.1 | 67 | 68 | 1 | 40 | 11 | 1 | 1 | 13* | ||||
| Song F et al48 | 51 | 49.0 | 16.0 | 25 | 49 | 1 | 3 | 5 | 1 | 1 | |||||
| Wang D et al49 | 138 | 55.3 | 19.5 | 75 | 54 | 4 | 14 | 43 | 20 | 4 | 4 | 7 | 10 | ||
| Liu K et al50 | 137 | 54.2 | 12.1 | 61 | 45 | 2 | 14 | 13 | 10 | 2 | |||||
| Chang et al51 | 13 | 38.7 | 11.6 | 10 | 77 | ||||||||||
| Liu Y et al52 | 12 | 53.7 | 18.0 | 8 | 67 | 1 | 2 | 3 | 4 | 0 | 2 | 0 | |||
| Ren LL et al53 | 5 | 53.6 | 9.5 | 3 | 60 | 1 | 1 | ||||||||
| Tang N et al54 | 183 | 54.1 | 16.2 | 98 | 54 | ||||||||||
| Zhang JJ et al55 | 140 | 56.5 | 11.8 | 71 | 51 | 2 | 17 | 42 | 7 | 7 | 8 | 2 | 3 | 5 | |
| Xu XW et al56 | 62 | 41.7 | 15.2 | 35 | 56 | 1 | 1 | 5 | 7 | 1 | 1 | ||||
| Bernheim A et al22 | 121 | 45.0 | 15.6 | 61 | 50 | ||||||||||
| Wu J et al57 | 80 | 44.0 | 11.0 | 42 | 53 | 3 | 4 | 4 | 1 | ||||||
| CNERC24 | 28 | 42.6 | 13.2 | 15 | 54 | ||||||||||
| Kwok KO et al58 | 14 | 59.8 | 13.4 | 9 | 64 | ||||||||||
| Shi H et al59 | 81 | 49.5 | 11.0 | 42 | 52 | 9 | 10 | 12 | 8 | 7 | 3 | 6 | 4 | ||
| Yang X et al60 | 52 | 59.7 | 13.3 | 35 | 67 | 4 | 9 | 5 | 7 | 2 | |||||
| Xu YH et al61 | 50 | 43.9 | 16.8 | 29 | 58 | ||||||||||
| Ai T et al62 | 1014 | 51.0 | 15.0 | 467 | 46 | ||||||||||
| Yang W et al63 | 149 | 45.1 | 13.4 | 81 | 54 | 1 | 28 | 8 | 0 | 2 | 9* | ||||
| Tian S et al64 | 262 | 47.5 | 16.5 | 127 | 48 | ||||||||||
| Huang Y et al65 | 34 | 56.2 | 17.1 | 14 | 41 | 2 | 4 | 8 | 6 | 1 | 3 | 2 | |||
| Guan WJ et al34 | 1099 | 46.7 | 17.1 | 640 | 58 | 12 | 81 | 165 | 27 | 23 | 8 | 15 | 10 | ||
| Xu X et al66 | 90 | 51.0 | 13.8 | 39 | 43 | 1 | 5 | 17 | 3 | 2 | |||||
| Liu W et al67 | 78 | 42.7 | 18.1 | 39 | 50 | 2 | 5 | 8 | 4 | ||||||
| Li K et al68 | 83 | 45.5 | 12.3 | 44 | 53 | 5 | 7 | 5 | 1 | ||||||
| Wu J et al69 | 80 | 46.1 | 15.4 | 39 | 49 | 1 | 25 | 3 | 1 | 1 | 1 | 1 | 5* | ||
| Cao J et al70 | 102 | 52.7 | 22.6 | 53 | 52 | 10 | 11 | 28 | 5 | 2 | 4 | 6 | 4 | ||
| Ruan Q et al71 | 150 | 57.7 | 12.5 | 102 | 68 | 3 | 25 | 52 | 13 | 4 | 2 | 12 | 3 | ||
| Zhao W et al72 | 101 | 44.4 | 11.6 | 56 | 55 | 5 | 16 | 6 | 3* | ||||||
| Xiao F et al73 | 73 | 41.2 | 16.2 | 41 | 56 | 0 | 7 | ||||||||
| Xiong Y et al74 | 42 | 49.5 | 14.1 | 25 | 60 | ||||||||||
| Young BE et al75 | 18 | 49.5 | 11.5 | 9 | 50 | ||||||||||
| Zhang J et al76 | 14 | 46.8 | 20.2 | 7 | 50 | ||||||||||
| Li Y et al77 | 51 | 58.0 | 12.7 | 28 | 55 | ||||||||||
| Hu Z et al78 | 24 | 36.2 | 29.9 | 8 | 33 | 0 | 2 | 2 | 1 | 0 | 1 | 1 | 0 | ||
| Yao Y et al79 | 195 | 44.1 | 15.8 | 129 | 66 | ||||||||||
| Zhou S et al80 | 62 | 52.8 | 12.2 | 39 | 63 | 4 | 4 | 1 | 1 | ||||||
| Spiteri G et al81 | 38 | 41.8 | 18.5 | 25 | 66 | 1/7 | |||||||||
| Wang L et al82 | 18 | 41.0 | 20.9 | 10 | 56 | 3 | 5 | 3 | 2 | 1 | |||||
| Zhang S et al83 | 17 | 48.6 | 14.2 | 8 | 47 | 2 | 2 | 1 | 2 | ||||||
| Zhou F et al84 | 191 | 56.3 | 15.7 | 119 | 62 | 6 | 36 | 58 | 15 | 2 | 2 | ||||
| CNIRST85 | 71 | 46.0 | 19.8 | 36 | 51 | ||||||||||
| Liu K et al86 | 56 | 52.1 | 14.7 | 31 | 55 | 3 | 10 | 2 | 1 | 1 | |||||
| Chen J et al87 | 249 | 50.3 | 20.9 | 126 | 51 | 5 | 55 | 9 | 2 | 1 | 25 | ||||
| Zhao D et al88 | 19 | 43.7 | 23.2 | 11 | 58 | 2 | 1 | ||||||||
| Chen Q et al89 | 9 | 42.1 | 15.3 | 5 | 56 | ||||||||||
| Wu C et al90 | 201 | 51.3 | 12.7 | 128 | 64 | 5 | 22 | 39 | 8 | 7 | 2 | 7 | 1 | 2 | |
| Zhu W et al91 | 32 | 44.3 | 13.2 | 15 | 47 | 2 | 4 | 7 | 2 | 2 | 1 | 2 | 2 | ||
| Cheng Z et al92 | 11 | 50.4 | 15.5 | 8 | 73 | ||||||||||
| Mo P et al93 | 155 | 54.0 | 18.0 | 86 | 55 | 5 | 15 | 37 | 15 | 7 | 6 | 7 | 7 | ||
| Wang Z et al94 | 69 | 46.3 | 20.4 | 32 | 46 | 4 | 7 | 9 | 8 | 1 | 4 | ||||
| Wang Y et al95 | 55 | 42.2 | 14.7 | 22 | 40 | 1 | 1 | ||||||||
| Han R et al96 | 108 | 45.0 | 13.6 | 38 | 35 | ||||||||||
| Qian GQ et al97 | 91 | 47.8 | 15.4 | 37 | 41 | 8 | 15 | 3 | |||||||
| Gao Y et al98 | 43 | 43.7 | 12.1 | 26 | 60 | 8 | 7 | 13 | 3 | ||||||
| All patients | 6892 | 49.7 | 16.3 | 3709 | 54% | 108/3847 | 331/3379 | 620/3368 | 343/3872 | 38/766 | 90/3011 | 41/2592 | 79/2651 | 74/3361 | 65/1115 |
| 2.8% | 9.8% | 18.4% | 8.8% | 5.0% | 3.0% | 1.6% | 3.0% | 2.2% | 5.8% | ||||||
In these studies diabetes was included in endocrine diseases.
Table 2 also shows the data on underlying comorbidities in included patients. This data was present in 39 studies. The highest frequency of comorbidity was hypertension, which was present in 620/3368 (18.4%) patients. The next most common comorbidities were diabetes mellitus (9.8%), cardiovascular diseases (8.8%), endocrine diseases (5.8%), and gastrointestinal diseases (5%). Since COVID-19 mainly affects respiratory system, presence of underlying respiratory diseases, especially COPD, is relevant. Out of 3847 patients 108 (2.8%) had COPD.
Presenting symptoms of patients
Fifty-three studies had data on symptoms of the patients, which is shown in Table 3. The most common symptom was fever which was present in 4082/4895 (83.4%). This was followed by cough, which was present in 3008/4968 (60.5%), fatigue in 1355/4007 (33.8%), sputum in 908/3146 (28.9%), dyspnea in 856/3879 (22.1%), myalgia in 757/3683 (20.6%), chest tightness / pain in 233/1424 (16.3%), sore throat in 354/2056 (13.5%), and headache in 387/3449 (11.2%). Notably, nasal congestion or rhinorrhea were present in minority (6.7%). Only 1.7% had hemoptysis. Gastro-intestinal symptoms of diarrhea, nausea / vomiting, and pain abdomen were present in 7.5%, 5.6% and 4.6%, respectively.
Table 3:
Presenting symptoms of patients.
| Author | N | General | Respiratory | Gastro-intestinal | |||||||||||
|---|---|---|---|---|---|---|---|---|---|---|---|---|---|---|---|
| Fever | Headache | Fatigue | Myalgia | Cough | Sore throat | Nasal congestio n / rhinorrhe a |
Sputum | Hemoptysis | Chest tightness / pain | Dyspnea | Diarrhea | Nausea / vomiting | Pain abdomen | ||
| Huang C et al44 | 41 | 40 | 3/38 | 18 | 18 | 31 | 11/39 | 2/39 | 22/40 | 1/38 | |||||
| Chan JF et al45 | 6 | 5 | 3 | 4 | 1 | 1 | 1 | 1 | 2 | ||||||
| Li Q et al46 | 425 | ||||||||||||||
| Chen N et al47 | 99 | 82 | 8 | 11 | 81 | 5 | 4 | 2 | 31 | 2 | 1 | ||||
| Song F et al48 | 51 | 49 | 8 | 16 | 16 | 24 | 3 | 2 | 10 | 7 | 7 | 5 | 3 | ||
| Wang D et al49 | 138 | 136 | 9 | 96 | 48 | 82 | 24 | 37 | 43 | 14 | 14 | 3 | |||
| Liu K et al50 | 137 | 112 | 13 | 44 | 44 | 66 | 6 | 7 | 26 | 11 | |||||
| Chang et al51 | 13 | 12 | 3 | 3 | 6 | 1 | 2 | 1 | |||||||
| Liu Y et al52 | 12 | 10 | 0 | 4 | 11 | 2 | 2 | ||||||||
| Ren LL et al53 | 5 | 5 | 1 | 3 | 3 | 5 | 1 | 4 | 0 | ||||||
| Tang N et al54 | 183 | ||||||||||||||
| Zhang JJ et al55 | 140 | 110/120 | 90/120 | 90/120 | 44/120 | 44/120 | 18/139 | 24/139 | 8/139 | ||||||
| Xu XW et al56 | 62 | 48 | 21 | 32 | 32 | 50 | 35 | 2 | 3 | ||||||
| Bernheim A et al22 | 121 | 74 | 58 | 20 | |||||||||||
| Wu J et al57 | 80 | 61 | 8 | 13 | 58 | 9 | 11 | 3 | 5 | 7 | 7 | 7 | |||
| CNERC24 | 28 | 9 | 3 | 3 | 4 | 5 | 9 | 5 | |||||||
| Kwok KO et al58 | 14 | 12 | 1 | 5 | 1 | 2 | |||||||||
| Shi H et al59 | 81 | 59 | 5 | 7 | 48 | 21 | 15 | 18 | 34 | 3 | 4 | ||||
| Yang X et al60 | 52 | 51 | 3 | 18 | 6 | 40 | 3 | 1 | 33 | 2 | |||||
| Xu YH et al61 | 50 | 43 | 5 | 8 | 8 | 20 | 4 | 7 | 4 | 4 | 1 | ||||
| Ai T et al62 | 1014 | ||||||||||||||
| Yang W et al63 | 149 | 114 | 13 | 5 | 87 | 21 | 5 | 48 | 21 | 2 | 11 | 2 | |||
| Tian S et al64 | 262 | 215 | 17 | 69 | 120 | 18 | |||||||||
| Huang Y et al65 | 34 | 32 | 2 | 22 | 22 | 17 | 8 | 5 | 5 | ||||||
| Guan WJ et al34 | 1099 | 975 | 150 | 419 | 164 | 745 | 153 | 53 | 370 | 10 | 205 | 42 | 55 | ||
| Xu X et al66 | 90 | 70 | 4 | 19 | 25 | 57 | 23 | 11 | 5 | 5 | |||||
| Liu W et al67 | 78 | 57 | 34 | ||||||||||||
| Li K et al68 | 83 | 72 | 9 | 15 | 65 | 6 | 15 | 5 | 9 | 7 | 7 | ||||
| Wu J et al69 | 80 | 63 | 13 | 18 | 51 | 11 | 5 | 3 | 30 | 1 | 1 | ||||
| Cao J et al70 | 102 | 83 | 56 | 35 | 50 | 11 | |||||||||
| Ruan Q et al71 | 150 | 127 | 37 | 19 | 110 | 54 | 3 | 110 | |||||||
| Zhao W et al72 | 101 | 79 | 17 | 17 | 63 | 12 | 1 | 3 | 2 | ||||||
| Xiao F et al73 | 73 | 53 | 26 | ||||||||||||
| Xiong Y et al74 | 42 | 36 | 14 | 27 | 8 | 10 | |||||||||
| Young BE et al75 | 18 | 13 | 15 | 11 | 1 | 2 | 3 | ||||||||
| Zhang J et al76 | 14 | 13 | 10 | 0 | 0 | ||||||||||
| Li Y et al77 | 51 | 46 | 3 | 1 | |||||||||||
| Hu Z et al78 | 24 | 5 | 2 | 1 | 2 | 1 | |||||||||
| Yao Y et al79 | 195 | ||||||||||||||
| Zhou S et al80 | 62 | 54 | 14 | 20 | 28 | 28 | 15 | 9 | |||||||
| Spiteri G et al81 | 38 | 20/31 | 6/31 | 8/31 | 14/31 | 2/31 | 2/31 | 2/31 | 1/31 | 1/31 | |||||
| Wang L et al82 | 18 | 17 | 1 | 2 | 10 | 1 | 1 | 4 | 3 | 1 | |||||
| Zhang S et al83 | 17 | 12 | 6 | 7 | 9 | 1 | 7 | 1 | |||||||
| Zhou F et al84 | 191 | 180 | 44 | 29 | 151 | 44 | 9 | 7 | |||||||
| CNIRST85 | 71 | 22/34 | 12/34 | 6/34 | 24/34 | 17/34 | 10/34 | 3/34 | 3/34 | 9/34 | 2/34 | ||||
| Liu K et al86 | 56 | 44 | 5 | 21 | 3 | 21 | 4 | 4 | 10 | ||||||
| Chen J et al87 | 249 | 217 | 28 | 39 | 91 | 16 | 17 | 19 | 8 | ||||||
| Zhao D et al88 | 19 | 15 | 2 | 2 | 9 | 4 | 1 | 1 | |||||||
| Chen Q et al89 | 9 | 8 | 7 | 2 | 2 | 0 | |||||||||
| Wu C et al90 | 201 | 188 | 65 | 65 | 163 | 83 | 80 | ||||||||
| Zhu W et al91 | 32 | 27 | 1 | 5 | 5 | 21 | 5 | 0 | 3 | 1 | |||||
| Cheng Z et al92 | 11 | 8 | 3 | 7 | 1 | 3 | 1 | 1 | |||||||
| Mo P et al93 | 155 | 126 | 8 | 60 | 50 | 97 | 61 | 50 | 7 | 3 | 3 | ||||
| Wang Z et al94 | 69 | 60 | 10 | 29 | 21 | 38 | 6 | 20 | 14 | 20 | 10 | 3 | |||
| Wang Y et al95 | 55 | 7 | 7 | ||||||||||||
| Han R et al96 | 108 | 94 | 14 | 42 | 12 | 65 | 14 | 17 | 15 | ||||||
| Qian GQ et al97 | 91 | 65 | 7 | 40 | 5 | 55 | 30 | 17 | 10 | 21 | 11 | ||||
| Gao Y et al98 | 43 | ||||||||||||||
| All patients | 6892 | 4082/4895 | 387/3449 | 1355/4007 | 757/3683 | 3008/4968 | 354/2628 | 138/2056 | 908/3146 | 28/1617 | 233/1424 | 856/3879 | 291/3875 | 153/2750 | 28/604 |
| % | 83.4% | 11.2% | 33.8% | 20.6% | 60.5% | 13.5% | 6.7% | 28.9% | 1.7% | 16.3% | 22.1% | 7.5% | 5.6% | 4.6% | |
Laboratory and imaging features of patients
Table 4 shows the routine laboratory and CT features of the patients. Among the hematological parameters, lower than normal WBC count was found in 818/3030 (27%) patients while higher than normal WBC count was found in 264/2918 (9%) patients. Lower than normal platelet count was found in 464/2023 (22.9%). The hemoglobin remained largely within normal range (mean 132±20 g/L). Serum creatinine was deranged in 123/1894 (6.5%). Among the liver function parameters, AST was abnormal in 529/2091 (25.3%), ALT was abnormal in 473/2084 (22.7%), bilirubin was abnormal in 130/1471 (8.8%), serum albumin was low in 491/817 (60.1%) and prothrombin time was high in 55/750 (7.3%). CT scan of chest was abnormal in 3119/3503 (89%) patients.
Table 4:
Routine laboratory and CT features of patients.
| Author | N | Low WBC | High WBC | Low PLT | Hb | High Creat | High AST | High ALT | High Bilirubin | Low Albumin | High PT | Abnormal CT Chest | |
|---|---|---|---|---|---|---|---|---|---|---|---|---|---|
| Mean | SD | ||||||||||||
| Huang C et al44 | 41 | 10/40 | 12/40 | 2/40 | 128 | 17 | 4 | 15 | |||||
| Chan JF et al45 | 6 | 0 | 1 | 2 | 144 | 11 | 2 | 0 | 0 | 0 | 0 | 0 | |
| Li Q et al46 | 425 | ||||||||||||
| Chen N et al47 | 99 | 9 | 24 | 12 | 130 | 15 | 3 | 35 | 28 | 18 | 97 | 5 | 99 |
| Song F et al48 | 51 | ||||||||||||
| Wang D et al49 | 138 | 138 | |||||||||||
| Liu K et al50 | 137 | 51 | 26 | ||||||||||
| Chang et al51 | 13 | 147 | 12 | ||||||||||
| Liu Y et al52 | 12 | 0 | 1 | 1 | 2 | 2 | 2 | 0 | 6 | ||||
| Ren LL et al53 | 5 | 1 | 2 | 1 | 1 | 1 | 1 | 5 | |||||
| Tang N et al54 | 183 | ||||||||||||
| Zhang JJ et al55 | 140 | 27/138 | 17/138 | 134/135 | |||||||||
| Xu XW et al56 | 62 | 19 | 1 | 3 | 139 | 18 | 3 | 10 | |||||
| Bernheim A et al22 | 121 | 117 | |||||||||||
| Wu J et al57 | 80 | 7 | 10 | 76 | |||||||||
| CNERC24 | 28 | ||||||||||||
| Kwok KO et al58 | 14 | ||||||||||||
| Shi H et al59 | 81 | 26 | 0 | 124 | 12 | 43 | |||||||
| Yang X et al60 | 52 | 15 | 15 | ||||||||||
| Xu YH et al61 | 50 | 41 | |||||||||||
| Ai T et al62 | 1014 | 888 | |||||||||||
| Yang W et al63 | 149 | 33 | 2 | 20 | 43 | 27 | 18 | 4 | 9 | 17 | 132 | ||
| Tian S et al64 | 262 | ||||||||||||
| Huang Y et al65 | 34 | 6 | 4 | 9 | 6 | 7 | 8 | 3 | 25 | 17 | 33 | ||
| Guan WJ et al34 | 1099 | 330/978 | 58/978 | 315/869 | 134 | 22 | 12/752 | 168/757 | 158/741 | 76/722 | 840/975 | ||
| Xu X et al66 | 90 | 19 | 3 | 72 | |||||||||
| Liu W et al67 | 78 | ||||||||||||
| Li K et al68 | 83 | 10 | 9 | ||||||||||
| Wu J et al69 | 80 | 36 | 5 | 11 | 125 | 13 | 2 | 3 | 3 | 1 | 2 | 0 | 55 |
| Cao J et al70 | 102 | ||||||||||||
| Ruan Q et al71 | 150 | 61/147 | 29/149 | 54/147 | 43/146 | 18/147 | 114/148 | ||||||
| Zhao W et al72 | 101 | 93 | |||||||||||
| Xiao F et al73 | 73 | 66 | |||||||||||
| Xiong Y et al74 | 42 | 10/37 | 1/37 | ||||||||||
| Young BE et al75 | 18 | 140 | 15 | ||||||||||
| Zhang J et al76 | 14 | 13 | |||||||||||
| Li Y et al77 | 51 | ||||||||||||
| Hu Z et al78 | 24 | 4 | 0 | 132 | 19 | 2 | 0 | 2 | 0 | 17 | |||
| Yao Y et al79 | 195 | ||||||||||||
| Zhou S et al80 | 62 | 6/30 | |||||||||||
| Spiteri G et al81 | 38 | ||||||||||||
| Wang L et al82 | 18 | 3/16 | 4/16 | 4/16 | |||||||||
| Zhang S et al83 | 17 | ||||||||||||
| Zhou F et al84 | 191 | 32 | 40 | 13 | 129 | 16 | 8/186 | 59/189 | 11/182 | ||||
| CNIRST85 | 71 | ||||||||||||
| Liu K et al86 | 56 | 11 | 4 | 120 | 23 | 56 | |||||||
| Chen J et al87 | 249 | ||||||||||||
| Zhao D et al88 | 19 | 7 | 0 | 5/18 | 5/18 | ||||||||
| Chen Q et al89 | 9 | 3 | 1 | ||||||||||
| Wu C et al90 | 201 | 9/198 | 59/198 | 43/198 | 10/198 | 195/198 | 4/195 | ||||||
| Zhu W et al91 | 32 | 7 | 1 | 135 | 24 | ||||||||
| Cheng Z et al92 | 11 | 139 | 08 | 11 | |||||||||
| Mo P et al93 | 155 | 44 | 11 | 36 | 23 | 54 | 54 | ||||||
| Wang Z et al94 | 69 | 36/67 | 1/67 | 129 | 17 | 19 | 23 | ||||||
| Wang Y et al95 | 55 | 11 | 1 | 39 | |||||||||
| Han R et al96 | 108 | 11 | 0 | 108 | |||||||||
| Qian GQ et al97 | 91 | 14 | 3 | 10 | 135 | 15 | 3 | 9 | 7 | 43 | 86 | ||
| Gao Y et al98 | 43 | ||||||||||||
| All patients | 6892 | 818/3030 | 264/2918 | 464/2023 | 132 | 20 | 123/1894 | 529/2091 | 473/2084 | 130/1471 | 491/817 | 55/750 | 3119/3503 |
| % | 27.0% | 9.0% | 22.9% | 6.5% | 25.3% | 22.7% | 8.8% | 60.1% | 7.3% | 89.0% | |||
The table 5 shows various inflammatory and infection markers in the patients. High CRP was the most common finding, present in 1755/2601 (67.5%) patients. LDH was high in 1041/2001 (52%) patients, D-dimer was high in 322/1853 (17.4%) and procalcitonin was high in 278/1806 (15.4%) patients.
Table 5:
Inflammatory and infection markers of patients.
| Author | N | High CRP | High LDH | High D-dimer | High CK | High Procal |
|---|---|---|---|---|---|---|
| Huang C et al44 | 41 | 29/40 | 13/40 | 3/39 | ||
| Chan JF et al45 | 6 | 3 | 3 | 2/3 | 0 | |
| Li Q et al46 | 425 | |||||
| Chen N et al47 | 99 | 63 | 75 | 36 | 13 | 6 |
| Song F et al48 | 51 | 41 | ||||
| Wang D et al49 | 138 | 49 | ||||
| Liu K et al50 | 137 | 115 | ||||
| Chang et al51 | 13 | |||||
| Liu Y et al52 | 12 | 10 | 11 | 1 | 1 | |
| Ren LL et al53 | 5 | 3 | 2 | |||
| Tang N et al54 | 183 | |||||
| Zhang JJ et al55 | 140 | 125/136 | 35/81 | 4/60 | 41/118 | |
| Xu XW et al56 | 62 | 17 | 5 | 7 | ||
| Bernheim A et al22 | 121 | |||||
| Wu J et al57 | 80 | 37 | 32 | |||
| CNERC24 | 28 | |||||
| Kwok KO et al58 | 14 | |||||
| Shi H et al59 | 81 | |||||
| Yang X et al60 | 52 | |||||
| Xu YH et al61 | 50 | 26 | ||||
| Ai T et al62 | 1014 | |||||
| Yang W et al63 | 149 | 82 | 45 | 21 | 12 | |
| Tian S et al64 | 262 | |||||
| Huang Y et al65 | 34 | 5 | 1/12 | 13/31 | ||
| Guan WJ et al34 | 1099 | 481/793 | 277/675 | 260/560 | 90/657 | 35/633 |
| Xu X et al66 | 90 | 38 | ||||
| Liu W et al67 | 78 | |||||
| Li K et al68 | 83 | 50 | 44 | |||
| Wu J et al69 | 80 | 62 | 17 | 3 | 18 | 1 |
| Cao J et al70 | 102 | |||||
| Ruan Q et al71 | 150 | 119/149 | 109/148 | 59/137 | ||
| Zhao W et al72 | 101 | |||||
| Xiao F et al73 | 73 | |||||
| Xiong Y et al74 | 42 | 27/32 | 15/26 | 3/30 | ||
| Young BE et al75 | 18 | |||||
| Zhang J et al76 | 14 | |||||
| Li Y et al77 | 51 | |||||
| Hu Z et al78 | 24 | 4/23 | 4 | 4/22 | 5 | |
| Yao Y et al79 | 195 | |||||
| Zhou S et al80 | 62 | 27/27 | ||||
| Spiteri G et al81 | 38 | |||||
| Wang L et al82 | 18 | 12/16 | 4/16 | |||
| Zhang S et al83 | 17 | 17 | ||||
| Zhou F et al84 | 191 | 123/184 | 117/172 | 22/168 | 14/164 | |
| CNIRST85 | 71 | |||||
| Liu K et al86 | 56 | |||||
| Chen J et al87 | 249 | |||||
| Zhao D et al88 | 19 | 18 | 6 | 1/18 | ||
| Chen Q et al89 | 9 | 3 | 4/8 | 4/8 | 0/7 | |
| Wu C et al90 | 201 | 166/194 | 194/198 | 44/189 | 9/198 | |
| Zhu W et al91 | 32 | 21 | 3 | 0 | ||
| Cheng Z et al92 | 11 | |||||
| Mo P et al93 | 155 | 74 | 25 | 74 | ||
| Wang Z et al94 | 69 | 42/63 | 25/61 | 4/62 | ||
| Wang Y et al95 | 55 | 10 | 13 | |||
| Han R et al96 | 108 | 107 | ||||
| Qian GQ et al97 | 91 | 49 | 22 | 14 | ||
| Gao Y et al98 | 43 | |||||
| All patients | 6892 | 1755/2601 | 1041/2001 | 584/1680 | 322/1853 | 278/1806 |
| % | 67.5% | 52.0% | 34.8% | 17.4% | 15.4% |
Clinical outcome
Since, at the time of publication of most of these studies, many of the included patients were still admitted in the hospital, with many in the ICUs, so it was not possible by many studies to provide the mortality data. However, many studies did classify the patients into severe and non-severe groups based on predefined criteria14–16. Overall, 28 studies reported that 3119/3984 (78.3%) of their patients had good clinical course, while the remaining 865/3984 (21.7%) patients had severe clinical course, including admission to ICU, development of ARDs, ventilatory requirement, mortality or pre-defined severity criteria14–16 (Figure 2).
Figure 2:

Clinical course of the patients.
Factors associated with severe clinical course
A total of 21 studies evaluated factors associated with severe clinical course using univariate analysis as shown in Table 6. The quality of these studies as assessed by the NIH tool for case-control studies17 is also given in the table. Notably all the included studies were of good quality. Of the twelve domains in the quality assessment tool, all the included studies were marked as ‘yes’ in nine domains. The only domains in which the studies were marked ‘no’ were: sample size justification, blinding of assessors, and adjusting for confounding variables.
Table 6:
Factors associated with severe clinical course on univariate analysis in various studies.
| Author | Total number of patients | Patients with severe clinical course | Patients with good clinical course | Quality of study |
|---|---|---|---|---|
| Huang C et al44 | 41 | 13 | 28 | Good |
| Wang D et al49 | 138 | 36 | 102 | Good |
| Tang N et al54 | 183 | 21 | 162 | Good |
| Zhang JJ et al55 | 140 | 58 | 82 | Good |
| Yang X et al60 | 52 | 32 | 20 | Good |
| Xu YH et al61 | 50 | 13 | 37 | Good |
| Tian S et al64 | 262 | 46 | 216 | Good |
| Guan WJ et al34 | 1099 | 173 | 926 | Good |
| Liu W et al67 | 78 | 11 | 67 | Good |
| Li K et al68 | 83 | 25 | 58 | Good |
| Cao J et al70 | 102 | 18 | 84 | Good |
| Ruan Q et al71 | 150 | 68 | 82 | Good |
| Zhao W et al72 | 101 | 14 | 87 | Good |
| Young BE et al75 | 18 | 6 | 12 | Good |
| Zhou F et al84 | 191 | 54 | 137 | Good |
| Chen J et al87 | 249 | 22 | 227 | Good |
| Wu C et al90 | 201 | 84 | 117 | Good |
| Mo P et al93 | 155 | 85 | 70 | Good |
| Wang Z et al94 | 69 | 14 | 55 | Good |
| Qian GQ et al97 | 91 | 9 | 82 | Good |
| Gao Y et al98 | 43 | 15 | 28 | Good |
| Number of patients | (n=3496) | (n=817) | (n=2679) |
Of the 3496 patients in these twenty-one studies, 817 (23%) patients had severe clinical course and 2679 (77%) patients had good clinical course. The important demographic, clinical and laboratory factors associated with severe clinical course are discussed below.
Demographic factors associated with severe clinical course
Age was compared between patients with severe clinical course and good clinical course in 21 studies. The mean age in patients with severe clinical course was found to be significantly higher than in patients with good clinical course (59.4 [95% CI: 56.1–62.8] versus 46.5 [95% CI: 43.8–49.2] years; p<0.01) (Figure 3). The pooled odds ratio of patients of advanced age (>60 years) having severe clinical course was 4.82 (95% CI: 2.83–8.24; p<0.01) (Figure 4). The heterogeneity among studies was significant with an I2 of 94%. A sensitivity analysis after removing 4 outlier studies still revealed a significant pooled odds ratio of 4.42 (95%CI: 3.27–5.95) and an I2 of 47%.
Figure 3:

Mean age of patients with good and severe clinical course.
Figure 4:

Forest plot showing pooled odds ratio for patients with higher age (≥60 years) developing severe clinical course.
Gender was assessed as a factor associated with severe clinical course in 20 studies. Although most studies individually could not associate gender with severe clinical course, however, meta-analysis of the studies revealed that male gender was significantly associated with severe clinical course with a pooled odds ratio of 1.47 (95% CI: 1.21–1.79; p<0.01) (Figure 5). The heterogeneity among studies was not significant with an I2 of 12%.
Figure 5:

Forest plot showing pooled odds ratio for male gender developing severe clinical course.
Comorbidities associated with severe clinical course
Presence of any comorbidity was assessed as a factor associated with severe clinical course in 12 studies. The pooled odds ratio of 3.16 (95% CI: 2.32–4.29) suggested that presence of any comorbidity was significantly associated with severe clinical course (Figure 6). The heterogeneity among studies was not significant with an I2 of 29%.
Figure 6:

Forest plot showing pooled odds ratio for patients having any comorbidity developing severe clinical course.
Presence of diabetes mellitus was assessed as a factor associated with severe clinical course in 14 studies. The pooled odds ratio of 3.11 (95% CI: 1.99–4.88) suggested that presence of diabetes mellitus was significantly associated with severe clinical course (Figure 7). The heterogeneity among studies was not high with an I2 of 48%.
Figure 7:

Forest plot showing pooled odds ratio for patients with diabetes mellitus developing severe clinical course.
Presence of hypertension was assessed as a factor associated with severe clinical course in 13 studies. The pooled odds ratio of 2.30 (95% CI: 1.84–2.89) suggested that presence of hypertension was significantly associated with severe clinical course (Figure 8). The heterogeneity among studies was not significant with an I2 of 3%.
Figure 8:

Forest plot showing pooled odds ratio for patients with hypertension developing severe clinical course.
Presence of cardiovascular disease was assessed as a factor associated with severe clinical course in 13 studies. The pooled odds ratio of 3.88 (95% CI: 2.30–6.54) suggested that presence of cardiovascular disease was significantly associated with severe clinical course (Figure 9). The heterogeneity among studies was not significant with an I2 of 26%.
Figure 9:

Forest plot showing pooled odds ratio for patients with cardiovascular disease developing severe clinical course.
Presence of COPD was assessed as a factor associated with severe clinical course in 13 studies. The pooled odds ratio of 4.37 (95% CI: 2.52–7.59) suggested that presence of COPD was significantly associated with severe clinical course (Figure 10). There was no heterogeneity among studies with an I2 of 0%.
Figure 10:

Forest plot showing pooled odds ratio for patients with COPD developing severe clinical course.
Symptoms associated with severe clinical course
Fever is the most common symptom of COVID-19, being present in 83.4% of cases. Whether presence of fever was associated with severe clinical course was assessed in 16 studies. The pooled odds ratio for patients with fever progressing to severe clinical course was 1.10 (95% CI: 0.80–1.52) (Figure 11), indicating that fever was equally common in patients with good and severe clinical course. The heterogeneity among studies was not significant with an I2 of 5%.
Figure 11:

Forest plot showing pooled odds ratio of fever being associated with severe clinical course.
Many studies reported that patients having high temperatures had severe disease. Patients having fever spike with temperatures ≥39°C as a factor associated with severe clinical course was evaluated in 10 studies. It was found that patients having temperatures ≥39°C were more likely to have severe clinical course than patients with temperatures <39°C (pooled odds ratio 1.59 [95% CI: 1.10–2.30]) (Figure 12).
Figure 12:

Forest plot showing pooled odds ratio of high temperature (≥39°C) being associated with severe clinical course.
After fever, the second most common symptom of COVID-19 is cough, being present in 60.5% of cases. Cough was assessed as a factor associated with severe clinical course in 16 studies and it was not found to be significantly associated. The pooled odds ratio was 1.19 (95% CI: 0.97–1.45) (Figure 13). There was no heterogeneity among studies with an I2 of 0%.
Figure 13:

Forest plot showing pooled odds ratio of cough being associated with severe clinical course.
Sputum production was assessed as a factor associated with severe clinical course in 9 studies. It was found to be significantly associated with severe clinical course with a pooled odds ratio of 1.35 (95% CI: 1.02–1.79) (Figure 14). The heterogeneity among studies was not significant with an I2 of 17%.
Figure 14:

Forest plot showing pooled odds ratio of sputum production being associated with severe clinical course.
Presence of shortness of breath or dyspnea was assessed as a factor associated with severe clinical course in 14 studies and it was found to be significantly associated with a pooled odds ratio of 4.66 (95% CI: 3.12–6.95) (Figure 15). The heterogeneity among studies was significant with an I2 of 61%. A sensitivity analysis after removing one outlier study still revealed a significant pooled odds ratio of 4.03 (95%CI: 2.85–5.69) and an I2 of 46%.
Figure 15:

Forest plot showing pooled odds ratio of dyspnea being associated with severe clinical course.
Among the gastro-intestinal symptoms, diarrhea was found in 7.5% cases. Whether it was associated with severe clinical course was assessed in 11 studies. A pooled odds ratio of 1.55 (95% CI: 1.03–2.34) indicated that it was significantly associated with severe clinical course (Figure 16). There was no heterogeneity among studies with an I2 of 0%.
Figure 16:

Forest plot showing pooled odds ratio of diarrhea being associated with severe clinical course.
Laboratory features associated with severe clinical course
Most patients of COVID-19 have either normal (64%) or lower than normal values of WBC count (27%). Only 9% of patients had higher than normal values of WBC count. Whether higher than normal values of WBC count was associated with severe clinical course was assessed in 16 studies. Higher than normal value of WBC count was found to be significantly associated with severe clinical course with a pooled odds ratio of 2.67 (95% CI: 1.73–4.11) (Figure 17). The heterogeneity among studies was significant with an I2 of 80%. A sensitivity analysis after removing two outlier studies still revealed a significant pooled odds ratio of 3.39 (95%CI: 2.44–4.71) and an I2 of 41%.
Figure 17:

Forest plot showing pooled odds ratio of higher than normal values of WBC count being associated with severe clinical course.
Lymphocyte count as a factor associated with severe clinical course was evaluated in 17 studies. Lower than normal value of lymphocyte count was found to be significantly associated with severe clinical course with a pooled odds ratio of 3.22 (95% CI: 2.32–4.47) (Figure 18). The heterogeneity among studies was significant with an I2 of 50%. A sensitivity analysis after removing one outlier study still revealed a significant pooled odds ratio of 3.52 (95%CI: 2.64–4.68) and an I2 of 33%.
Figure 18:

Forest plot showing pooled odds ratio of lower than normal values of lymphocyte count being associated with severe clinical course.
Twelve studies evaluated platelet count and found that lower than normal values of platelet count was significantly associated with severe clinical course with a pooled odds ratio of 1.78 (95% CI: 1.15–2.75) (Figure 19). Since the heterogeneity among the studies was high with an I2 value of 69%, a sensitivity analysis was done after removing two outlier studies, which again revealed a significant pooled odds ratio of 2.25 (95% CI: 1.52–3.33) with an I2 value of 47%.
Figure 19:

Forest plot showing pooled odds ratio of lower than normal values of platelet count being associated with severe clinical course.
Hemoglobin levels were compared between patients with good and severe clinical course in 8 studies. Patients with severe clinical course had significantly lower haemoglobin levels than patients with good clinical course (127 [95% CI: 125–129] versus 132 [95% CI: 129–134] g/L; p<0.01) (Figure 20).
Figure 20:

Comparison of mean hemoglobin values between patients with good and severe clinical course.
Serum creatinine as a factor associated with severe clinical course was evaluated in 12 studies. High serum creatinine was found to be significantly associated with severe clinical course with a pooled odds ratio of 2.34 (95% CI: 1.71–3.22) (Figure 21). The heterogeneity among studies was not significant with an I2 of 30%.
Figure 21:

Forest plot showing pooled odds ratio of high creatinine values being associated with severe clinical course.
Transaminases AST and ALT values were reported to be associated with severe clinical course by many studies. AST was evaluated in 11 studies and higher than normal values of AST was found to be significantly associated with severe clinical course (pooled odds ratio 2.31 [95% CI: 1.38–3.86]) (Figure 22). The heterogeneity among studies was high (I2 of 90%) so a sensitivity analysis was done after removing two outlier studies, which again revealed a significant pooled odds ratio of 2.96 (95% CI: 2.12–4.13) and a non-significant I2 of 44%. ALT was evaluated in 12 studies and higher than normal values of ALT was found to be significantly associated with severe clinical course (pooled odds ratio 1.69 [95% CI: 1.24–2.31]) (Figure 23). Since the heterogeneity among the studies was high (I2 74%), a sensitivity analysis was done after removing one outlier study, which still revealed a significant pooled odds ratio of 1.83 (95% CI: 1.47–2.27) and an I2 of 7%.
Figure 22:

Forest plot showing pooled odds ratio of higher than normal values of AST being associated with severe clinical course.
Figure 23:

Forest plot showing pooled odds ratio of higher than normal values of ALT being associated with severe clinical course.
Serum bilirubin was assessed in 6 studies and higher than normal values of serum bilirubin was found to be significantly associated with severe clinical course with a pooled odds ratio of 2.55 (95% CI: 1.83–3.54) (Figure 24). The heterogeneity among the studies was non-significant with an I2 of 25%.
Figure 24:

Forest plot showing pooled odds ratio of higher than normal values of serum bilirubin being associated with severe clinical course.
Serum albumin was assessed in 8 studies and lower than normal values of serum albumin was found to be significantly associated with severe clinical course with a pooled odds ratio of 4.34 (95% CI: 2.18–8.63) (Figure 25). Since the heterogeneity among studies was high with an I2 of 91%, a sensitivity analysis was done after removing one outlier study, which again revealed a significant pooled odds ratio of 5.00 (95% CI: 3.50–7.15) and I2 of 33%.
Figure 25:

Forest plot showing pooled odds ratio of lower than normal values of serum albumin being associated with severe clinical course.
Inflammatory and infection markers associated with severe clinical course
CRP as a factor associated with severe clinical course was evaluated in 13 studies. Higher than normal value of CRP was found to be significantly associated with severe clinical course with a pooled odds ratio of 5.78 (95% CI: 2.79–11.99) (Figure 26). Since the heterogeneity among studies was significant with an I2 of 94%, a sensitivity analysis was done after removing two outlier studies, which again showed a significant pooled odds ratio of 5.06 (95% CI: 3.52–7.28) and I2 of 42%.
Figure 26:

Forest plot showing pooled odds ratio of higher than normal values of C-reactive protein being associated with severe clinical course.
Serum D-dimer level as a factor associated with severe clinical course was evaluated in 11 studies. Higher than normal values of serum D-dimer was found to be significantly associated with severe clinical course with a pooled odds ratio of 4.03 (95% CI: 2.62–6.18) (Figure 27). The heterogeneity among studies was significant with an I2 of 66%. A sensitivity analysis was done after removing two outlier studies, which also revealed a significant pooled odds ratio of 3.13 (95% CI: 2.19–4.46) and an I2 of 44%.
Figure 27:

Forest plot showing pooled odds ratio of higher than normal values of D-dimer being associated with severe clinical course.
LDH was evaluated in 10 studies and high LDH was found to be significantly associated with severe clinical course with a pooled odds ratio of 4.59 (95% CI: 2.16–9.76) (Figure 28). Since the heterogeneity among the studies was high with an I2 of 95%, a sensitivity analysis was done after excluding 4 outlier studies, which again revealed a significant pooled odds ratio of 2.32 (95% CI: 1.63–3.31) and I2 of 22%.
Figure 28:

Forest plot showing pooled odds ratio of high LDH being associated with severe clinical course.
Serum procalcitonin was evaluated in 9 studies and high serum procalcitonin values were found to be significantly associated with severe clinical course (pooled odds ratio 5.45 [95% CI: 3.23–9.21]) (Figure 29). The heterogeneity among the studies was not high with an I2 of 36%.
Figure 29:

Forest plot showing pooled odds ratio of high serum procalcitonin being associated with severe clinical course.
Serum creatine kinase was evaluated in 7 studies and high serum creatine kinase values were found to be significantly associated with severe clinical course (pooled odds ratio 1.66 [95% CI: 1.12–2.45]) (Figure 30). The heterogeneity among the studies was not high with an I2 of 44%.
Figure 30:

Forest plot showing pooled odds ratio of high serum creatine kinase being associated with severe clinical course.
Summary of all factors associated with severe clinical course
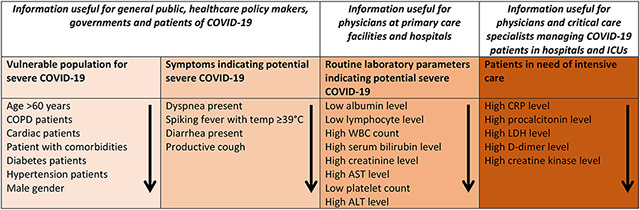
A summary forest plot was created to depict all the factors associated severe clinical course along with their odds ratios (95% CI) (Figure 31). In addition, based on the results of this meta-analysis a summary table was created (Table 7) categorizing factors into four groups: Vulnerable population for severe COVID-19, symptoms indicating potential severe COVID-19, routine laboratory parameters indicating potential severe COVID-19, and factors that indicate patients in need of intensive care.
Figure 31:

Summary forest plot showing odds ratios of all the factors associated with severe clinical course.
Table: 7:
Summary table of factors associated with severe COVID-19 in order of their importance under various categories, useful for various stakeholders.
|
DISCUSSION
To summarise the results of this systematic review and meta-analysis, the mean age of patients with COVID-19 is 49.7±16.3 years with a male to female ratio of 1.2:1. Common symptoms and their frequency are: fever (83.4%), cough (60.5%), fatigue (33.8%), sputum (28.9%), dyspnea (22.1%), myalgia (20.6%), chest tightness / pain (16.3%), sore throat (13.5%), headache (11.2%), diarhhea (7.5%), nasal congestion / rhinorrhea (6.7%), nausea / vomiting (5.6%), pain abdomen (4.6%), and hemoptysis (1.7%). The comorbidities associated with COVID-19 are: hypertension (18.4%), diabetes mellitus (9.8%), cardiovascular diseases (8.8%), endocrine diseases (5.8%), gastrointestinal diseases (5%), CLD (3%), and COPD (2.8%). Among the laboratory parameters WBC was low in 27%, high in 9%, platelets were low in 22.9%, creatinine was high in 6.5%, AST was high in 25.3%, ALT was high in 22.7%, bilirubin was high in 8.8%, albumin was low 60.1%, CT chest was abnormal in 89%, CRP was high in 67.5%, LDH was high in 52%, D-dimer was high in 34.8%, CK was high in 14.4%, and procalcitonin was high in 15.4%. Factors significantly associated severe clinical course (with their ORs) are as follows: High CRP (5.78), high procalcitonin (5.45), age ≥60 (4.82), dyspnea (4.66), high LDH (4.59), COPD (4.37), low albumin (4.34), high D-dimer (4.03), cardiac disease (3.88), low lymphocyte count (3.22), any associated comorbidity (3.16), diabetes mellitus (3.11), high WBC count (2.67), high bilirubin level (2.55), high creatinine (2.34), high AST (2.31), hypertension (2.30), low platelets (1.78), High ALT (1.69), high CK (1.66), fever spikes ≥39°C (1.59), diarrhea (1.55), male gender (1.47), and sputum (1.35).
The strengths of this systematic review and meta-analysis is that it included large number of studies: 58 studies involving 6892 for the data on demographic and clinical features, and 21 studies involving 3496 for data on factors associated with severe clinical course. This is the first meta-analysis on factors associated with severe clinical course. The results of this meta-analysis will help in early differentiation of patients who are likely to progress to severe clinical course and develop adverse outcome from those who are likely to remain stable and have better outcome. The healthcare resources such as hospital admission, HDU and ICU care, intensive monitoring, and organ support can be prioritized towards these potentially sicker patients which will help in saving their lives; while patients who are likely to have good clinical course can be managed at home or with minimal resource utilization.
The first objective of our systematic review was to study the clinical and laboratory manifestations of COVID-19, and our results confirm findings from previous other meta-analyses. According to a meta-analysis of 10 studies involving 1994 patients by Li LQ et al5 the main clinical symptoms of COVID-19 patients were fever (88.5%), cough (68.6%), myalgia or fatigue (35.8%), expectoration (28.2%), dyspnea (21.9%). In addition to common respiratory symptoms, the symptoms of headache or dizziness (12.1%) diarrhea (4.8%), nausea, and vomiting (3.9%) were also obvious in some patients5. Another meta-analysis by Rodriguez-Morales AJ et al7 revealed that of 656 patients, fever (88.7%), cough (57.6%) and dyspnea (45.6%) were the most prevalent manifestations. Among the patients, 20.3% required ICU, 32.8% presented with ARDS, 6.2% with shock, and 13.9% of hospitalized patients had fatal outcomes. In another metanalysis by Sun P et al4 of 10 studies including 50,466 patients, the incidence of fever was 89.1%, cough 72.2%, and muscle soreness or fatigue 42.5%. The incidence of ARDS was 14.8%, abnormal chest CT 96.6%, the percentage of severe cases in all infected cases was 18.1%, and the case fatality rate of patients with SARS-CoV-2 infection was 4.3%. In another meta-analysis of six studies with 1527 patients by Li B et al the proportions of hypertension, cardia-cerebrovascular disease and diabetes in patients with COVID-19 were 17.1%, 16.4% and 9.7%, respectively6. According to a meta-analysis by Yang J et al9 on eight studies with 46,248 patients the most prevalent clinical symptom was fever (91%), followed by cough (67%), fatigue (51%) and dyspnea (30%). The most prevalent comorbidities were hypertension (17%) and diabetes (8%), followed by cardiovascular diseases (5%) and respiratory system disease (2%). Both the meta-analyses, by Sun P et al4 and Yang J et al9, had included 44,672 patients from the database of Chinese Center for Disease Control and Prevention8, and a significant overlap between these 44,672 patients and patients from other studies is expected. It has been pointed out that reporting of the same patients of COVID-19 in different articles (without clear indication of the duplicate reporting) creates an inaccurate scientific record, may affect the accuracy of subsequent estimates of prevalence of the disease or outcomes, and may preclude valid meta-analyses, unless authors of the meta-analyses are able to obtain individual patient data to ensure that patients are not being counted more than once in any publication13. We in our meta-analysis have tried our best to avoid this flaw by excluding papers with potential overlap of patients, limiting our search to single database (PubMed), and limiting our search to English language only. This makes the results from our meta-analysis more robust and reliable.
Among the demographic factors, we found that advanced age was a very important predictor for severe clinical course. The mean age of patients who had severe clinical course was close to 60, which was at least one decade more than those who had better clinical course. The pooled odds ratio for patients with advanced age developing severe clinical course was 4.82. The implication of this finding is that the elderly population needs to be especially protected from contracting this virus, as they are about 5 times more likely to have a severe clinical course.
Patients with comorbidities, such as hypertension, cardiovascular disease, diabetes mellitus, and COPD among others were found have severe clinical course with odds ratios ranging from 2.3 to 4.37. Among all the comorbidities, COPD had the highest odds ratio for developing severe clinical course which is an expected finding, as development of pneumonia or ARDS on already compromised lungs could be detrimental in these patients. The vulnerability of patients with cardiac disease and hypertension developing severe clinical course is a surprising finding. Guo et al35 recently showed that 27.8% of severe COVID-19 patients had evidence of myocardial injury as indicated by elevated troponin levels, and they had higher mortality. According to a meta-analysis by Lippi G et al36 the values of cardiac troponin I were found to be significantly elevated in COVID-19 patients with severe disease compared to non-severe disease. Another study by Shi S et al37 found that cardiac injury was a common complication occurring in 19.7% patients of COVID-19, and there was a statistically significant association between cardiac injury and mortality. In patients with underlying cardiovascular diseases such as coronary artery disease, hypertension, and cardiomyopathy, viral illnesses such as COVID-19 can further damage myocardial cells through several mechanisms including direct damage by the virus, systemic inflammatory responses, destabilized coronary plaque, and aggravated hypoxia35. Whether SARS-CoV-2 directly damages cardiomyocytes is not known, however, it has been shown previously that the closely related virus SARS-CoV can mediate myocardial inflammation and damage by down-regulation of myocardial ACE2 system, which may be responsible for the myocardial dysfunction and adverse cardiac outcomes in patients with SARS38.
Among the presenting symptoms of COVID-19, presence of dyspnea, fever spikes ≥39°C, diarrhea, and productive cough indicate impending severe clinical course. Dyspnea, high fever and sputum production indicates likely presence of pneumonia, and these are the patients who might develop respiratory failure. This finding from our meta-analysis, along with finding of vulnerable comorbidities, holds a lot of significance from public health perspective in the epidemic setting of COVID-19. This information needs to be conveyed to the general public that if they are elderly with comorbidities, and notice symptoms of dyspnea, high fever above 39°C, and productive cough, they should seek medical help immediately as their disease is likely to progress.
Among the laboratory parameters, we found certain routine parameters such as low albumin, low lymphocyte count, high WBC count, high bilirubin level, high creatinine level, high AST/ALT, and low platelets to be significantly associated with severe clinical course. A meta-analysis by Lippi G et al39 had also suggested that low platelet count was associated with increased risk of severe disease and mortality in patients with COVID-19. These simple laboratory parameters such as CBC, renal, and liver function tests can be done even at primary healthcare level, even in resource poor settings, and help in triaging vulnerable patients to more specialized care,
Among the inflammatory and infection markers, high CRP, high procalcitonin, high LDH, high D-dimer, and high CK were found to be significantly associated with severe clinical course. While CRP is not only a marker of increased cardiovascular events and infection, it plays important roles in inflammatory processes and host responses to infection including the complement pathway, apoptosis, phagocytosis, nitric oxide (NO) release, and the production of cytokines, particularly interleukin-6 and tumor necrosis factor-α40. Procalcitonin is a helpful biomarker for early diagnosis of sepsis in critically ill patients41. LDH is an indicator of tissue damage. D-dimer not only serves as a valuable marker of activation of coagulation and fibrinolysis, it also is a significant prognostic factor in patients with infection and sepsis42. Elevated serum levels of CK have been used as a sensitive, but nonspecific, test for myocardial injury. All these markers indicate activation of systemic inflammatory response syndrome with or without super-added bacterial sepsis. These markers have important prognostic significance and are associated with higher mortality. Lippi G et al43 had also shown that increased procalcitonin values was associated with a nearly 5-fold higher risk of severe SARS-CoV-2 infection. Elevated procalcitonin level indicates super-added bacterial sepsis, and might also help in guiding antibiotic use in these critically ill patients. All these markers are routinely done in tertiary care settings, especially in patients admitted in HDUs and ICUs. The results on these markers from our meta-analysis will guide physicians and critical specialists managing these sick patients in prioritizing intensive care resources to patients who are likely to have a severe clinical course.
Our meta-analysis had a few limitations. The first limitation was that several of the identified factors may be confounding variables, and which of these factors are independently associated with severe clinical course could not be determined. Since our meta-analysis included only retrospective case series with a lot of heterogeneity, identification of independent factors was not possible. Only a well-designed prospective study can identify independent factors associated with severe clinical course or mortality. Second limitation was the heterogeneity among the studies with regards to the clinical endpoints. For example, clubbing studies that compared patients with and without ICU admission with studies that used mortality as endpoint may not be statistically justified. However, many of the included studies had patients which were still admitted and a sufficient follow-up time has still not elapsed to determine their final outcome. Hence our use of ‘severe clinical course’ as an endpoint in our meta-analysis was the best approximation for clubbing the varied endpoints in all these studies.
In conclusion, during the midst of COVID-19 pandemic, the findings from our study has several potential implications for multiple stakeholders: the general public, healthcare policy makers, governments, patients of COVID-19, physicians at the primary care facilities, physicians managing COVID-19 patients in hospitals, and critical care specialists of ICUs. Our study clearly elucidated the list of vulnerable populations and symptoms which indicate potential severe COVID-19 disease. We also determined routine and specialized laboratory parameters associated with severe clinical course of COVID-19. The information on vulnerable population and potentially severe symptoms should be disseminated to the general public, healthcare policy makers and governments at places where COVID-19 epidemic is ongoing. This information will help the public in understanding whether they are at risk of severe COVID-19, and whether their symptoms merit immediate hospital care. This self-triage by the patients will prevent hospitals from getting overcrowded by thousands of patients, most of whom do not need hospital care. Physicians working at the primary care facilities and hospitals managing COVID-19 patients can learn from our meta-analysis derangement of which of the routine laboratory parameters indicate potentially severe disease requiring admission or referral to specialized centers. Physicians and critical care specialists working at tertiary care centers and ICUs can guide their treatment from this meta-analysis, based on the laboratory, inflammatory and infection markers.
RESEARCH IN CONTEXT.
Evidence before this study
COVID-19 is a new disease which has become a global pandemic, and is caused by a novel coronavirus, SARS-CoV-2. Knowledge of this disease is still incomplete and evolving. We searched the PubMed for studies published between Jan 1, 2020 and Mar 17, 2020 and found that many retrospective case series have been published on clinical, laboratory and imaging manifestations of COVID-19. However, most of these case series have small sample size, and the data in them are heterogenous and conflicting. A few meta-analyses have also been published on clinical manifestations of COVID-19, however, these meta-analyses have either included small number of studies with limited number of patients or have included overlapping patients from other studies. In addition, since many patients with COVID-19 have rapid course and within days may require ICU admission and mechanical ventilation, hence, it is essential to identify early which patients are likely go into severe clinical course. To the best of our knowledge, no meta-analysis has been published so far studying the factors associated with severe clinical course of COVID-19.
Added value of this study
This systematic review of 6892 patients (58 studies) described the demographic, clinical and laboratory manifestations of COVID-19. Since we included a large number of studies and avoided overlapping data, our estimate of these data is robust and reliable. Our meta-analysis of 3496 patients (21 studies), determined with high-certainty evidence, the demographic, clinical and laboratory factors associated with severe clinical course of COVID-19. The factors (in order of theirs ORs) can be categorized into 4 groups: Vulnerable populations (age >60 years, COPD patients, cardiac patients, patient with comorbidities, diabetes patients, hypertension patients, and male gender); symptoms indicating potential severe disease (dyspnea present, spiking fever with temp ≥39°C, diarrhea present, and productive cough); routine laboratory parameters indicating potential severe disease (low albumin level, low lymphocyte level, high WBC count, high serum bilirubin level, high creatinine level, high AST level, low platelet count, and high ALT level); and patients who may need intensive care (high CRP level, high procalcitonin level, high LDH level, high D-dimer level, and high creatine kinase level).
Implications of all the available evidence
During the midst of COVID-19 pandemic, the findings from our study has several potential implications for multiple stakeholders: the general public, healthcare policy makers, governments, patients of COVID-19, physicians at the primary care facilities, physicians managing COVID-19 patients in hospitals, and critical care specialists of ICUs. Our study clearly elucidated the list of vulnerable populations and symptoms which indicate potential severe COVID-19 disease. This information should be disseminated to the general public at places where COVID-19 epidemic is ongoing. This information will help the public in understanding whether they are at risk of severe COVID-19, and which of their symptoms should make them seek immediate in-hospital medical care and which patients can be safely managed at home by just telephonic consultation. This self-triage by the patients will prevent hospitals from getting overwhelmed by thousands of patients, most of whom do not need hospital care. Physicians working at the primary care facilities and hospitals managing COVID-19 patients can learn from our meta-analysis derangement of which of the routine laboratory parameters (such as albumin level or WBC count) indicate potentially severe disease requiring admission or referral to specialized centers. Physicians and critical care specialists working at tertiary care centers and ICUs can be guided from this meta-analysis, based on the inflammatory and infection markers, which patients need intensive care, and which be managed at less intensive settings.
Footnotes
Declaration of interests
We declare no competing interests.
REFERENCES
- 1.Johns Hopkins Coronavirus Resource Center. Johns Hopkins Coronavirus Resource Center. https://coronavirus.jhu.edu/ (accessed March 30, 2020).
- 2.Mahase E. Covid-19: WHO declares pandemic because of ‘alarming levels’ of spread, severity, and inaction. BMJ 2020; 368: m1036. [DOI] [PubMed] [Google Scholar]
- 3.Lu R, Zhao X, Li J, et al. Genomic characterisation and epidemiology of 2019 novel coronavirus: implications for virus origins and receptor binding. Lancet 2020; 395: 565–74. [DOI] [PMC free article] [PubMed] [Google Scholar]
- 4.Sun P, Qie S, Liu Z, Ren J, Li K, Xi J. Clinical characteristics of hospitalized patients with SARS-CoV-2 infection: A single arm meta-analysis. J Med Virol 2020; published online Feb 28. DOI: 10.1002/jmv.25735 [DOI] [PMC free article] [PubMed] [Google Scholar]
- 5.Li L-Q, Huang T, Wang Y-Q, et al. 2019 novel coronavirus patients’ clinical characteristics, discharge rate and fatality rate of meta-analysis. J Med Virol 2020; published online March 12. DOI: 10.1002/jmv.25757 [DOI] [PMC free article] [PubMed] [Google Scholar]
- 6.Li B, Yang J, Zhao F, et al. Prevalence and impact of cardiovascular metabolic diseases on COVID-19 in China. Clin Res Cardiol 2020; published online March 11. DOI: 10.1007/s00392-020-01626-9 [DOI] [PMC free article] [PubMed] [Google Scholar]
- 7.Rodriguez-Morales AJ, Cardona-Ospina JA, Gutiérrez-Ocampo E, et al. Clinical, laboratory and imaging features of COVID-19: A systematic review and meta-analysis. Travel Med Infect Dis 2020; : 101623. [DOI] [PMC free article] [PubMed] [Google Scholar]
- 8.Novel Coronavirus Pneumonia Emergency Response Epidemiology Team. [The epidemiological characteristics of an outbreak of 2019 novel coronavirus diseases (COVID-19) in China]. Zhonghua Liu Xing Bing Xue Za Zhi 2020; 41: 145–51.32064853 [Google Scholar]
- 9.Yang J, Zheng Y, Gou X, et al. Prevalence of comorbidities in the novel Wuhan coronavirus (COVID-19) infection: a systematic review and meta-analysis. Int J Infect Dis 2020; published online March 12. DOI: 10.1016/j.ijid.2020.03.017 [DOI] [PMC free article] [PubMed] [Google Scholar]
- 10.Moher D, Liberati A, Tetzlaff J, Altman DG, PRISMA Group. Preferred reporting items for systematic reviews and meta-analyses: the PRISMA statement. BMJ 2009; 339: b2535. [DOI] [PMC free article] [PubMed] [Google Scholar]
- 11.Liberati A, Altman DG, Tetzlaff J, et al. The PRISMA statement for reporting systematic reviews and meta-analyses of studies that evaluate health care interventions: explanation and elaboration. PLoS Med 2009; 6: e1000100. [DOI] [PMC free article] [PubMed] [Google Scholar]
- 12.武汉市卫生健康委员会 [Wuhan Municipal Health Committee]. http://wjw.wuhan.gov.cn/front/web/showDetail/2019123108989 (accessed March 23, 2020).
- 13.Bauchner H, Golub RM, Zylke J. Editorial Concern-Possible Reporting of the Same Patients With COVID-19 in Different Reports. JAMA 2020; published online March 16. DOI: 10.1001/jama.2020.3980 [DOI] [PubMed] [Google Scholar]
- 14.Clinical management of severe acute respiratory infection when novel coronavirus (nCoV) infection is suspected. https://www.who.int/publications-detail/clinical-management-of-severe-acute-respiratory-infection-when-novel-coronavirus-(ncov)-infection-is-suspected (accessed March 28, 2020).
- 15.Diagnosis and treatment of pneumonitis with a new coronavirus infection (Trial version 3). http://www.nhc.gov.cn/xcs/zhengcwj/202001/f492c9153ea9437bb587ce2ffcbee1fa/files/39e7578d85964dbe81117736dd789d8f.pdf (accessed March 28, 2020).
- 16.关于印发新型冠状病毒感染的肺炎诊疗方案(试行第五版)的通知 国家中医药管理 局政府网站 [Notice on Issuing a New Coronavirus Infected Pneumonia Diagnosis and Treatment Plan (Trial Version 5)]. http://bgs.satcm.gov.cn/zhengcewenjian/2020-02-06/12847.html (accessed March 28, 2020).
- 17.Study Quality Assessment Tools | National Heart, Lung, and Blood Institute (NHLBI). https://www.nhlbi.nih.gov/health-topics/study-quality-assessment-tools (accessed March 28, 2020).
- 18.Wan X, Wang W, Liu J, Tong T. Estimating the sample mean and standard deviation from the sample size, median, range and/or interquartile range. BMC Med Res Methodol 2014; 14: 135. [DOI] [PMC free article] [PubMed] [Google Scholar]
- 19.Hasselblad V, Hedges LV. Meta-analysis of screening and diagnostic tests. Psychol Bull 1995; 117: 167–78. [DOI] [PubMed] [Google Scholar]
- 20.Wallace BC, Dahabreh IJ, Trikalinos TA, Lau J, Trow P, Schmid CH. Closing the Gap between Methodologists and End-Users: R as a Computational Back-End. Journal of Statistical Software 2012; 49: 1–15. [Google Scholar]
- 21.Chung M, Bernheim A, Mei X, et al. CT Imaging Features of 2019 Novel Coronavirus (2019-nCoV). Radiology 2020; : 200230. [DOI] [PMC free article] [PubMed] [Google Scholar]
- 22.Bernheim A, Mei X, Huang M, et al. Chest CT Findings in Coronavirus Disease-19 (COVID-19): Relationship to Duration of Infection. Radiology 2020; : 200463. [DOI] [PMC free article] [PubMed] [Google Scholar]
- 23.Ki M, -nCoV TFF. Epidemiologic characteristics of early cases with 2019 novel coronavirus (2019-nCoV) disease in Republic of Korea. Epidemiol Health 2020; : e2020007. [DOI] [PMC free article] [PubMed] [Google Scholar]
- 24.COVID-19 National Emergency Response Center, Epidemiology and Case Management Team, Korea Centers for Disease Control and Prevention. Early Epidemiological and Clinical Characteristics of 28 Cases of Coronavirus Disease in South Korea. Osong Public Health Res Perspect 2020; 11: 8–14. [DOI] [PMC free article] [PubMed] [Google Scholar]
- 25.Chen H, Guo J, Wang C, et al. Clinical characteristics and intrauterine vertical transmission potential of COVID-19 infection in nine pregnant women: a retrospective review of medical records. Lancet 2020; 395: 809–15. [DOI] [PMC free article] [PubMed] [Google Scholar]
- 26.Yoon SH, Lee KH, Kim JY, et al. Chest Radiographic and CT Findings of the 2019 Novel Coronavirus Disease (COVID-19): Analysis of Nine Patients Treated in Korea. Korean J Radiol 2020; published online 26. DOI: 10.3348/kjr.2020.0132 [DOI] [PMC free article] [PubMed] [Google Scholar]
- 27.Liu H, Liu F, Li J, Zhang T, Wang D, Lan W. Clinical and CT Imaging Features of the COVID-19 Pneumonia: Focus on Pregnant Women and Children. J Infect 2020; published online March 11. DOI: 10.1016/j.jinf.2020.03.007 [DOI] [PMC free article] [PubMed] [Google Scholar]
- 28.Xu T, Chen C, Zhu Z, et al. Clinical features and dynamics of viral load in imported and non-imported patients with COVID-19. Int J Infect Dis 2020; published online March 13. DOI: 10.1016/j.ijid.2020.03.022 [DOI] [PMC free article] [PubMed] [Google Scholar]
- 29.Qu R, Ling Y, Zhang Y-H, et al. Platelet-to-lymphocyte ratio is associated with prognosis in patients with Corona Virus Disease-19. J Med Virol 2020; published online March 17. DOI: 10.1002/jmv.25767 [DOI] [PMC free article] [PubMed] [Google Scholar]
- 30.To KK-W, Tsang OT-Y, Chik-Yan Yip C, et al. Consistent detection of 2019 novel coronavirus in saliva. Clin Infect Dis 2020; published online Feb 12. DOI: 10.1093/cid/ciaa149 [DOI] [PMC free article] [PubMed] [Google Scholar]
- 31.Pan Y, Guan H, Zhou S, et al. Initial CT findings and temporal changes in patients with the novel coronavirus pneumonia (2019-nCoV): a study of 63 patients in Wuhan, China. Eur Radiol 2020; published online Feb 13. DOI: 10.1007/s00330-020-06731-x [DOI] [PMC free article] [PubMed] [Google Scholar]
- 32.Pan F, Ye T, Sun P, et al. Time Course of Lung Changes On Chest CT During Recovery From 2019 Novel Coronavirus (COVID-19) Pneumonia. Radiology 2020; : 200370. [DOI] [PMC free article] [PubMed] [Google Scholar]
- 33.Liang W, Guan W, Chen R, et al. Cancer patients in SARS-CoV-2 infection: a nationwide analysis in China. Lancet Oncol 2020; 21: 335–7. [DOI] [PMC free article] [PubMed] [Google Scholar]
- 34.Guan W-J, Ni Z-Y, Hu Y, et al. Clinical Characteristics of Coronavirus Disease 2019 in China. N Engl J Med 2020; published online Feb 28. DOI: 10.1056/NEJMoa2002032 [DOI] [PMC free article] [PubMed] [Google Scholar]
- 35.Guo T, Fan Y, Chen M, et al. Cardiovascular Implications of Fatal Outcomes of Patients With Coronavirus Disease 2019 (COVID-19). JAMA Cardiol 2020; published online March 27. DOI: 10.1001/jamacardio.2020.1017 [DOI] [PMC free article] [PubMed] [Google Scholar]
- 36.Lippi G, Lavie CJ, Sanchis-Gomar F. Cardiac troponin I in patients with coronavirus disease 2019 (COVID-19): Evidence from a meta-analysis. Prog Cardiovasc Dis 2020; published online March 10. DOI: 10.1016/j.pcad.2020.03.001 [DOI] [PMC free article] [PubMed] [Google Scholar]
- 37.Shi S, Qin M, Shen B, et al. Association of Cardiac Injury With Mortality in Hospitalized Patients With COVID-19 in Wuhan, China. JAMA Cardiol 2020; published online March 25. DOI: 10.1001/jamacardio.2020.0950 [DOI] [PMC free article] [PubMed] [Google Scholar]
- 38.Oudit GY, Kassiri Z, Jiang C, et al. SARS-coronavirus modulation of myocardial ACE2 expression and inflammation in patients with SARS. Eur J Clin Invest 2009; 39: 618–25. [DOI] [PMC free article] [PubMed] [Google Scholar]
- 39.Lippi G, Plebani M, Michael Henry B. Thrombocytopenia is associated with severe coronavirus disease 2019 (COVID-19) infections: A meta-analysis. Clin Chim Acta 2020; published online March 13. DOI: 10.1016/j.cca.2020.03.022 [DOI] [PMC free article] [PubMed] [Google Scholar]
- 40.Sproston NR, Ashworth JJ. Role of C-Reactive Protein at Sites of Inflammation and Infection. Front Immunol 2018; 9: 754. [DOI] [PMC free article] [PubMed] [Google Scholar]
- 41.Wacker C, Prkno A, Brunkhorst FM, Schlattmann P. Procalcitonin as a diagnostic marker for sepsis: a systematic review and meta-analysis. Lancet Infect Dis 2013; 13: 426–35. [DOI] [PubMed] [Google Scholar]
- 42.Rodelo JR, De la Rosa G, Valencia ML, et al. D-dimer is a significant prognostic factor in patients with suspected infection and sepsis. Am J Emerg Med 2012; 30: 1991–9. [DOI] [PubMed] [Google Scholar]
- 43.Lippi G, Plebani M. Procalcitonin in patients with severe coronavirus disease 2019 (COVID-19): A meta-analysis. Clin Chim Acta 2020; 505: 190–1. [DOI] [PMC free article] [PubMed] [Google Scholar]
- 44.Huang C, Wang Y, Li X, et al. Clinical features of patients infected with 2019 novel coronavirus in Wuhan, China. Lancet 2020; 395: 497–506. [DOI] [PMC free article] [PubMed] [Google Scholar]
- 45.Chan JF-W, Yuan S, Kok K-H, et al. A familial cluster of pneumonia associated with the 2019 novel coronavirus indicating person-to-person transmission: a study of a family cluster. Lancet 2020; 395: 514–23. [DOI] [PMC free article] [PubMed] [Google Scholar]
- 46.Li Q, Guan X, Wu P, et al. Early Transmission Dynamics in Wuhan, China, of Novel Coronavirus-Infected Pneumonia. N Engl J Med 2020; published online Jan 29. DOI: 10.1056/NEJMoa2001316 [DOI] [PMC free article] [PubMed] [Google Scholar]
- 47.Chen N, Zhou M, Dong X, et al. Epidemiological and clinical characteristics of 99 cases of 2019 novel coronavirus pneumonia in Wuhan, China: a descriptive study. Lancet 2020; 395: 507–13. [DOI] [PMC free article] [PubMed] [Google Scholar]
- 48.Song F, Shi N, Shan F, et al. Emerging Coronavirus 2019-nCoV Pneumonia. Radiology 2020; : 200274. [Google Scholar]
- 49.Wang D, Hu B, Hu C, et al. Clinical Characteristics of 138 Hospitalized Patients With 2019 Novel Coronavirus-Infected Pneumonia in Wuhan, China. JAMA 2020; published online Feb 7. DOI: 10.1001/jama.2020.1585 [DOI] [PMC free article] [PubMed] [Google Scholar]
- 50.Liu K, Fang Y-Y, Deng Y, et al. Clinical characteristics of novel coronavirus cases in tertiary hospitals in Hubei Province. Chin Med J 2020; published online Feb 7. DOI: 10.1097/CM9.0000000000000744 [DOI] [PMC free article] [PubMed] [Google Scholar]
- 51.Chang D, Lin M, Wei L, et al. Epidemiologic and Clinical Characteristics of Novel Coronavirus Infections Involving 13 Patients Outside Wuhan, China. JAMA 2020; published online Feb 7. DOI: 10.1001/jama.2020.1623 [DOI] [PMC free article] [PubMed] [Google Scholar]
- 52.Liu Y, Yang Y, Zhang C, et al. Clinical and biochemical indexes from 2019-nCoV infected patients linked to viral loads and lung injury. Sci China Life Sci 2020; 63: 364–74. [DOI] [PMC free article] [PubMed] [Google Scholar]
- 53.Ren L-L, Wang Y-M, Wu Z-Q, et al. Identification of a novel coronavirus causing severe pneumonia in human: a descriptive study. Chin Med J 2020; published online Feb 11. DOI: 10.1097/CM9.0000000000000722 [DOI] [PMC free article] [PubMed] [Google Scholar]
- 54.Tang N, Li D, Wang X, Sun Z. Abnormal coagulation parameters are associated with poor prognosis in patients with novel coronavirus pneumonia. J Thromb Haemost 2020; published online Feb 19. DOI: 10.1111/jth.14768 [DOI] [PMC free article] [PubMed] [Google Scholar]
- 55.Zhang J-J, Dong X, Cao Y-Y, et al. Clinical characteristics of 140 patients infected with SARS-CoV-2 in Wuhan, China. Allergy 2020; published online Feb 19. DOI: 10.1111/all.14238 [DOI] [PubMed] [Google Scholar]
- 56.Xu X-W, Wu X-X, Jiang X-G, et al. Clinical findings in a group of patients infected with the 2019 novel coronavirus (SARS-Cov-2) outside of Wuhan, China: retrospective case series. BMJ 2020; 368: m606. [DOI] [PMC free article] [PubMed] [Google Scholar]
- 57.Wu J, Wu X, Zeng W, et al. Chest CT Findings in Patients with Corona Virus Disease 2019 and its Relationship with Clinical Features. Invest Radiol 2020; published online Feb 21. DOI: 10.1097/RLI.0000000000000670 [DOI] [PMC free article] [PubMed] [Google Scholar]
- 58.Kwok KO, Wong V, Wei VWI, Wong SYS, Tang JW-T. Novel coronavirus (2019-nCoV) cases in Hong Kong and implications for further spread. J Infect 2020; published online Feb 22. DOI: 10.1016/j.jinf.2020.02.002 [DOI] [PMC free article] [PubMed] [Google Scholar]
- 59.Shi H, Han X, Jiang N, et al. Radiological findings from 81 patients with COVID-19 pneumonia in Wuhan, China: a descriptive study. Lancet Infect Dis 2020; published online Feb 24. DOI: 10.1016/S1473-3099(20)30086-4 [DOI] [PMC free article] [PubMed] [Google Scholar]
- 60.Yang X, Yu Y, Xu J, et al. Clinical course and outcomes of critically ill patients with SARS-CoV-2 pneumonia in Wuhan, China: a single-centered, retrospective, observational study. Lancet Respir Med 2020; published online Feb 24. DOI: 10.1016/S2213-2600(20)30079-5 [DOI] [PMC free article] [PubMed] [Google Scholar]
- 61.Xu Y-H, Dong J-H, An W-M, et al. Clinical and computed tomographic imaging features of novel coronavirus pneumonia caused by SARS-CoV-2. J Infect 2020; published online Feb 25. DOI: 10.1016/j.jinf.2020.02.017 [DOI] [PMC free article] [PubMed] [Google Scholar]
- 62.Ai T, Yang Z, Hou H, et al. Correlation of Chest CT and RT-PCR Testing in Coronavirus Disease 2019 (COVID-19) in China: A Report of 1014 Cases. Radiology 2020; : 200642. [DOI] [PMC free article] [PubMed] [Google Scholar]
- 63.Yang W, Cao Q, Qin L, et al. Clinical characteristics and imaging manifestations of the 2019 novel coronavirus disease (COVID-19): A multi-center study in Wenzhou city, Zhejiang, China. J Infect 2020; published online Feb 26. DOI: 10.1016/j.jinf.2020.02.016 [DOI] [PMC free article] [PubMed] [Google Scholar]
- 64.Tian S, Hu N, Lou J, et al. Characteristics of COVID-19 infection in Beijing. J Infect 2020; published online Feb 27. DOI: 10.1016/j.jinf.2020.02.018 [DOI] [PMC free article] [PubMed] [Google Scholar]
- 65.Huang Y, Tu M, Wang S, et al. Clinical characteristics of laboratory confirmed positive cases of SARS-CoV-2 infection in Wuhan, China: A retrospective single center analysis. Travel Med Infect Dis 2020; : 101606. [DOI] [PMC free article] [PubMed] [Google Scholar]
- 66.Xu X, Yu C, Qu J, et al. Imaging and clinical features of patients with 2019 novel coronavirus SARS-CoV-2. Eur J Nucl Med Mol Imaging 2020; published online Feb 28. DOI: 10.1007/s00259-020-04735-9 [DOI] [PMC free article] [PubMed] [Google Scholar]
- 67.Liu W, Tao Z-W, Lei W, et al. Analysis of factors associated with disease outcomes in hospitalized patients with 2019 novel coronavirus disease. Chin Med J 2020; published online Feb 28. DOI: 10.1097/CM9.0000000000000775 [DOI] [PMC free article] [PubMed] [Google Scholar]
- 68.Li K, Wu J, Wu F, et al. The Clinical and Chest CT Features Associated with Severe and Critical COVID-19 Pneumonia. Invest Radiol 2020; published online Feb 29. DOI: 10.1097/RLI.0000000000000672 [DOI] [PMC free article] [PubMed] [Google Scholar]
- 69.Wu J, Liu J, Zhao X, et al. Clinical Characteristics of Imported Cases of COVID-19 in Jiangsu Province: A Multicenter Descriptive Study. Clin Infect Dis 2020; published online Feb 29. DOI: 10.1093/cid/ciaa199 [DOI] [PMC free article] [PubMed] [Google Scholar]
- 70.Cao J, Hu X, Cheng W, Yu L, Tu W-J, Liu Q. Clinical features and short-term outcomes of 18 patients with corona virus disease 2019 in intensive care unit. Intensive Care Med 2020; published online March 2. DOI: 10.1007/s00134-020-05987-7 [DOI] [PMC free article] [PubMed] [Google Scholar]
- 71.Ruan Q, Yang K, Wang W, Jiang L, Song J. Clinical predictors of mortality due to COVID-19 based on an analysis of data of 150 patients from Wuhan, China. Intensive Care Med 2020; published online March 3. DOI: 10.1007/s00134-020-05991-x [DOI] [PMC free article] [PubMed] [Google Scholar]
- 72.Zhao W, Zhong Z, Xie X, Yu Q, Liu J. Relation Between Chest CT Findings and Clinical Conditions of Coronavirus Disease (COVID-19) Pneumonia: A Multicenter Study. AJR Am J Roentgenol 2020; : 1–6. [DOI] [PubMed] [Google Scholar]
- 73.Xiao F, Tang M, Zheng X, Liu Y, Li X, Shan H. Evidence for gastrointestinal infection of SARS-CoV-2. Gastroenterology 2020; published online March 3. DOI: 10.1053/j.gastro.2020.02.055 [DOI] [PMC free article] [PubMed] [Google Scholar]
- 74.Xiong Y, Sun D, Liu Y, et al. Clinical and High-Resolution CT Features of the COVID-19 Infection: Comparison of the Initial and Follow-up Changes. Invest Radiol 2020; published online March 3. DOI: 10.1097/RLI.0000000000000674 [DOI] [PMC free article] [PubMed] [Google Scholar]
- 75.Young BE, Ong SWX, Kalimuddin S, et al. Epidemiologic Features and Clinical Course of Patients Infected With SARS-CoV-2 in Singapore. JAMA 2020; published online March 3. DOI: 10.1001/jama.2020.3204 [DOI] [PMC free article] [PubMed] [Google Scholar]
- 76.Zhang J, Wang S, Xue Y. Fecal specimen diagnosis 2019 novel coronavirus-infected pneumonia. J Med Virol 2020; published online March 3. DOI: 10.1002/jmv.25742 [DOI] [PMC free article] [PubMed] [Google Scholar]
- 77.Li Y, Xia L. Coronavirus Disease 2019 (COVID-19): Role of Chest CT in Diagnosis and Management. AJR Am J Roentgenol 2020; : 1–7. [DOI] [PubMed] [Google Scholar]
- 78.Hu Z, Song C, Xu C, et al. Clinical characteristics of 24 asymptomatic infections with COVID-19 screened among close contacts in Nanjing, China. Sci China Life Sci 2020; published online March 4. DOI: 10.1007/s11427-020-1661-4 [DOI] [PMC free article] [PubMed] [Google Scholar]
- 79.Yao Y, Tian Y, Zhou J, Ma X, Yang M, Wang S. Epidemiological characteristics of 2019-ncoV infections in Shaanxi, China by February 8, 2020. Eur Respir J 2020; published online March 5. DOI: 10.1183/13993003.00310-2020 [DOI] [PMC free article] [PubMed] [Google Scholar]
- 80.Zhou S, Wang Y, Zhu T, Xia L. CT Features of Coronavirus Disease 2019 (COVID-19) Pneumonia in 62 Patients in Wuhan, China. AJR Am J Roentgenol 2020; : 1–8. [DOI] [PubMed] [Google Scholar]
- 81.Spiteri G, Fielding J, Diercke M, et al. First cases of coronavirus disease 2019 (COVID-19) in the WHO European Region, 24 January to 21 February 2020. Euro Surveill 2020; 25 DOI: 10.2807/1560-7917.ES.2020.25.9.2000178 [DOI] [PMC free article] [PubMed] [Google Scholar]
- 82.Wang L, Gao Y-H, Lou L-L, Zhang G-J. The clinical dynamics of 18 cases of COVID-19 outside of Wuhan, China. Eur Respir J 2020; published online March 5. DOI: 10.1183/13993003.00398-2020 [DOI] [PMC free article] [PubMed] [Google Scholar]
- 83.Zhang S, Li H, Huang S, You W, Sun H. High-resolution CT features of 17 cases of Corona Virus Disease 2019 in Sichuan province, China. Eur Respir J 2020; published online March 5. DOI: 10.1183/13993003.00334-2020 [DOI] [PMC free article] [PubMed] [Google Scholar]
- 84.Zhou F, Yu T, Du R, et al. Clinical course and risk factors for mortality of adult inpatients with COVID-19 in Wuhan, China: a retrospective cohort study. Lancet 2020; published online March 11. DOI: 10.1016/S0140-6736(20)30566-3 [DOI] [PMC free article] [PubMed] [Google Scholar]
- 85.COVID-19 National Incident Room Surveillance Team. COVID-19, Australia: Epidemiology Report 6 (Reporting week ending 19:00 AEDT 7 March 2020). Commun Dis Intell (2018) 2020; 44 DOI: 10.33321/cdi.2020.44.21 [DOI] [PubMed] [Google Scholar]
- 86.Liu K, Chen Y, Lin R, Han K. Clinical feature of COVID-19 in elderly patients: a comparison with young and middle-aged patients. J Infect 2020; published online March 11. DOI: 10.1016/j.jinf.2020.03.005 [DOI] [PMC free article] [PubMed] [Google Scholar]
- 87.Chen J, Qi T, Liu L, et al. Clinical progression of patients with COVID-19 in Shanghai, China. J Infect 2020; published online March 11. DOI: 10.1016/j.jinf.2020.03.004 [DOI] [PMC free article] [PubMed] [Google Scholar]
- 88.Zhao D, Yao F, Wang L, et al. A comparative study on the clinical features of COVID-19 pneumonia to other pneumonias. Clin Infect Dis 2020; published online March 12. DOI: 10.1093/cid/ciaa247 [DOI] [PMC free article] [PubMed] [Google Scholar]
- 89.Chen Q, Quan B, Li X, et al. A report of clinical diagnosis and treatment of 9 cases of coronavirus disease 2019. J Med Virol 2020; published online March 12. DOI: 10.1002/jmv.25755 [DOI] [PMC free article] [PubMed] [Google Scholar]
- 90.Wu C, Chen X, Cai Y, et al. Risk Factors Associated With Acute Respiratory Distress Syndrome and Death in Patients With Coronavirus Disease 2019 Pneumonia in Wuhan, China. JAMA Intern Med 2020; published online March 13. DOI: 10.1001/jamainternmed.2020.0994 [DOI] [PMC free article] [PubMed] [Google Scholar]
- 91.Zhu W, Xie K, Lu H, Xu L, Zhou S, Fang S. Initial clinical features of suspected Coronavirus Disease 2019 in two emergency departments outside of Hubei, China. J Med Virol 2020; published online March 13. DOI: 10.1002/jmv.25763 [DOI] [PMC free article] [PubMed] [Google Scholar]
- 92.Cheng Z, Lu Y, Cao Q, et al. Clinical Features and Chest CT Manifestations of Coronavirus Disease 2019 (COVID-19) in a Single-Center Study in Shanghai, China. AJR Am J Roentgenol 2020; : 1–6. [DOI] [PubMed] [Google Scholar]
- 93.Mo P, Xing Y, Xiao Y, et al. Clinical characteristics of refractory COVID-19 pneumonia in Wuhan, China. Clin Infect Dis 2020; published online March 16. DOI: 10.1093/cid/ciaa270 [DOI] [PMC free article] [PubMed] [Google Scholar]
- 94.Wang Z, Yang B, Li Q, Wen L, Zhang R. Clinical Features of 69 Cases with Coronavirus Disease 2019 in Wuhan, China. Clin Infect Dis 2020; published online March 16. DOI: 10.1093/cid/ciaa272 [DOI] [PMC free article] [PubMed] [Google Scholar]
- 95.Wang Y, Liu Y, Liu L, Wang X, Luo N, Ling L. Clinical outcome of 55 asymptomatic cases at the time of hospital admission infected with SARS-Coronavirus-2 in Shenzhen, China. J Infect Dis 2020; published online March 17. DOI: 10.1093/infdis/jiaa119 [DOI] [PMC free article] [PubMed] [Google Scholar]
- 96.Han R, Huang L, Jiang H, Dong J, Peng H, Zhang D. Early Clinical and CT Manifestations of Coronavirus Disease 2019 (COVID-19) Pneumonia. AJR Am J Roentgenol 2020; : 1–6. [DOI] [PubMed] [Google Scholar]
- 97.Qian G-Q, Yang N-B, Ding F, et al. Epidemiologic and Clinical Characteristics of 91 Hospitalized Patients with COVID-19 in Zhejiang, China: A retrospective, multi-centre case series. QJM 2020; published online March 17. DOI: 10.1093/qjmed/hcaa089 [DOI] [PMC free article] [PubMed] [Google Scholar]
- 98.Gao Y, Li T, Han M, et al. Diagnostic Utility of Clinical Laboratory Data Determinations for Patients with the Severe COVID-19. J Med Virol 2020; published online March 17. DOI: 10.1002/jmv.25770 [DOI] [PMC free article] [PubMed] [Google Scholar]