

Highlights
-
•
Genetic Evolutionary Programming (GEP) has been used to analyze and predict COVID-19 in 15 worst affected countries of the world.
-
•
Two Prediction models for confirmed cases and death cases for each countries are designed since 30 january 2020 to 29 May 2020.
-
•
The models presents prediction data for next 10 days till 8 June 2020.
-
•
Mathematical formulations for the prediction models have been added.
-
•
GEP models are highly reliable and provide better predictions.
Keywords: COVID-19, Coronavirus, SARS-CoV-2, Time series forecasting, Gene expression programming (GEP), Countries of the world
Abstract
COVID-19 or SARS-Cov-2, affecting 6 million people and more than 300,000 deaths, the global pandemic has engulfed more than 90% countries of the world. The virus started from a single organism and is escalating at a rate of 3% to 5% daily and seems to be a never ending process. Understanding the basic dynamics and presenting new predictions models for evaluating the potential effect of the virus is highly crucial. In present work, an evolutionary data analytics method called as Genetic programming (GP) is used to mathematically model the potential effect of coronavirus in 15 most affected countries of the world. Two datasets namely confirmed cases (CC) and death cases (DC) were taken into consideration to estimate, how transmission varied in these countries between January 2020 and May 2020. Further, a percentage rise in the number of daily cases is also shown till 8 June 2020 and it is expected that Brazil will have the maximum rise in CC and USA have the most DC. Also, prediction of number of new CC and DC cases for every one million people in each of these countries is presented. The proposed model predicted that the transmission of COVID-19 in China is declining since late March 2020; in Singapore, France, Italy, Germany and Spain the curve has stagnated; in case of Canada, South Africa, Iran and Turkey the number of cases are rising slowly; whereas for USA, UK, Brazil, Russia and Mexico the rate of increase is very high and control measures need to be taken to stop the chains of transmission. Apart from that, the proposed prediction models are simple mathematical equations and future predictions can be drawn from these general equations. From the experimental results and statistical validation, it can be said that the proposed models use simple linkage functions and provide highly reliable results for time series prediction of COVID-19 in these countries.
1. Introduction
It is horrifying time, with almost 6 million people affected and around 300,000 deaths, the Severe Acute Respiratory Syndrome coronavirus 2 (SARS-CoV-2) or simply the COVID-19 (coronavirus disease 2019), has emerged as a global pandemic and is escalating at a rapid pace. The virus supposed to be migrated from bats, started transmission in Wuhan, the capital of Hubei, China. As reported by the Chinese authorities, as of 8 December 2019, the virus migrated from bats to human being, from their diet and first death was reported by 9 January 2020 [1]. On the same day, it was declared by the world health organization (WHO) that a novel coronavirus has been identified and movements around the world were put under scanner [2]. The virus which started from a single organism, started transmission as a cluster level agent and with in a span of few days, started growing as a multi-lateral agent with community level transmission. Initially, the Chinese administration tried to contain the virus by imposing restrictions such as closure of airports, highways, state ways, local transport, railways and other services. They also imposed ban on public gathering, closed shops, mass events, games and all other activities where there were chances of any social contact or people to people interactions [3]. The Chinese authorities started collecting useful information and travel histories of all the people travelling from and to the various provinces across the country. They checked the infectious disease vulnerability index (IDVI) according to the user data records International Air Transport Association (IATA) to analyse and control the virus transmission outside China [4]. Here, it should be noted that IDVI has a range of [0, 1] and risk of vulnerability and transmission of disease increases if the value of IDVI is higher [4].
The Chinese authorities though tried to contain the virus and keep it under check but the major concern for the world came when a new case from Thailand was reported on 13 January 2020 [5]. This was the first case outside China and even with such strict actions by the Chinese authorities, cases were reported from Bangkok, Hong Kong, Taipei and Japan, all having an IDVI level greater than 0.65 [6]. Even with such rigorous efforts by all of these respective countries, the coronavirus could not be contained and numerous cases across the globe were reported by 19 January 2020 [5]. By 31 January, WHO declared an emergency situation and declared it as a new global pandemic on 11 March 2020 [3]. With a daily increase of around 26% to 30% in the confirmed cases, the European Union is most affected area of the world whereas the most affected country is United States of America (USA) [7]. As of 30 May 2020, the total number of CC/DC in the 15 worst affected countries in the American regions are USA having 1675258/98889 cases, Canada with 87902/6799 cases, Brazil amounts for 411821/25598 cases and Mexico with 78023/8597 cases. The European Union being the most affected area having 269131/37837 cases in the United Kingdom (UK), Russia with 269131/37837 cases Spain with 238278/29037 cases, Italy having 231/732 cases, Germany with a total of 180458/8450 cases, Turkey 160979/4461 cases and France having 146122/28608 cases. The region of the Middle-East is also affected with Iran being the worst affected area having 143849/7627 cases. In the African region, South Africa is the most affected country with 27403/577 cases. The Asian region having the two most populous countries of the world is not far behind with India being the most affected at 165799/4706 and second comes China having a total of 84547/4645 cases and the third most affected country is Singapore with 33249/23 cases. In present study, all the above discussed countries have been taken into consideration except India. As study related to India has already been reported in literature [8]. Here it should be noted that, at least one country has been taken from each continent, even if the number of cases is not big in that country such as South Africa has the lowest number of cases in the study and is the only country from continent Africa.
The potential effect of COVID-19 has prompted numerous studies and the whole research community has dived in to analyse the various characteristics of the virus and are burning the mid night oil to find a possible cure and derive new vaccine for the global greater good [9]. Some initial studies explained that the virus has a devastating effect on elderly people and others who already suffer from some respiratory disorders, heart related problems and other ailments [10], [11]. Therefore, it is still a major concern for the respective authorities to keep the virus under check and devise new efficient means so that minimum harm can be done. Thus, it becomes really very important to analyse the possible impact and the number of infections in the coming days to estimate the spread of the disease. To investigate such possibilities, various studies have been put forth and numerous individual based mobility models have been formulated and designed. Some of the recent studies on the possible impact of coronavirus include logarithmic distribution [12], stochastic simulations [13], exponential growth patterns [14], evolutionary approaches [8], [15], stochastic mathematical modelling [16], Weibull distribution based model [17] and others [18]. From these studies, it was analysed that the virus has an average incubation period of 5.1 days and the total quarantine to access the possible impact is 21 days [13]. Some predicted that the virus is growing at an exponential rate and other showed that this curve is more of a logarithmic form which later stagnates as a flat surface. Though these studies provided some of the initial background but none of these have any proficiency to define the exact pattern of the virus and how it will behave in the times to come. Also most of these studies focused mainly on China and not much work has been done to analyse the effect on the third world countries.
In present work, genetic programming (GP) [19] or more precisely gene expression programming (GEP) based model has been proposed to analyse and predict the possible impact of the novel coronavirus on fifteen most affected countries of the world. GP has been derived from genetic algorithm (GA) [20] and is a upper end version of the same. The only difference being the use of solution patterns. In GA, binary string based solution are obtained whereas in case of GP, computer generated programs are the end solutions [21]. Here, a more enhanced version of GP namely GEP has been used. The GEP programming models are highly efficient and have been used by numerous researchers to make prediction models, such as linear regression based models, time series models and others [22], [23], [24]. In present scenario, two different GEP based models for confirmed cases (CC) and death count (DC) have been designed for time series analysis and prediction of total number of affected people across fifteen major economies of the world. Note that the time series data for all of these cases has been taken from daily situation report by WHO [6], which has been pre-processed by the Mendeley dataset as reported in [25]. Apart from that, GEP based model has been used because of its capability to design simple yet efficient mathematical prediction equations which can be used and analysed at a later stage. Also, GEP based models have more efficient performance in comparison to other classical approaches and better than artificial neural networks. They are even better in comparison to deep learning based models under the minimal constraint that the data for modelling is limited. But where the data multiplies many fold, deep learning models have better performance. Further, it should be noted that GEP based models can be calibrated efficiently as they require lesser number of initial parameters and not much prior information is required to develop predictions, time series models or mathematical equations [26], [27].
The rest of the paper is outlined as, Section 2 provide details about the technical preliminaries about GP and model calibration with respect to GEP. In Section 3, the detailed results and discussion with respect to CC and DC for 15 countries in presented. Here it should be noted that the results are formulated on three criteria namely expression trees (ETs) based analysis, importance of prediction variables and statistical results. By statistical results, we mean that root mean squared error (RMSE) and correlation coefficient (R 2) is used to evaluate the performance of the proposed GEP models. In Section 4, detailed discussion about the proposed prediction models along with some future prospects of the proposed models has been presented. Finally in Section 5, presents the conclusion and future recommendations.
2. Technical preliminaries and model calibration
GP is a very effective evolutionary algorithm and has proved its significance when compared with the traditional GA. The algorithm because of its discrete nature and applicability to continuous optimization problems, has gained much interest from the research community. This is the main reason why it different from the traditional GA and hence can be applied to wider research domains rather than GA whose solutions are only binary strings. The GP algorithm also produces new mathematical equations and has the direct advantage of application to higher dimensional problems which otherwise is not possible for evaluation using a standard GA. GEP on a whole is an enhanced version of GP and has been found to eradicate the drawbacks of both traditional GA and basic GP algorithm. The GEP algorithm based modelling is also very effective and has been analysed for structural engineering design problems [26]. They also allows reliable prediction analysis under minimal constraints and even provide accurate results. Before designing new GEP models for present scenario, it becomes really important to investigate already proposed models and predict that those proposed models provide any significance or not.
In literature, there are numerous models which have been proposed to analyse the effect of coronavirus and provide reliable predictions. These models include neural network based models [28] for prediction analysis, Australian Census-based Epidemic Model (AceMod) [29] for influenza virus prediction, and others. The neural network based model used fuzzy logic along with long shallow term memory (LSTM) modelling [28] to predict the possible impact of COVID-19. Though various works have been done and numerous models have been designed but most of these models are either for modelling some other diseases and have little relevance to coronavirus. Even if some of the models do provide some prediction analysis, the statistical results are not that significant and hence making the models less reliable. Also, most of these models focused on country specific cases and little work has been done on a global scale. The present study, is the first of its kind with 15 major countries under consideration and at least one country from each continent. Thus overall analysing the effect of COVID-19 in every continent of the earth. Here it should be noted that GEP based models aim to provide more reliable results in comparison to most of models discussed in literature. Further, a model is said to be highly reliable if, the value of RMSE is higher and R 2 is close to 1. The models discussed above, are less reliable because of lower RMSE and R 2 values and also they require more set of data points to predict the output [26]. Apart from that, these models are very classical approaches and are found to be highly complex and challenging in comparison to the simple yet efficient GEP based modelling.
In present work, two major time series including CC and DC have been taken into consideration for 15 worst affected areas of the world. The time series data has been collected on a daily basis since 30 January 2020 and dataset regarding the same has been published in the Mendeley repository [25]. A detailed discussion on the GEP algorithms is presented in subsequent subsections.
2.1. Gene expression programming
GP is an extension of GA and is based on Darwinian theory of natural selection or simply the survival of the fittest. Here mathematical equations are formulated based on computer based programs and are created in such a way that a relationship between input and output variables can be found [26]. These equations though are simpler and can be formulated in the form of a tree based structure commonly called as ETs. These ETs are declared in the form of a functional programming language known as Karva language [19]. In GEP, these ETs are also known as para trees and uses fixed length character string instead of classical tree representation of GP. In this kind of setup, GEP consists of a hierarchy based structure consisting of terminals and functions [21]. The latst version of GEP was formulated by Ferreira et al. [22]. It consists of five major parts, including a function set, control parameters, fitness function, terminal condition and the terminal set. The major feature of this GEP is that it is relatively simple and works at the minimal chromosomal level. Another reason for better performance of GEP based modeling is that it has non linear and multi-genic nature and hence more complicated systems can be evolved in the form of several simpler sub-programs [27].
A simpler GEP model in the Karva language consist of fixed length symbols having a function set (e.g. ) and a terminal set (e.g. a, b, c, 3). The model thus derived is an organization of multiple chromosome, represented in the form of a simple parse tree [30]. The decoding of the same is presented in the Karva language as given by
| (1) |
where a, b and c are variables and 3 is a constant. These expressions are simply called as Karva notation or a k-expression and the model is further evolved in the form of an ET and is given by Fig. 1 . The expression in Eq. 1, is the root of an ET, which starts with a functional node and finally reaches a terminal node towards the end. Also it should be noted that ETs contain potential information about the basic psychology and architecture for certain aspects of the problem. The overall requirement of this kind of interpretation is that it helps in simpler and quicker understanding of highly complex mathematical formulations [31]. The k-expression thus formulated are presented as simplified mathematical equations and is given by
| (2) |
Fig. 1.

Representation of an ET.
Here it should be noted that the Karva notations from simple GEP models can help to estimate the total length of genes. Also in a GEP model, the total number of ETs keep on changing with respect to problem under consideration [22]. The above said modelling expressions further signifies that the proposed models have certain redundant elements which are not significant for genetic mapping and hence can be removed. Here it should be noted that the total length of a Karva notation or k-expression must be less than or equal to the total length of a GEP gene. Also it is a random head-tail methodology where head might have both function and terminal symbol but the tail consists of only the terminal symbol [22].
For each member of the population, a simple GEP algorithm begins with a uniform random initialization of its fixed length chromosomes from the whole set of the population. The next step is to evaluate chromosomes as ETs and find the best fit solutions or ETs based on the fitness of the previous solutions in order to reproduce new solutions with modifications. Note that a new solution with elitism is evaluated using Roulette wheel selection (RWS) and the evaluation process is followed unless and until the termination criteria is satisfied. Due to the presence of RWS, the algorithm is found to be very effective in cloning and optimizing the best individuals with respect to generations [26]. Thus overall, we can say that the final solution thus obtained is considered as the potential solution of the problem under consideration. The flow chart of a basic GEP model is presented in Fig. 2 .
Fig. 2.

Representation of a GEP algorithm.
2.2. Proposed GEP model
It has been found that a simple GEP model is highly reliable when the total number of cases for the occurrence of an event is limited in number. In the present scenario, that is in case of COVID-19, the data is just as old as 100 days and hence can be clearly interpreted with a simplified GEP model. Thus to have a better and clearer perspective on the total number of COVID-19 cases across the different countries of the world, two major parameters including CC and DC are taken into consideration. The recovered case data is another parameter which has surfaced in the recent days and this data is really very limited and also not available from reliable sources. So only CC and DC data has been taken in order to have a clear perspective on the extent of COVID-19 in the coming days. For performance evaluations, the best GEP model is selected from the pool of eight former records. The data set based on training is divided into two sub data sets and are subsequently used for training phase and testing/validation phase [26]. Here 70% of the data is used for training whereas 30% data is used for the testing/validation. Also, the training data uses gene evolution modeling and the best model thus formulated is predicted using the correlation coefficient. Apart from that multiple runs have been performed to reduce the possible error and predict the final near optimal solution. This is done because a simple numerical optimization algorithm cannot be judged by a single run and efficiency of the algorithm can be analysed only if the results obtained remains almost similar over subsequent runs. Overall, from the above discussion, it is evident that the new models have been proposed having better performance for training and can somehow work pretty well for testing/validation phase.
Also, it is a well known fact, that a GEP model is highly affected by the choice of training parameters. So in order to have a good enough model, multiple runs of the proposed models have been performed by changing the parametric settings. Though the new parametric setting is initialized over subsequent generations, an initial parametric detail has been added based on the previous models as given by [22]. Finally, along with the learning process, the overall fitness needs to be maximized and hence a new fitness function is derived as given by
| (3) |
where MSE is the mean squared error and the fitness function thus formulated in Eq. 3 is used for all the countries under investigation. Further, detailed discussion on the comparative study and validation of the proposed models is presented in the consecutive subsections.
3. Numerical results and comparative study
In this section, the detailed study on the various numerical results and the comparative study for 15 worst affected areas of the world is presented. The GEP based modelling for COVID-19 in those countries has been implemented using GeneXpro Tool [31] and the parameter settings is presented in Table 1 . The number of runs for the simulation were significant enough and performed until and unless no further improvement can be noticed in the GEP model. Here the general architecture of GEP model is evolved based on the total head size and the gene count [32]. For each chromosome in the model, the gene count determines the total number of terms in the GEP model and hence constitute a sub-ET. When the gene count becomes greater than 1, mathematical models are linked by using the linkage functions. The linkage functions are simple yet efficient and highly reliable GEP based models can be devised from them [33]. In present work, the total number of optimal head sizes and gene count is taken as 5 and 4 respectively. More detailed statistical parameters used for present scenario is presented in Table 2 .
Table 1.
Parameter Settings for GEP algorithm.
| Parameter | Settings |
|---|---|
| General | |
| Chromosome | 30 |
| Gene | 5 |
| DC size | 5 |
| Head size | 4 |
| Tail size | 5 |
| Gene size | 14 |
| Linking function | Addition/Minimum |
| Genetic operator | +, -, × , ÷, |
| Mutation rate | 0.00206 |
| Inversion rate | 0.00546 |
| IS and RIS transposition rate | 0.00546 |
| One-point and two-point recombination rate | 0.00277 |
| Gene recombination and transposition rate | 0.00277 |
| Numerical Constants | |
| Constant per gene | 10 |
| Data type | Floating-Point |
| Range | [-10, 10] |
Table 2.
Statistical Parameters of GEP model for external validation.
| Item | Formula | Condition | GEP CC | GEP DC |
|---|---|---|---|---|
| 1 | R | 0.8 < R | 0.9999 | 0.9997 |
| 2 | 0.85 < k < 1.15 | 0.9996 | 0.9994 | |
| 3 | 1.0000 | 0.9998 | ||
| 4 | |m| < 0.1 | -0.00036 | -0.00154 | |
| 5 | |n| < 0.1 | -0.00026 | -0.00155 | |
| 6 | 0.5 < Rm | 0.9837 | 0.9592 | |
| where | 1.0000 | 0.9999 | ||
| 1.0000 | 1.0000 |
The parameters discussed in Table 2 are basically the major parameters which help in external validation of any GEP model. In present work, the validation criteria stated in [34] has been utilized. The main characteristics of this criteria is that the area under the regression slope (k or ) must be close to 1 and in line with the origin. The value of other parameters m and n must be lower than 0.1 and external predictability Rm should be more than 0.5 [35]. Apart from that, the value of squared correlation coefficients and Ro 2 must be close to 1 and the value of Ro 2 and Ro 2 lies between the experimental and intended values [26]. Other major parameters are detailed in Table 2. Here it should be noted that the value of all of the above discussed plays a really very important role in estimating and ensuring good prediction probability of each model proposed. They are also important factors for analysing the strong testing and validation of the proposed models.
Further, in order to have a fair comparison for each of the countries under consideration, the proposed CC and DC GEP models are subjected to two major statistical testing approaches. These include RMSE and R 2, and are calculated as
| (4) |
| (5) |
where n is the total sample size, and for the ith output, hi and ti is the actual versus desired outputs, and is the actual versus intended output. Also, it has been found that R alone cannot be considered as the best evaluation criteria. This is because the value of R pose little variation while shifting the output of the prediction models and hence there is requirement of some other parameter for performance evaluation of the proposed models. In present scenario, RMSE or the error function has also been taken into consideration and meaningful results can be derived. This fact was further validated by Smith et al. [32], who coined that for a GEP model to be accurate and highly reliable, the correlation coefficient between the actual and the desired outputs must be highly strong and close to 1. They also coined that a higher value of RMSE is also desired for the model to be efficient. Thus overall, it can be said that any model having a strong correlation and larger RMSE values are capable of providing reliable and efficient time series predictions [36].
Apart from that, the prediction variables also play very significant role and are considered as integral parts of a GEP model [36]. These parameters helps in finding the contribution of each predictor variable in the model. All of these models follow a simple randomization phenomena in order to estimate the importance of each prediction variable. They also helps in finding the average reduction in the correlation between the experimental and desired output. And finally these results are normalized in such a way that the sum of all the variables amount to 1.
In the consecutive subsections, detailed study for COVID-19 in the 15 worst affected countries of the world is discussed. The results are presented in terms of ET based validation, variable importance and finally statistical tests using RMSE and R 2.
3.1. GEP Model for USA
With an area of 3.8 million square miles and a total population of 328 million people, USA is the third largest country in the world in terms of total area as well as population. The country though is the global superpower but also the most affected country with the COVID-19 pandemic. With a total of 1,675,258 CC as of 29 May 2020, the total number of death toll or DC has reached 98889, the highest burden any country in the world has suffered. So it becomes really important to analyse the effect and predict possible impact of the virus on USA in the coming days. The results of prediction model in terms of both CC and DC in USA is presented in Fig. 3 . It has been found that GEP model proposed in present work provide almost similar prediction results as that of original number of cases till 29 May 2020 and further predicts that a sharp rise in the cases is expected by 8 June 2020, with a total number of CC amounting to 1,890,781 and the death toll rising to 113158. The total number of projected CC to DC per day is presented in Fig. 4 . In the next subsection, the ET based validation of the above formulation is presented.
Fig. 3.

Experimental versus predicted cases for COVID-19 in USA using GEP model.
Fig. 4.

Prediction of new confirmed cases of COVID-19 per day in USA.
3.1.1. The expression tree based validation
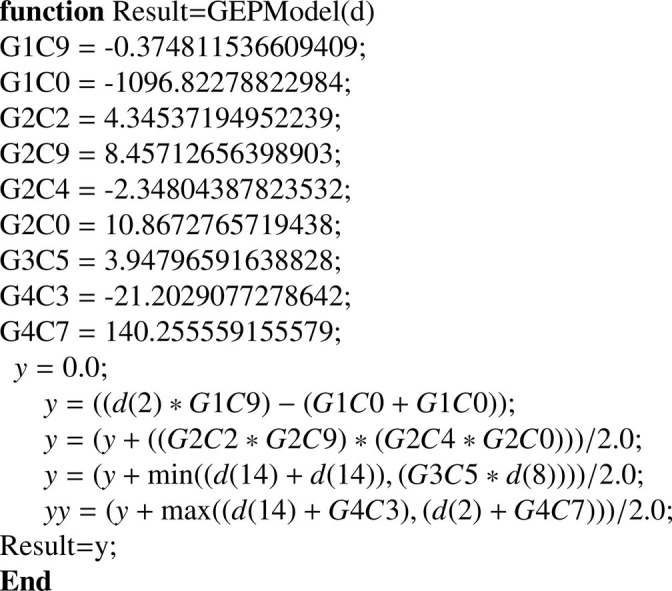
ETs for USA are given in Fig. 5 in terms of CC and DC. Based on these mathematical formulations can be represented as complex organization of operators, constants and variables and finally prediction analysis have been presented. From the Fig. 5, it can be seen that the proposed ET is divided into four sub-ETs and each of the subprogram represents some individual aspects of the problem under test. From these sub-ETs, meaningful information can be derived and desired solutions are obtained. Also these sub-ETs contain potential information about the architecture and psychology of the possible facets of the problem which ultimately pave way for chromosomal level evaluation. The sub-ETs in the Fig. 5 further shows that the linkage function for present case is minimum for CC and subtraction for DC. From these sub-ETs mathematical models can be derived and hence meaningful information can be extracted. The time series prediction model pseudo-codes for USA are given in Algorithm 1 for CC and Algorithm 2 for DC. Also the model used is generated using 114 training records for CC and 74 training records for DC.
Fig. 5.

Expression trees (ETs) for the modelling of COVID-19 in USA.
Algorithm 1.

Model for CC in USA.
Algorithm 2.

Model for DC in USA.
3.1.2. Variable importance
It has already been discussed above that the prediction variables are important parameters of a GEP model. From the results in Fig. 6 , it can be said that as of 29 May 2020, the most important parameter for both CC and DC is d13 Independently, CC is highly influenced by d12 and d13 where as DC has the most effect because of d13 only. It should be noted that the variables are normalized such that the sum of all these prediction variables amount to 1. The statistical results for USA are presented in subsequent subsections.
Fig. 6.

Contribution of predictor variables for COVID-19 in USA.
3.2. GEP Model for CANADA
Canada is the second largest country in the world with a total stretch of 9.98 million square kilometers and a population of only 37.6 millions. The country though is the second largest in the world but the impact of COVID-19 on its population is no less. The country is sparsely populated and still the impact of virus is on a wider scale. The total number of CC as of 29 May 2020 is 87,902 and the death toll has reached 6799 (exact figures). This section details about three aspects of analysis on coronavirus. These include prediction figures, expression trees and variable importance. In Fig. 7 , a representation of both CC and DC cases for both predicted and exact situation are presented. Here also the prediction model provide reliable results and it is expected that by 8 June 2020, the curve of rise in the total number of cases will amount to 95,223 CC with approximately 7803 deaths. Apart from that, the average rise in the number of CC and DC per days is presented in Fig. 8 .
Fig. 7.

Experimental versus predicted cases for COVID-19 in Canada using GEP model.
Fig. 8.

Prediction of new confirmed cases of COVID-19 per day in Canada.
3.2.1. The expression tree based validation
The ET for Canada shows the mathematical formulation of COVID-19 CC and DC across the whole country. From the ETs in the Fig. 9 , it can be seen that both CC and DC consists of four independent subprograms or sub-ETs. The linkage function for the CC is minimum where as for DC, subtraction linkage function has been used. The mathematical formulation of time series prediction model for both CC and DC in Canada is provided in Algorithm 3 and Algorithm 4 . These representations are quiet simple and predictions for future can be obtained from the same. The total number of training records for CC is 110 whereas in case of DC it is 66.
Fig. 9.

Expression trees (ETs) for the modelling of COVID-19 in Canada.
Algorithm 3.

Model for CC in Canada.
Algorithm 4.

Model for DC in Canada.
3.2.2. Variable importance
This parameter as already discussed in very important and follows a randomization procedure to analyze the importance of each variable for all the inputs. The results are calculated by finding the average reduction in the correlation between the desired output and the predicted outputs. The results in Fig. 10 , shows the importance of different prediction variables in case of Canada. It can be seen from the figures that for CC variable d0 and d13 provide significant importance where as for DC, d9, d10, d11, d12 and d13 are significant variables. Here it is to be noted that the total number of significant variables in CC is 7 and for DC is 8.
Fig. 10.

Contribution of predictor variables for COVID-19 in Canada.
3.3. GEP Model for GERMANY
Germany, a European country with a total population of 83 million living in a total space of 348,560 square kilometers, has more than 50% population above 45 years of age. As an already known fact that the coronavirus affects the people of elder age, it becomes really very important to analyse its effect in Germany. The country has been hit hard by the pandemic and till 29 May 2020, the total number of confirmed cases is 180,458 accounting for a total deaths of 8450 people. With an average increase of more than 1000 people daily, the virus seems to affect almost every other household in the country. A general predicted output versus the original cases for both CC and DC is presented in Fig. 11 . It can be seen that the curve is increasing exponentially and by 8 June 2020, the total number of CC and DC can increase by 182,857 and 8628 respectively. The predictions show that the cases will almost stagnate in the coming days and with intensive lockdown and proper social distancing, the country will be free of COVID-19 cases pretty soon. The total number of projected new cases for CC and DC per day is given by Fig. 12 .
Fig. 11.

Experimental versus predicted cases for COVID-19 in Germany using GEP model.
Fig. 12.

Prediction of new confirmed cases of COVID-19 per day in Germany.
3.3.1. The expression tree based validation
ETs in case of Germany are presented in Fig. 13 . It can be seen from the figures that the ETs for both CC and DC in Germany consists of four chromosomes or sub-ETs. These sub-ETs are connected by minimum linkage function for both CC and DC. Based on these ETs, mathematical formulations can be drawn and further evaluation at chromosomal level can be achieved as per the end users requirement. The general time series prediction for Germany in case of CC is given by Algorithm 5 and in case of DC is given by Algorithm 6 . Note that a total of 109 training sample for CC and 67 training records for DC have been used respectively.
Fig. 13.

Expression trees (ETs) for the modelling of COVID-19 in Germany.
Algorithm 5.

Model for CC in Germany.
Algorithm 6.

Model for DC in Germany.
3.3.2. Variable importance
This parameter is accountable for all the prediction variables in the proposed GEP model and helps in finding the exact variable which poses challenge and has significant effect on the performance of a GEP model. In case of Germany, the effect of prediction variables is presented in Fig. 14 . These variables show the present scenario and as of 29 May 2020, it can be seen that d11 and d13 variable has a significant effect on the COVID-19 CC and variable d5, d8 and d13 has the effect on DC in case of Germany. The total number of significant variables for CC is 7 and for DC is 6. Apart from these parameters, all other parameters pose little significance and hence providing a more reliable model with little effect of prediction variables.
Fig. 14.

Contribution of predictor variables for COVID-19 in Germany.
3.4. GEP Model for BRAZIL
Brazil, the fifth largest country in the world, has a total population of 209 million people living in an area of 8.51 million square kilometers. The country is the sixth most populous country in the world and third most affected nation in the region of Americas. With a total number of positive cases amounting to 411,821, the death count has reaction almost 26,000 people. The total population of Brazil has a distribution of 23% below 13 years of age, 69% between 15 to 61 and only 8% population is above 65 years of age. With such diversified variations, at least 8% of the countries population is expected to be highly affected by the COVID-19 pandemic. The total number of cases are rising exponentially with a total increase of more than 5000 to 8000 cases daily. Thus it becomes really very important to analyse the effect of coronavirus in Brazil. A detailed study of the proposed values for CC and DC for Brazil is given in Fig. 15 . Here the prediction and experimental figures show that the expected rise in the total number of COVID-19 by 8 June 2020 in Brazil in terms of CC and DC is 706,710 and 36,468 respectively. The study thus predicts that the cases will rise exponentially with in the coming days and is expected to make the situation more worse. More details about the daily rise in the cases can be seen from Fig. 16
Fig. 15.

Experimental versus predicted cases for COVID-19 in Brazil using GEP model.
Fig. 16.

Prediction of new confirmed cases of COVID-19 per day in Brazil.
3.4.1. The expression tree based validation
ETs for this study are presented in Fig. 17 for both CC and DC. These ETs can be used to derive new mathematical equations and new predictions can be formulated based on them. It can be seen that, each chromosome in the prediction ET, consists of four sub-ETs for CC and DC cases. Each of these sub-ETs represented different aspects of the COVID-19 cases in Brazil and paves way for chromosomal level evaluation. Apart from these studies, it can be seen that the linkage function used in case of CC is minimum and for DC, multiplication linkage function is used. Both these linkage functions acts as the building blocks of the basic GEP models and more precise mathematical equations can be formulated based on them. The time series model for Brazil in case of CC is given by Algorithm 7 and for DC is given in Algorithm 8 . Here it is to be kept in mind that the total number of training records for CC is 79 and 58 no. of indices are used for DC.
Fig. 17.

Expression trees (ETs) for the modelling of COVID-19 in Brazil.
Algorithm 7.

Model for CC in Brazil.
Algorithm 8.

Model for DC in Brazil.
3.4.2. Variable importance
In order to analyse the importance of prediction variables in Brazil, a randomization phenomena is followed by finding the average reduction in R 2 between the desired and predicted values. The normalized results for prediction variables are presented in Fig. 18 . It can be seen from the results that as of 29 May 2020, the total number of confirmed cases in Brazil is highly effected by d12 and d13 variable for CC and only d13 variable for DC. Here the total number of significant variables for both CC and DC is only 4. All other variable either pose little or no significance on the performance of the proposed GEP models.
Fig. 18.

Contribution of predictor variables for COVID-19 in Brazil.
3.5. GEP Model for MEXICO
Mexico is the tenth most populous country of the world with a population of around 125 million people. The population is highly diverse and more than 6% of the people are above 65 years of age. As the COVID-19 is highly vulnerable to people of higher age, a risk to this 6% population seems really challenging. Despite of the fact, that the two immediate neighbours USA and Brazil are among the top two most affected nations, Mexico has only 78,023 total number of positive cases and a DC of 8597 as of 29 May 2020. From the GEP model analysis, it is expected that by 8 June 2020, the total number of CC will reach 118,845 cases and death county will be almost 13,231 cases. The expected total daily rise in CC and DC is given in Fig. 20.
Fig. 20.

Prediction of new confirmed cases of COVID-19 per day in Mexico.
3.5.1. The expression tree based validation
The ETs used for present case are similar to the ones used for other cases. A detailed overview of the ETs is presented in Fig. 19 . From the above figures, it can be seen that the proposed ETs is divided into four sub-ETs. These sub-ETs provide relevant information about the basic psychology and architecture of the problem under consideration. From the figures, it can be seen that the linking function used for both CC and DC is minimum linkage function. The time series pseudo-codes for the proposed models of Mexico are presented in Algorithm 9 for CC and Algorithm 10 for DC. Here it should be noted that the total number of training samples for CC is 109 and for DC it is 67 and accurate reliable model has been designed based on this training data.
Fig. 21.

Expression trees (ETs) for the modelling of COVID-19 in Mexico.
Fig. 19.

Experimental versus predicted cases for COVID-19 in Mexico using GEP model.
Algorithm 9.

Model for CC in Mexico.
Algorithm 10.

Model for DC in Mexico.
3.5.2. Variable importance
This parameter is really very important and decides the major factors which are responsible for the better predictability of the model. The results are calculated as an average reduction in R 2 values between predicted and desired output in order to find the importance of each variable. In case of Mexico, the results for variable importance are provided in Fig. 22 and it can be seen that d13 variable plays major role in cases of CC where as in case of DC, d8 and d13 variable provide relevant information. Here the total number of variables affecting the performance of both the GEP models is 5. All other variable in the figure either pose little significance or have no effect overall.
Fig. 22.

Contribution of predictor variables for COVID-19 in Mexico.
3.6. GEP Model for UK
United Kingdom or UK or the Great Britain is the most prominent country of Europe, having a total area of 242,495 square kilometers and a population of 66.6 million people. The country is hit very hard by the COVID-19 pandemic because of the problem of majority older population. It has already adversely affected the population and reached a total number of 269,721 positive cases and a DC of 37,739 as of 29 May 2020. Also from the GEP model analysis, it is expected that by 8 June 2020, the total number of CC will reach 307,189 cases and death county will be almost 39,819 cases. This effect can be seen in Fig. 23
Fig. 23.

Experimental versus predicted cases for COVID-19 in UK using GEP model.
3.6.1. The expression tree based validation
ETs in case of UK are given by Fig. 25 for both CC and DC. Based on these ETs, mathematical equations can be formulated and new prediction models can analysed. From the figures, it can be seen that the sub-ETs in case of UK are divided into four sub-ETs where each sub-ET corresponds individual aspect of the COVID-19 in UK. From the ETs, it can be seen that the linkage function for CC is division linkage function and for DC is minimum linkage function. This information is necessary for chromosomal level evaluation and mathematical equation can be derived. The time series pseudo-codes for both the CC and DC in UK is presented in Algorithm 11 and Algorithm 12 . These models are generated based on 105 training records for CC and 70 training records for DC. The daily forecast of expected rise in the number of cases is given by Fig. 24 .
Fig. 25.

Expression trees (ETs) for the modelling of COVID-19 in UK.
Algorithm 11.

Model for CC in UK.
Algorithm 12.

Model for DC in UK.
Fig. 24.

Prediction of new confirmed cases of COVID-19 per day in United Kingdom.
3.6.2. Variable importance
The prediction variable parameter depends on the normalized average reduction in R 2 between predicted and desired output values. From the results in Fig. 26 , it can be seen that for UK, as of 13 May 2020, CC is highly affected by d13 variable whereas for DC also, the variable d13 provide significant involvement. The total number of variable that affect the performance of the proposed model for CC is 6 and for DC is 5. Apart from these variables, no other variable has any significant importance on the performance of the proposed GEP models.
Fig. 26.

Contribution of predictor variables for COVID-19 in UK.
3.7. GEP Model for RUSSIA
Russia, the largest country of the world has a total population rank of 9th in the world. The country has a median population of about 40 years of age and hence more than 30% of countries population is above 65 years of age. Overall, it means that this percentage of population highly susceptible to COVID-19 disease and hence greater care needs to be taken to keep the population under check. Till date, Russia has 269,721 total number of CC and a DC of 37,739 as of 29 May 2020 and it is expected that by 8 June 2020, the total number of CC will reach 307,189 cases and death county will be almost 39,819 cases. This can be better interpreted from the Fig. 27 . Thus overall, we can say that the total number of cases in Russia are rising at a rapid speed and greater care needs to be taken to keep the virus under check. The expected rise in the daily caces of CC and DC in the coming days is given in Fig. 28 .
Fig. 27.

Experimental versus predicted cases for COVID-19 in Russia using GEP model.
Fig. 28.

Prediction of new confirmed cases of COVID-19 per day in Russia.
3.7.1. The expression tree based validation
The ETs for Russia are given in Fig. 29 for both CC and DC. It can be seen from the ETs that for both CC and DC cases, the ETs are divided into four simple sub-ETs and linked by more simpler linking functions. All of these sub-ETs for both CC and DC, addition linkage function is used. The pseudo-codes for time series prediction models in case of UK are given by Algorithm 13 for CC and Algorithm 14 for DC. The total number of training samples are 105 and 51 for both CC and DC respectively.
Fig. 29.

Expression trees (ETs) for the modelling of COVID-19 in Russia.
Algorithm 13.

Model for CC in Russia.
Algorithm 14.

Model for DC in Russia.
3.7.2. Variable importance
This section provides details about the various prediction variables responsible for affecting the performance of CC and DC in Russia. A detailed study about the prediction variables is presented in Fig. 30 . From the results in the figure, it can be said that the generalized time series prediction models for CC and DC have dependence on D13 and d7, d13 variables respectively. Apart from that DC also has some effect of d4 variable. Here it should be noted that results are presented such that the addition of all these variables make the count equal to 1. Also the total number of significant variables for CC is 6 and for DC is 5 respectively.
Fig. 30.

Contribution of predictor variables for COVID-19 in Russia.
3.8. GEP Model for SPAIN
Spain comes under European Union which is highly affected by the COVID-19 pandemic and was among the top during initial days. The total number of positive cases have reached 238,278 CC and a DC of 29,037 as of 29 May 2020. The GEP based modelling results of the experimental versus predicted results are presented in Fig. 31 and it is expected that by 8 June 2020, the total number of CC will reach 241,275 cases and death county will be approximately 30,267 cases. The detailed daily expected rise of CC and DC in the coming days is given by Fig. 32 . The next subsections details about the expression tree based validation.
Fig. 31.

Experimental versus predicted cases for COVID-19 in Spain using GEP model.
Fig. 32.

Prediction of new confirmed cases of COVID-19 per day in Spain.
3.8.1. The expression tree based validation
From the ETs in Fig. 33 , it can be seen that for both CC and DC, each of the ETs is divided into four sub-ETs. Each of the sub-ET constitute some of the psychological and well as architectural properties of a particular facet of the problem under test. From the figures, it can be seen that the linking function used for both CC and DC is maximum linkage function. The time series pseudo-codes for the proposed models of Mexico are presented in Algorithm 15 for CC and Algorithm 16 for DC. Here it should be noted that the total number of training samples for CC is 105 and for DC it is 72 and accurate reliable model has been designed based on this training data.
Fig. 33.

Expression trees (ETs) for the modelling of COVID-19 in Spain.
Algorithm 15.

Model for CC in Spain.
Algorithm 16.

Model for DC in Spain.
3.8.2. Variable importance
The results for both the cases of CC and DC for Spain are presented in terms of R 2 values between predicted and desired output and are important in order to find the significance of each prediction variable. In case of Spain, the results for variable importance are provided in Fig. 34 and from the figures, it can be seen that d13 variable plays major role in cases of CC where as in case of DC, d10, d12 and d13 variable provide relevant information. Also it should be noted that the total number of variables for CC is 7 and for DC is 5. All other variable in the figure either pose little significance or have no overall effect.
Fig. 34.

Contribution of predictor variables for COVID-19 in Spain.
3.9. GEP Model for ITALY
Italy comes under European Union and was the worst affected country because of COVID-19 during the initial days. The country has one among the best health care system of the world but still the hype of the pandemic could not stop the ever growing corona cases across the country. By 29 May 2020, the total number of CC cases were around 231,732 and a DC of 33142. From the GEP model analysis as presented in Fig. 35 , it is expected that by 8 June 2020, the total number of CC will reach 234,199 cases and death county will be almost 35,022 cases. The overal daily rise in the cases CC and DC is given by Fig. 36 The ETs for the proposed GEP models are presented in the next subsection.
Fig. 35.

Experimental versus predicted cases for COVID-19 in Italy using GEP model.
Fig. 36.

Prediction of new confirmed cases of COVID-19 per day in Italy.
3.9.1. The expression tree based validation
As already discussed, ETs help in mathematical formulation and help in defining the basic psychology and architecture of GEP models, it becomes very imperative to present detailed ETs for Italy also. The detailed study on ETs is presented in Fig. 37 . From the figures, it can be seen that for both CC and DC, the results are divided into four sub-ETs. Each of these sub ETs correspond to the basic details of the numerical equations of COVID-19 in Italy. These sub-ETs for CC and DC both are linked by using subtraction linkage function. The pseudo-codes for time series prediction models in case of Italy are given by Algorithm 17 for CC and Algorithm 18 for DC. The total number of training samples are 107 and 83 for both CC and DC respectively.
Fig. 37.

Expression trees (ETs) for the modelling of COVID-19 in Italy.
Algorithm 17.

PModel for CC in Italy.
Algorithm 18.

Model for DC in Italy.
3.9.2. Variable importance
The results for variable importance in case of Italy are presented as an average reduction in R 2 values between predicted and desired output in order to find the importance of each variable. The variable importance is calculated for both CC and DC and are presented in Fig. 38 . It can be seen that d13 variable plays major role in cases of CC where as in case of DC, d12 and d13 variable provide relevant information. All other variable in the figure either pose little significance or have no effect. In the next subsection, prediction analysis for France is presented.
Fig. 38.

Contribution of predictor variables for COVID-19 in Italy.
3.10. GEP Model for FRANCE
France is another European country which has been hit hard by the COVID-19 pandemic. With 146,122 total number of positive cases and a DC of 28,608 as of 29 May 2020, the country is already suffering a lot. Though it grew at an exponential rate during the initial days but proper lockdown and social distancing was followed and the virus was controlled with a pretty stagnant growth rate in the past few days. The GEP model analysis for both CC and DC in terms of predicted and actual cases is presented in Fig. 39 . From the GEP model analysis, it is expected that by 8 June 2020, the total number of CC will decrease to 145,036 cases and death county will be almost 29,144 cases.
Fig. 40.

Prediction of new confirmed cases of COVID-19 per day in France.
Fig. 39.

Experimental versus predicted cases for COVID-19 in France using GEP model.
3.10.1. The expression tree based validation
The ETs for France are presented in Fig. 41 for both CC and DC. Each of the ET for CC or DC is divided into four sub-ETs. In case of CC, the maximum linkage function is used whereas for DC, subtraction linkage function is used. The ETs thus formulated are very simple and use basic mathematical operations for representation. Apart from that, the time series model for France in case of CC is given by Algorithm 19 and for DC is given in Algorithm 20 . Here it is to be kept in mind that the total number of training records for CC is 112 and 90 no. of indices are used for DC.
Fig. 41.

Expression trees (ETs) for the modelling of COVID-19 in France.
Algorithm 19.

Model for CC in France.
Algorithm 20.

Model for DC in France.
3.10.2. Variable importance
The statistical results of various significant variables in case of France is presented in Fig. 42 . From the figures, it is evident that in case of CC, out of seven significant variables, three variable pose really very significant advantage. These include d11, d12 and d13 and d13 being the most significant variable. For DC, only d8 and d13 pose significant importance from overall eight variables. Thus for both CC and DC, the variable d13 can be considered as the most important variable. In the next subsection, GEP modelling for Turkey is presented.
Fig. 42.

Contribution of predictor variables for COVID-19 in France.
3.11. GEP Model for TURKEY
Turkey is a transcontinental country with a total population of 84 million and ranks 17th in terms of overall world population ranking. Of this total population, about 10 million population is above 60 years of age. It is also a well known fact the coronavirus is found to affect elderly population. Thus a large chunk of population can be affected by the COVID-19 disease and thus adding on to the burden of authorities. In present study, this is the only country from Middle-East which has been taken into consideration. A comparison of actual versus predicted cases in terms of CC and DC is given by Fig. 43 . From the figures, it can be seen that as of 29 May 2020, the total number of positive CC in Turkey is 160,979 whereas DC is 4461 Further it is expected that by 8 June 2020, the total rise will be 171,502 in CC and for DC, the total count will be 4647 approximately. The total expected rise in the daily cases across Turkey is given by Fig. 44 .
Fig. 43.

Experimental versus predicted cases for COVID-19 in Turkey using GEP model.
Fig. 44.

Prediction of new confirmed cases of COVID-19 per day in Russia.
3.11.1. The expression tree based validation
The ETs in case of Turkey for both CC and DC are given in Fig. 45 . Based on these, mathematical equations can be derived and further predictions can be performed. Each ETs consist of four sub-ETs for both CC and DC cases and each ET represents individual aspect of the COVID-19 cases and future modelling can be done using these facets of the problem. The linkage function used for CC is addition whereas for DC, average linkage function is used. These linkage functions further prove that prediction models for CC and DC follow simple mathematical operations rather than some complex laboratory based formulations. The time series pseudo-codes for both CC and DC are given by Algorithm 21 and Algorithm 22 respectively. Apart from that, a common point which is to be kept in mind is that the model has been generated using 65 training records for CC and 58 training instances for DC.
Fig. 45.

Expression trees (ETs) for the modelling of COVID-19 in Turkey.
Algorithm 21.

Model for CC in Turkey.
Algorithm 22.

Model for DC in Turkey.
3.11.2. Variable importance
The variable importance for all the prediction variables of GEP model in case of CC and DC for Turkey are presented in Fig. 46 . The results are presented as the average reduction in R 2 between the desired and predicted output values. Here the total number of prediction variables is 5 for both CC and DC. It can be seen from the figure, that for CC d13 prediction variable pose significant importance whereas for DC d12 and d13 are the most important variables.
Fig. 46.

Contribution of predictor variables for COVID-19 in Turkey.
3.12. GEP Model for IRAN
Iran is an Asian country with a population of 8.3 million and almost 60% of the population lies in the age group of 30 to 64 years of age. A total of 10% population is above 65 years of age and is on a rise from the past few years. As the birth rate in Iran has dropped significantly over the recent years, it becomes really important for the authorities to keep a check on the population and also take care of health prospects for elderly people. With the advent of novel coronavirus, it is really a matter of concern for the authorities to keep the countries elder population safe. The virus is spreading at a rapid rate and by 29 May 2020, 143849 no. of CC and 7627 no. of DC were reported by the Iranian authorities. From the GEP models in Fig. 47 , it is expected that by 8 June 2020, the total number of CC will be 160,125 and DC will be 8192 respectively. Apart from this, the expected rise in the total number of cases per day in Iran is given by Fig. 48 .
Fig. 47.

Experimental versus predicted cases for COVID-19 in Iran using GEP model.
Fig. 48.

Prediction of new confirmed cases of COVID-19 per day in Iran.
3.12.1. The expression tree based validation
The ETs for the proposed GEP models is presented in Fig. 49 for both CC and DC. From the figures, it is evident that the proposed ETs are consecutively divided into four sub-ETs and each sub-ET corresponds to the basic psychology and architecture of the COVID-19 pandemic in Iran. The information thus gained can be used for chromosomal level evaluation. From, the sub-ETs, it can be seen that the linkage function for CC is maximum linkage function and for DC, minimum linkage function is used. Based on these linkage functions, it can be said that the numerical formulations are simple mathematical equation rather than complex laboratory experiments and hence meaningful information can be derived. The time series pseudo-codes for the COVID-19 modelling in CC is given by Algorithm 23 and Algorithm 24 for DC. The models for Iran are generated based on 87 training records for CC and 86 training records for DC.
Fig. 49.

Expression trees (ETs) for the modelling of COVID-19 in Iran.
Algorithm 23.

Model for CC in Iran.
Algorithm 24.

Model for DC in Iran.
3.12.2. Variable importance
The prediction variables for Iran is given by Fig. 50 . From the prediction variable results, it can be seen that for CC, the d13 variable plays a significant role where as for DC, d9 is the most important parameter. Apart from these parameters, for DC d11, d12 and d13 also plays significant role in analysing the performance of the COVID-19 in Iran. Here it should be noted tha the total number of prediction variables for CC is .... and for DC is .... The final results are calculated as average reduction in R 2 between the experimental and actual results.
Fig. 50.

Contribution of predictor variables for COVID-19 in Iran.
3.13. GEP Model for CHINA
China, the country where the pandemic started, has the worst effect during the initial days. The country though had the most number of cases by January itself, has recovered at a rapid pace. As of 29 May 2020, the total number of CC in China were 84,547 and a total death count of 4645 cases. The curve is almost stagnate from the past 15–20 days and it is expected to decline with in coming days. From the experimental results presented in Fig. 51 , it can bee seen that by 8 June 2020, the total number of CC will reduce to 83,477 and DC will be around 4663.
Fig. 51.

Experimental versus predicted cases for COVID-19 in China using GEP model.
3.13.1. The expression tree based validation
The ETs based validation for China is presented in Fig. 52 for both CC and DC. It can be seen from the figures that each ET for both CC and DC is divided into four sub-ETs or subprograms. These subprograms are simple mathematical formulation and meaningful information about the basic architecture and psychology of COVID-19 in China, can be derived. Also, the linkage function used for CC is division and for DC subtraction linkage function is used. The pseudo-codes for time series modelling using GEP is presented in Algorithm 25 for CC and Algorithm 26 for DC. Note that the total number of training records for GEP model analysis for CC and DC is 115.
Fig. 53.

Contribution of predictor variables for COVID-19 in China.
Fig. 52.

Expression trees (ETs) for the modelling of COVID-19 in China.
Algorithm 25.

Model for CC in China.
Algorithm 26.
Model for DC in China.
3.13.2. Variable importance
The total number of prediction variables for CC and DC is three. These variables helps in understanding the average reduction in R 2 between the actual and predicted values. In case of China, the important predictor variables for CC and DC is d13. Apart from that it can also be seen that for CC, the model is highly sensitive to d5 and for DC d1 and d7 plays significant role. In the next subsection, GEP model for South Africa is presented.
3.14. GEP Model for SOUTH AFRICA
South Africa is the most affected region of the African continent. The country with a population of around 6 million, has a total of 6% population above 65 years of age. In presented work, the GEP model for CC and DC for South Africa is presented in Fig. 54 . As of 29 May 2020, it can be seen that South Africa has a total of 27,403 CC and 577 DC. From the prediction results presented in Fig. 54, it can be seen that the CC will be 45,864 and DC will be 1160. The expected rise in daily cases in the coming days is South Africa is given by Fig. 55 . The experimental results are further divided into ETs based validation and importance of each prediction variable is presented in the consecutive subsections.
Fig. 54.

Experimental versus predicted cases for COVID-19 in South Africa using GEP model.
Fig. 55.

Prediction of new confirmed cases of COVID-19 per day in South Africa.
3.14.1. The expression tree based validation
The ETs for South Africa are presented in Fig. 56 for both CC and DC. From the ETs, it can be seen that each ET is divided into four sub-ETs or subprograms. The ETs are connected by simple mathematical linkage functions for extracting meaningful information from the GEP models. From the figures, it can be seen that the linkage function for CC is average function whereas for DC, subtraction linkage function has been used. From these sub-ETs, further predictions can be derived. The pseudo-codes for time series prediction for South Africa are presented in Algorithm 27 and Algorithm 28 . Here the major point which is to be kept in mind is that the models are generated based on 71 training records for CC where as for DC 49 training records have been used.
Fig. 56.

Expression trees (ETs) for the modelling of COVID-19 in South Aftrica.
Algorithm 27.

Model for CC in South Africa.
Algorithm 28.

Model for DC in South Africa.
3.14.2. Variable importance
In Case of South Africa also, the prediction variables play a significant role. It can be seen from the results in Fig. 57 , that the total number of prediction variables for CC is 5 and for DC is 6 Based on these prediction variables, it can be said that CC is highly affected by d6, d10 and d13 variable and DC is affected by d3 and d13 variables. Note that the results obtained for all of these prediction variables are normalized in such a way that their addition amounts to 1. In the next subsection, a detailed study about the GEP model for COVID-19 in Singapore is presented.
Fig. 57.

Contribution of predictor variables for COVID-19 in South Africa.
3.15. GEP Model for SINGAPORE
Singapore is an island state in maritime Southeast Asia. With merely 5.7 million population, the country’s elderly population is continuously growing at a rapid rate. At present, almost 13% of the population is above 65 years of age and it is expected that by 2050, more than 50% of the population will be above par age. The country has a significant effect on the global market and is the most pro-business country having the third highest per-capita gross domestic product (GDP) in the world. As of 29 May 2020, the total number of cases in Singapore were 33,249 with a total DC around 23. In present work, GEP model for both CC and DC in Singapore have been proposed. From the experimental results in Fig. 58 , it can be seen that by 8 June 2020, it is expected that the total number of CC will rise to 34,218 and DC will be almost the same.
Fig. 58.

Experimental versus predicted cases for COVID-19 in Singapore using GEP model.
3.15.1. The expression tree based validation
The ETs for Singapore are presented in Fig. 59 for both CC and DC cases. It can be seen from the figures, that the GEP models are represented as four sub-ETs or subprograms. These sub-ETs constitute basic architecture of COVID-19 in Singapore and useful information can be derived from the results in order to analyse the effect of coronavirus. From the sub-ETs, it is highlighted that each mathematical equation can derived using simple formulations for further predictions. The linkage functions for CC is minimum where as for DC subtraction linkage function is used. Here the model is generated based on 113 training records for CC and total number of training records for DC is 55. The pseudo-codes for time series analysis of COVID-19 pandemic in Singapore is presented in Algorithm 29 and Algorithm 30 for CC and DC respectively.
Fig. 59.

Expression trees (ETs) for the modelling of COVID-19 in Singapore.
Algorithm 29.

Model for CC in Singapore.
Algorithm 30.

Model for DC in Singapore.
3.15.2. Variable importance
The important variables in case of CC and DC for Singapore are highlighted in this section. The total number of variables affecting CC are 6 where as the number is 7 for DC. From the results in Fig. 60 , it can be said that for CC d13 prediction variable plays significant role whereas for DC d1, d9, d11 and d13 variable is the most important variable. Note that the results in this case are normalized in such a way that the R 2 values between the predicted and the actual cases, amounts to 1. The next subsection details about the statistical results for all the countries under consideration.
Fig. 60.

Contribution of predictor variables for COVID-19 in Singapore.
3.16. Statistical results for all the cases
The models proposed and calibrated in all the above sections for all the countries are only acceptable if they pose some significant results. This study is the only study which is conducted for 15 worst infected countries of the world and comparative analysis with respect to other techniques is still not available. Here, statistical results in terms of RMSE and R 2 for all the countries under consideration is presented in Table 3 . From the results in table, it can be seen that, the R 2 values for almost every case is very close to 1 where the worst value for CC corresponds to 0.9962 (China) and for DC is 0.9896 (China) whereas the best value for CC is 0.9999 (for USA, Mexico, Canada, Turkey, UK, Russia, Italy, Iran and Singapore) and DC is 0.9999 (for Turkey and Iran). Overall, it can be seen that the fluctuations for R 2 values in all the countries under study is very little and the value almost lies very close to 1. From this, it can be said that the proposed GEP models are highly effective and reliable predictions can be derived from these models in the near future. Apart from that higher Fitness values further acknowledge the results. The models thus proposed can be optimized using evolutionary algorithms such as krill herd algorithms [37], naked mole-rat algorithm [38] and others.
Table 3.
Overall Performance of GEP model for CC and DC across 15 Worst Affected countries of the World.
| USA |
Canada |
Mexico |
Brazil |
Germany |
||||||
|---|---|---|---|---|---|---|---|---|---|---|
| CC | DC | CC | DC | CC | DC | CC | DC | CC | DC | |
| Fitness | 0.2099 | 1.9762 | 3.3134 | 11.0918 | 6.3348 | 24.8720 | 0.7498 | 11.6764 | 1.2019 | 23.7021 |
| R2 | 0.9999 | 0.9997 | 0.9999 | 0.9985 | 0.9999 | 0.9997 | 0.9998 | 0.9998 | 0.9998 | 0.9997 |
| UK | Russia | Spain | Italy | France | ||||||
| Fitness | 1.3441 | 2.1765 | 0.8895 | 48.5694 | 0.6058 | 4.1590 | 3.2985 | 3.9966 | 1.2110 | 5.1088 |
| R2 | 0.9999 | 0.9988 | 0.9999 | 0.9997 | 0.9997 | 0.9993 | 0.9999 | 0.9995 | 0.9998 | 0.9997 |
| Turkey | Iran | China | South Africa | Singapore | ||||||
| Fitness | 2.8827 | 169.8035 | 3.3181 | 44.8425 | 1.2538 | 8.4510 | 9.1116 | 165.0713 | 10.6079 | 741.1593 |
| R2 | 0.9999 | 0.9999 | 0.9999 | 0.9999 | 0.9962 | 0.9896 | 0.9997 | 0.9988 | 0.9999 | 0.9965 |
3.17. Prediction for percentage increase in new cases
This section deals with the prediction estimates of daily rise in the number of cases. Percentage change of three scenarios including, i) ; ii) and iii) has been taken into consideration. Here tpop denotes the total population of that particular country, DCr denotes the number of predicted deaths per day and CCr corresponds to the total number of newly predicted cases per day. The results are extensively provided in Fig. 61 and Fig. 62 , whereas more precise details have been added in Table 4 . From the experimental results in Fig. 61, it can be seen that the maximum percentage rise in the number of CC to the total population is expected in Brazil where as minimum is expected in case of France. In case of maximum percentage rise in the death cases to the total population can be seen in case of USA whereas minimum for the same scenario is noticed in Singapore. Apart from that percentage of total daily rise in death cases to the confirmed new cases is presented in Fig. 62. From the figures, it can be said that Italy has the maximum expected number of daily deaths and Singapore has the minimum with respect to the total number of new confirmed cases for each of these countries. The results are further statistically shown in Table 4. If we break down the prediction for each of these countries in terms of total infections, our model estimates that out of every one million people, a daily rise of 4 new CC and 2 DC are expected in Italy, for Spain it is expected to be 6 CC and 2 DC, for France it is approximately 3 CC and 1 DC; for Canada it is 19 CC and 2 DC, Mexico has a total of 31 CC to 2 DC, for Germany it is expected to be 3 CC and negative DC, USA accounts for around 63 CC and 41 DC, UK has an expected rise of 55 CC and 3 DC, in Russia 47 CC and 1 DC is expected, Brazil has the maximum expected rise in the number of cases by 138 CC and approximately 5 DC, Iran has expected daily rise of 19 CC and negative DC growth, South Africa has expected rise of 31 CC to 1 DC, Turkey may experience around 12 new CC and a negative growth in the total DC and for Singapore it is around 11 new CC and approximately 1 DC. Apart from that, the daily rise in the percentage of DC to CC is maximum for Italy and the value is around 72.06%, Spain has 46.1%, France has a total of 26.17%, Canada lies at the fourth place with a percentage of 14.36%, Mexico has 11.3%, Germany has 8.48%, USA which has the highest number of confirmed cases till date has somehow managed to keep the percentage at 6.47%, UK has 5.42%, Russia, Brazil, Iran and South Africa lies close to 3.5%, Turkey has 1.58% and the minimum is noticed in case of Singapore which lies at 0.073. Note that these values are projected by the proposed GEP models and fluctuations can be noticed if the new data is readily available.
Fig. 61.

Daily Rise in the number of confirmed and Death cases to the total population of the country.
Fig. 62.

Daily Rise in Death count to Daily Rise in Confirmed cases for each Country.
Table 4.
Daily percentage prediction of new cases across various countries.
| Percentage of |
|||
|---|---|---|---|
| Italy | 0.00040 | 0.00029 | 72.06 |
| Spain | 0.00068 | 0.00031 | 46.10 |
| France | 0.00029 | 7.60E-05 | 26.17 |
| Canada | 0.0019 | 0.0002 | 14.36 |
| Mexico | 0.0031 | 0.00036 | 11.30 |
| Germany | 0.00032 | 2.70E-05 | 8.48 |
| USA | 0.0063 | 0.0041 | 6.47 |
| UK | 0.0055 | 0.0003 | 5.42 |
| Russia | 0.0047 | 1.80E-05 | 3.89 |
| Brazil | 0.0132 | 0.0005 | 3.73 |
| Iran | 0.0047 | 0.00018 | 3.45 |
| South Africa | 0.0031 | 0.0001 | 3.16 |
| Turkey | 0.0012 | 2.20E-05 | 1.58 |
| Singapore | 0.0011 | 8.50E-07 | 0.073 |
4. Discussion
Combining the GEP models for multiple datasets of various countries, we found that COVID-19 is transmitting for different countries at variable pace. With some countries like China is expecting to reduce the number of cases to bare minimum, number of cases in Brazil and USA is escalating at a rapid rate. The basic projections of daily rise in the CC and DC from the GEP model shows that the rise varies for each of these countries. The maximum rise is in case of Brazil, where it is expected that around 28,822 new daily cases and the highest number of 1358 deaths are projected per day in USA. The lowest number of cases is expected in China where the a negative growth is noticed for the confirmed cases, but for the death cases, Singapore seems to have the lowest number of daily rise in the cases. As of 29 May 2020, the projection curves of daily cases for next 10 days for most of the countries, is either logarithmic or an exponential growth curve. But in case China, a negative exponential curve for CC is expected. Thus expected chances are that there will be no new cases in China in the coming days. On the other hand, countries such as Brazil and USA will experience the worst case scenarios and requisite measures are still to be taken into consideration to control the pandemic. The maximum percentage rise in the CC to the total population of a country is estimated in Brazil where almost 138 new people out of one million are getting infected daily and minimum rise is seen in France where only 2 out of one million people are being infected. For the maximum percentage rise in the DC with respect to total population, it is expected that out of one million people maximum change is noticed in USA where at least 41 people are dying daily and no or minimal change is noticed in case of Germany, Iran and Turkey where no new deaths are projected. These estimated fluctuations in the number of CC and DC are driven by the rise in the number of cases in all of these countries under consideration.
Comparing the prediction models with the actual confirmed positive and death cases in all these countries, we found that the model predicted almost similar results as reported by WHO till 29 May 2020. The proposed GEP models are also able to predict the more recent rise and slowdown in the number of cases, suggesting that the transmission of COVID-19 might have started to decline or have a negative growth for China and Singapore; almost stagnates for Spain, France, Italy and Germany; rising at a slow pace for Canada, South Africa, Iran and Turkey; and escalating at a rapid speed for Brazil, Mexico, USA, Russia and UK. The total rise or decline in the number of cases for these respective countries, could be the result of increased detection, surveillance, period of lockdown, social distancing efforts and other necessary measures taken by the respective authorities. Though lockdown and social distancing norms were put forth by the first week of March in almost every other country but the extent of virus had already reached for community level transmission and hence is affecting masses at a larger scale.
Based on our estimates in some countries such as Singapore, it can be seen from the model that a few newly introduced cases to a new location may not necessarily lead to an outbreak. Even if the number of cases is high, it must take several new instances for the outbreak to establish. This is because high level individual based variations in pandemic transmission may lead to new cases and hence can contribute to more fragile chains of transmission, which is less likely to be noticed. Apart from that in countries such as USA and Brazil, the COVID-19 is escalating as a community level transmission agent and hence the number of cases is increasing at a rapid speed. This factor thus highlights the importance of rapid identification and isolation of new cases and requirement of respective control measures to restrict the chain of transmission.
There are several advantages of the proposed GEP models. We have presented extensive ETs, Algorithms and prediction variables for all the countries under study. Thus providing detailed understanding on how COVID-19 will behave in the coming days. The ETs for all the countries, can be used for mathematical formulation of the disease in that particular country. These ETs consist of potential information about the basic architecture and psychology of COVID-19 and overall meaningful information can be derived from them. The mathematical equations thus formulated can be subjected to other evolutionary and swarm intelligence based algorithms for further predictions. Also the algorithms proposed can also be used to estimate future prediction for these countries. Apart from these, the prediction variables play a very significant role and is required to analyse the importance of each variable in the model. The models generated based on these formulations, are simple and meaningful information regarding the possible impact of COVID-19 in near future can be analysed. As more data is available, more possible future estimates can be refined. The results further show that substantial variations in COVID-19 transmission over time and suggests possible decline in transmission in some countries such as China and Singapore, whereas it will continue to rise at an escalating speed for Brazil and USA. For these countries, it is very crucial to understand the dynamics of outbreak and effective control measures to be taken so that the transmission can be contained and effectively mitigated.
5. Summary of the article
5.1. Background
With a total of more than 6 million confirmed cases and 300,000 deaths, the coronavirus disease 2019 (COVID-19) has emerged as a novel global pandemic. Understanding the transmission dynamics of the disease and evaluating the potential effect in different regions is highly crucial. Designing new mathematical models of novel coronavirus 2 with two datasets from 15 most affected countries of the world, it has been estimated, how transmission in these countries varied between January 2020 and May 2020. Further future predictions on the rise of the virus in the coming days till 8 June 2020 has also been presented. Thus from these predictions, the potential effect of the virus and its human to human transmission in various countries has been introduced.
5.2. Methods
An evolutionary data analytics method called Genetic programming (GP) is implemented in this study. More precisely a robust variant of GP termed gene expression modelling (GEP) based time series prediction models have been proposed, for total confirmed cases (CC) and death count (DC) across fifteen most affected countries of the world. The GEP prediction models are presented as explicit mathematical formulas in the form of expression trees, algorithms and importance of prediction variables is also studied. These models have been used to how the transmission has varied over the past five months and what will be the effect in the coming days. Based on these estimates, the probability of expected rise in the daily cases has been calculated. The GEP models have been proposed for two publicly available datasets on the total number of confirmed cases and death counts for these countries under study. The GEP models provide analysis on the total number of cases (actual versus predicted) from 30 January 2020 till 29 May 2020; and time series prediction from 29 May 2020 to 8 June 2020. The countries have been selected in such a way that at least one country has been studied from each continent including countries like Brazil and USA (with the highest rate of rise in cases); Singapore and South Africa (with average rise in the total number of cases) and China (where negative growth is being noticed).
5.3. Findings
The GEP-based models for CC and DC are built for each of the 15 most affected contires. These model are presented using explicit formula which can be used for further studies of the outbreak in each of these 15 countries. The developed models estimated that the daily rise in the reproduction rate of COVID-19 in Brazil is highest with a total of 28,822 expected new cases per day whereas the death toll is highest in USA with around 1358 expected deaths daily. An overall study shows that the number of CC to DC for each country is given by USA: 20,972/1358 (confirmed cases/death count), Brazil: 28,822/1076, Russia: 6,928/270, Mexico: 4,121/466, UK: 3,759/204, Iran: 1,652/57, South Africa: 1895/60, Turkey: 1,071/17, Canada: 717/103, Spain: 321/148, Germany: 271/23, Italy: 247/178, France: 191/50, Singapore: 68/0.05 and a negative growth in both new confirmed cases and total deaths is estimated in China. The percentage rise in the number of new CC and DC, is expected to be highest in Brazil where almost 138 out of every one million people are getting infected daily whereas the maximum deaths are expected in USA where at least 41 out of infected persons are dying everyday and the trend is expected to continue in the coming days. Based on our estimates, introduction of a few new cases daily does not account for a community level transmission of infection but the addition of thousands of new cases can lead to a disastrous situation in any country.
5.4. Interpretation
Our results show that COVID-19 transmission is declining in China since late March 2020; in case of Singapore, France, Italy, Germany and Spain it is stagnating; Canada, Turkey, South Africa and Iran have slow rise in the daily number of cases; and in UK, Mexico, Russia, USA and Brazil, the cases are escalating at a rapid pace as of 29 May 2020. As more new cases arrive in these locations, it becomes very necessary for the authorities to adopt certain control measures to stop the chains of transmission, failing to establish such measures might lead to new outbreaks and the virus may never go from the lives of common masses.
6. Conclusion
This article deals with the analysis and prediction of COVID-19 in 15 worst affected countries of the world in terms of both confirmed cases and death count in the respective country. Here new accurate and empirical GEP based models have been designed to predict the total number of CC and DC across 15 countries. The proposed models used raw data from the daily situation reports published by WHO since 30 January 2020. Based on the above proposed models, following major conclusions have been drawn:
-
•
The proposed GEP models for both CC and DC for all the countries under consideration are highly reliable and provide almost accurate results with respect to the actual data. They also satisfy the inherent conditions of external validation and provide better predictions for future as well.
-
•
Based on the ETs, it can be said that the models have maximum 4 to 5 sub-ETs and are very simple in structure. Thus basic numerical equations can be designed from them without the requirement of any time consuming laboratory based implementations. Further, these numerical equations can be optimized using different evolutionary and swarm intelligent approaches.
-
•
The importance of prediction variables is also very significant in the proposed models and it has been found that in most of the cases, one or two variables pose any significant effect while others seems to be irrelevant.
-
•
The statistical results for all the cases verify that the RMSE and R 2 for all the cases is above acceptable level, having higher values of RMSE and R 2 close to 1. Thus validating the superior performance of the proposed GEP models.
-
•
Apart from these results, it can be said that when the total experimental data is limited and the neural network models fail to provide reliable results, the GEP based models have higher accuracy and simple implementation to provide reliable time series analysis.
-
•
The overall advantage of these GEP models is that they can be represented using simple mathematical formula, which can be used for explicit study of the outbreak in each of these countries.
From the above conclusions, it is evident that GEP based models are highly reliable and can be considered as benchmarks for time series analysis when the total number of cases is limited. The major drawback of this kind of modelling is that when the total number of instances increase many fold, it is not able to predict reliable results. In those cases, prediction equations formulated using GEP modelling are subjected to higher level evolutionary and swarm intelligent algorithms such as naked mole-rat algorithm, krill herd algorithm and others and reliable conclusions are drawn. Apart from that, the analysis based on GEP modelling can help in deciding the total requirement of lock down, social distancing, and other safety measures that need to be followed to keep the virus under check.
Compliance with Ethical Standards
Conflicts of Interest The authors declare that they have no conflict of interest. Informed Consent All procedures followed were in accordance with the ethical standards of the responsible committee on human experimentation (institutional and national) and with the Helsinki Declaration of 1975, as revised in 2008 (5). Additional informed consent was obtained from all patients for which identifying information is included in this article.
Human and Animal Rights This article does not contain any studies with human or animal subjects performed by the any of the authors.
Declaration of Competing Interest
The authors declare that they have no known competing financial interests or personal relationships that could have appeared to influence the work reported in this paper.
References
- 1.Huang C., Wang Y., Li X., Ren L., Zhao J., Hu Y., Zhang L., Fan G., Xu J., Gu X. Clinical features of patients infected with 2019 novel coronavirus in wuhan, china. Lancet. 2020;395:497–506. doi: 10.1016/S0140-6736(20)30183-5. [DOI] [PMC free article] [PubMed] [Google Scholar]
- 2.WHO. statement regarding cluster of pneumonia cases in wuhan, china. 2020. Available online: https://www.who.int/china/news/detail/09-01-2020-who-statementregarding-cluster-of-pneumonia-cases-in-wuhan-china (accessed on 17 February 2020). World Health Organization, Geneva, Switzerland.
- 3.WHO director-general’s opening remarks at the media briefing on COVID-19 – 11 march 2020. 2020. [Online; accessed 21-March-2020].
- 4.Moore M., Gelfeld B., Okunogbe A.T., Christopher P. RAND Corporation; Santa Monica, CA, USA: 2016. Identifying Future Disease Hot Spots: Infectious Disease Vulnerability Index. [PMC free article] [PubMed] [Google Scholar]; Available online: https://www.rand.org/pubs/research-reports/RR1605.html (accessed on 17 February 2020).
- 5.WHO. novel coronavirus’thailand (ex-china). 2020. Available online: https://www.who.int/csr/don/14-january-2020-novel-coronavirus-thailand-ex-china/en(accessed on 17 February 2020). World Health Organization, Geneva, Switzerland.
- 6.WHO. Situation report; World Health Organization: Geneva, Switzerland, 2020. Available online: https://wwww.hoint/emergencies/diseases/novel-coronavirus-2019/situation-reports/.
- 7.Riou J., Althaus C.L. bioRciv; 2020. Pattern of early human-to-human transmission of wuhan 2019-ncov. [DOI] [PMC free article] [PubMed] [Google Scholar]
- 8.Salgotra R., Gandomi M., Gandomi A.H. Time series analysis and forecast of the COVID-19 pandemic in india using genetic programming. Chaos, Solitons & Fractals. 2020;138:109945. doi: 10.1016/j.chaos.2020.109945. [DOI] [PMC free article] [PubMed] [Google Scholar]
- 9.Backer J.A., Klinkenberg D., Wallinga J. medRciv; 2020. The incubation period of 2019-ncov infections among travellers from wuhan, china. [DOI] [PMC free article] [PubMed] [Google Scholar]
- 10.Chang SL, et al. ”Modelling transmission and control of the COVID-19 pandemic in australia.” arXiv preprint arXiv:2003.10218. [DOI] [PMC free article] [PubMed]
- 11.Read J.M., Bridgen J.R.E., Cummings D.A.T., Ho A., Jewell C.P. medRciv; 2020. Novel coronavirus 2019-ncov: early estimation of epidemiological parameters and epidemic predictions. [DOI] [PMC free article] [PubMed] [Google Scholar]
- 12.Zheng Q, Meredith H, Grantz K, Bi Q, Jones F, Lauer S. JHU IDD team. real-time estimation of the novel coronavirus incubation time. 2020. Available online: https://github.com/HopkinsIDD/ncov-incubation (accessed on 17 February 2020).
- 13.Boldog P. Risk assessment of novel coronavirus COVID-19 outbreaks outside china. J Clin Med. 2020;9(2):571. doi: 10.3390/jcm9020571. [DOI] [PMC free article] [PubMed] [Google Scholar]
- 14.Eubank S., Guclu H., Kumar V.A., Marathe M.V., Srinivasan A., Toroczkai Z., Wang N. Modelling disease outbreaks in realistic urban social networks. Nature. 2004;429(6988):180–184. doi: 10.1038/nature02541. [DOI] [PubMed] [Google Scholar]
- 15.Salgotra R., Gandomi A.H. Data Science for COVID-19. Elsevier; 2020. Time series analysis of the COVID-19 pandemic in australia using genetic programming. In press. [DOI] [PMC free article] [PubMed] [Google Scholar]
- 16.Qi H., Xiao S., Shi R., Ward M.P., Chen Y., Tu W. COVID-19 Transmission in mainland china is associated with temperature and humidity: a time-series analysis. Sci Total Environ. 2020:138778. doi: 10.1016/j.scitotenv.2020.138778. [DOI] [PMC free article] [PubMed] [Google Scholar]
- 17.Linton N.M., Kobayashi T., Yang Y., Hayashi K., Akhmetzhanov A.R., Jung S.-M. medRciv; 2020. Epidemiological characteristics of novel coronavirus infection: a statistical analysis of publicly available case data. [DOI] [PMC free article] [PubMed] [Google Scholar]
- 18.Liu T, Hu J, Kang M, Lin L, Zhong H, Xiao J, Deng A. Transmission dynamics of 2019 novel coronavirus (2019-ncov). 2020.
- 19.Koza J.R. MIT Press; Cambridge, MA: 1992. Genetic programming: on the programming of computers by means of natural selection. [Google Scholar]
- 20.Goldberg DE, Holland JH. Genetic algorithms and machine learning. 1988.
- 21.Banzhaf W., Nordin P., Keller R., Francone F. On the automatic evolution of computer programs and its application, dpunkt/Morgan Kaufmann, Heidelberg, Germany/San Francisco. 1998. Genetic programming’an introduction. [Google Scholar]
- 22.Ferreira C. Gene expression programming: a new adaptive algorithm for solving problems. Complex Syst. 2001;13(2):87–129. [Google Scholar]
- 23.Fanelli D., Piazza F. Analysis and forecast of COVID-19 spreading in china, italy and france. Chaos, Solitons & Fractals. 2020;134:109761. doi: 10.1016/j.chaos.2020.109761. [DOI] [PMC free article] [PubMed] [Google Scholar]
- 24.Mandal M., Jana S., Nandi S.K., Khatua A., Adak S., Kar T.K. A model based study on the dynamics of COVID-19: prediction and control. Chaos, Solitons & Fractals. 2020:109889. doi: 10.1016/j.chaos.2020.109889. [DOI] [PMC free article] [PubMed] [Google Scholar]
- 25.Salgotra R., Singh S., Singh U., Saha S., Gandomi A.H. COVID-19: Time series datasets india versus world. Mendeley Data, v1. 2020 doi: 10.17632/tmrs92j7pv.1. [DOI] [Google Scholar]
- 26.Gandomi A.H., Alavi A.H., Mirzahosseini M.R., Nejad F.M. Nonlinear genetic-based models for prediction of flow number of asphalt mixtures. J Mater Civ Eng. 2011;23(3):248–263. [Google Scholar]
- 27.Javadi A.A., Rezania M. Applications of artificial intelligence and data mining techniques in soil modeling. Geomech Eng. 2009;1(1):53–74. [Google Scholar]
- 28.Pal R, Sekh AA, Kar S, Prasad DK. Neural network based country wise risk prediction of COVID-19. 2020. ArXiv preprint arXiv:2004.00959.
- 29.Fair K.M., Zachreson C., Prokopenko M. Creating a surrogate commuter network from australian bureau of statistics census data. Sci Data. 2019;6(1):1–14. doi: 10.1038/s41597-019-0137-z. [DOI] [PMC free article] [PubMed] [Google Scholar]
- 30.Alavi A.H., Gandomi A.H. A robust data mining approach for formulation of geotechnical engineering systems. Eng Comput. 2011;28(3–4):242–274. [Google Scholar]
- 31.Genexpro tools 4.0 [computer software]. 2006. Bristol, UK, GEPSOFT Ltd.
- 32.Smith G.N. Collins; London: 1986. Probability and statistics in civil engineering. [Google Scholar]
- 33.Frank I.E., Todeschini R. Elsevier; Amsterdam: 1994. The data analysis handbook. [Google Scholar]
- 34.Golbraikh A., Tropsha A. ”Beware of q2!”. J Mol Graphics Modell. 2002;20(4):269–276. doi: 10.1016/s1093-3263(01)00123-1. [DOI] [PubMed] [Google Scholar]
- 35.Roy P.P., Roy K. On some aspects of variable selection for partial least squares regression models. QSAR Comb Sci. 2008;27(3):302–313. [Google Scholar]
- 36.Gandomi A.H., Alavi A.H., Ryan C. Springer; Cham: 2015. Handbook of genetic programming applications. [Google Scholar]
- 37.Gandomi A.H., Alavi A.H. Krill herd: a new bio-inspired optimization algorithm. Commun Nonlinear Sci Numer Simul. 2012;17(12):4831–4845. [Google Scholar]
- 38.Salgotra R., Singh U. The naked mole-rat algorithm. Neural Computing and Applications. 2019;31(12):8837–8857. [Google Scholar]