Abstract
Background: Autophagy is a crucial factor contributing to radioresistance during radiotherapy. Although Lys05 has proven its ability to improve the results of radiotherapy through the inhibition of autophagy, molecular mechanisms of this inhibition remain elusive. We aimed to describe the molecular mechanisms involved in Lys05-induced inhibition of autophagy. Materials and Methods: Radioresistant human non-small cell lung carcinoma cells (H1299, p53-negative) and methods of quantitative phosphoproteomics were employed to define the molecular mechanisms involved in Lys05-induced inhibition of autophagy. Results: We confirmed that at an early stage after irradiation, autophagy was induced, whereas at a later stage after irradiation, it was inhibited. The early-stage induction of autophagy was characterized mainly by the activation of biosynthetic and metabolic processes through up- or down-regulation of the critical autophagic regulatory proteins Sequestosome-1 (SQSTM1) and proline-rich AKT1 substrate 1 (AKT1S1). The late-stage inhibition of autophagy was attributed mainly to down-regulation of Unc-51 like autophagy-activating kinase 1 (ULK1) through phosphorylation at Ser638. Conclusion: This work contributes to emerging phosphoproteomic insights into autophagy-mediated global signaling in lung cancer cells, which might consequently facilitate the development of precision medicine therapeutics.
Keywords: Phosphoproteomics, lung cancer, autophagy, inhibitor, Lys05
Lung cancer is one of the most widespread tumor diseases worldwide. Approximately 80% of all lung cancer cases are non-small cell lung cancer (NSCLC) (1,2). Treatment of NSCLC includes several approaches from which radiation therapy (RT) is one of the most common. According to radiation oncologists, radioresistance seems to be the most severe issue in treatment efficacy, and importantly, it involves autophagy as a crucial factor (3).
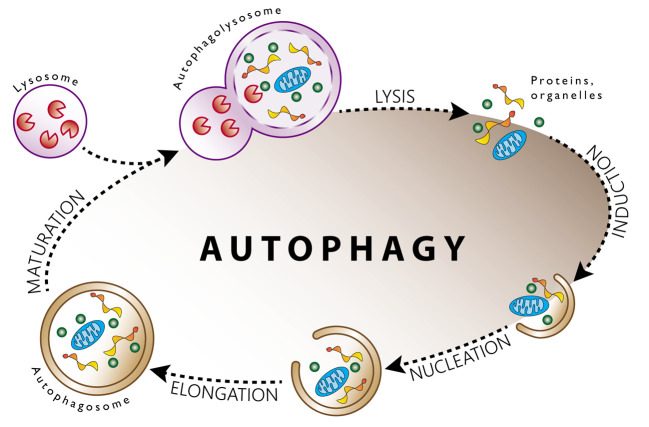
Autophagy is a natural degradation mechanism allowing the regulated destruction and recycling of cellular components in order to maintain homeostasis, especially during stress conditions (4). This degradation process takes place in both healthy and cancer cells. Figure 1 briefly depicts the critical steps of the autophagic process. The leading role of autophagy in emerging tumors is to provide nutrients and other metabolic precursors and thus maintain survival. On the other hand, developed tumors do not usually suffer from a nutrient shortage. However, they are often exposed to various kinds of anticancer therapy, which causes an extensive amount of cellular stress. Under these conditions, autophagy takes part in the elimination of toxic species (e.g. free radicals, damaged and misfolded proteins or organelles) and plays a cytoprotective role (5). Therefore, inhibition of autophagy seems to be a practical approach for improving cancer therapy.
Figure 1. Schematic overview of the autophagic process. Various stimuli such as starvation, oxygen shortage, and ionizing radiation induce autophagy. Initially, a phagophore is formed and begins to encapsulate molecules that will degrade. Subsequent nucleation and elongation lead to the formation of the characteristic double-membraned autophagosome. After the formation of the autophagosome, lysosome approaches to fuse. The formation of an autophagolysosome accompanies fusion. After fusion, the degradation of the sequestered cytoplasmic cargo involves several acid hydrolases. These hydrolases are then recycled.
Several studies have already described the sensitizing effects of autophagy inhibitors against ionizing radiation (IR) (5). For example, both Chen et al. (6) and Tao et al. (7) referred to the radiosensitization of esophageal squamous cell carcinoma using 3-methyladenine as an autophagy inhibitor. Similarly, Park et al. observed the radiosensitization of colorectal cancer cells due to the accumulation of DNA damage using spautin-1 as an autophagy inhibitor (8).
In our recent study, we described the effect of autophagy inhibitor Lys05 together with IR, which reduced the survival of H1299 NSCLC cells compared to the inhibitor or IR alone (9). Lys05 is a relatively new inhibitor that was firstly introduced by McAfee et al. (10). Chemically, it is a dimeric form of chloroquine which accumulates within lysosomes and thus inhibits autophagosome–lysosome fusion (10). We examined the effects of Lys05 on H1299 cells, mostly using classical biological methods. However, a deeper understanding of the molecular mechanisms underlying Lys05-mediated radiosensitization is still required.
The present study aimed to investigate the mechanisms of radiosensitization of H1299 NSCLC cells. As in our previous work, we applied Lys05 as the autophagy inhibitor, and using the methods of quantitative phosphoproteomics, we studied the mechanisms of autophagy inhibition and subsequent radiosensitization.
Materials and Methods
Cells and cultivation. H1299 Non-small cell lung carcinoma cells were obtained from the American Type Culture Collection (Manassas, VA, USA). Cells were cultured at 37˚C in a humidified incubator under 5% CO2 and maintained in RPMI medium 1640 (Gibco, Paisley, UK) supplemented with a 10% fetal bovine serum, 150 Ul/ml penicillin and 50 mg/ml streptomycin (all from Sigma-Aldrich, St. Louis, MO, USA). The maintenance culture was divided twice per week by dilution to a density of 2×10⁵ cells/10 ml. The cell line was used up to a maximum of 15 passages for this study.
Stable isotope labeling by amino acids in cell culture (SILAC). The phosphoproteomic analysis was performed using a SILAC-based approach, as described previously (11). For labeling, H1299 cells were divided into two groups and transferred into SILAC RPMI medium (Gibco) with the addition of either non-labeled L-lysine (32 mg/l), L-arginine (200 mg/l) and L-glutamine (300 mg/l) – a ‘light’ group or labeled L-lysine-4,4,5,5-d4 hydrochloride,L-arginine-13C6 hydrochloride and L-glutamine (in equimolar amounts) – a ‘heavy’ group, both supplemented with 10% dialyzed fetal bovine serum, 150 Ul/ml penicillin and 50 mg/ml streptomycin (all from Sigma-Aldrich). L-Proline (300 mg/l) was added to the media to avoid the metabolic conversion of arginine to proline (12). At least six doublings were required for the full incorporation of labeled amino acids.
Cell treatment. The cells from the heavy group were treated by autophagy inhibitor Lys05 (a kind gift of Dr. Ravi Amaravadi, Pennsylvania University, Philadelphia, PA, USA) at a concentration of 2 μM. The inhibitor was added to the cells 1 h before irradiation. The cells from the light group were left untreated. Both groups were irradiated with a single dose of 2 Gy using a 60Co gamma-ray source at a dose rate of 1.04 Gy/min. After irradiation, each group was divided into two subgroups, returned to an incubator and cultivated further for a 1 and 48 h, respectively.
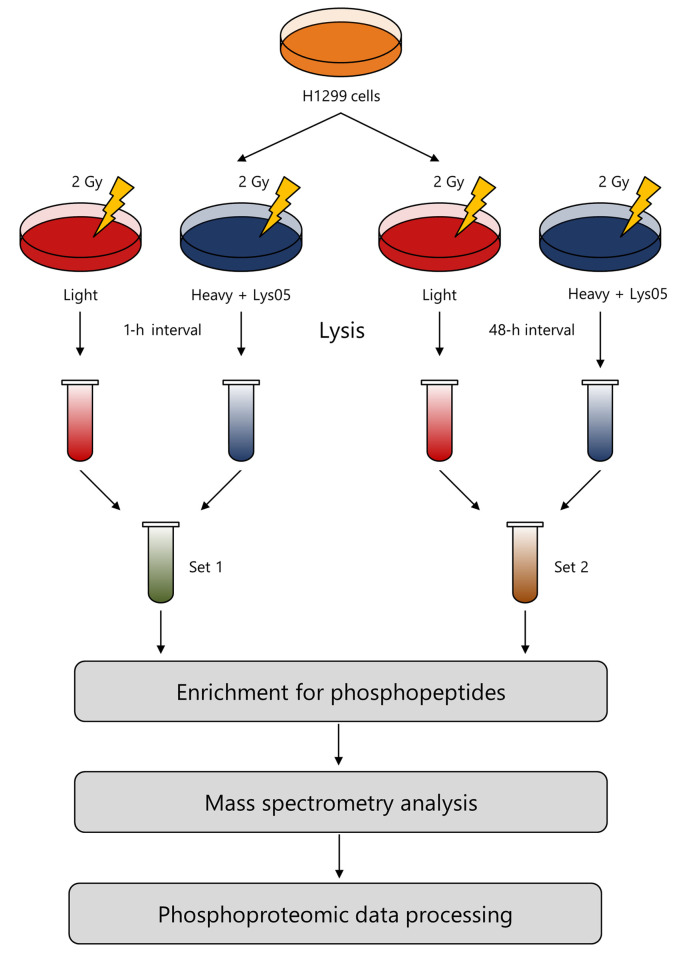
Recovery of proteins. The cells were lysed using a lysis buffer with the composition of 50 mM ammonium bicarbonate, 1% sodium deoxycholate, and phosphatase inhibitor cocktails 2 and 3 (Sigma-Aldrich). The appropriate subgroups of ‘heavy‘ and ‘light’ proteins were pooled together in a 1:1 ratio and digested with trypsin (Sequencing Grade Modified Trypsin; Promega Corporation, Madison, WI, USA) as mentioned elsewhere (11). Thus, two sets of cells were formed: Set 1 consisting of light and heavy cells processed 1 h after irradiation and Set 2 consisting of light and heavy cells processed 48 h after irradiation. Figure 2 schematically depicts the procedure of our experiment.
Figure 2. The workflow of sample processing. H1299 cells were irradiated and cultivated in a ‘heavy’ or ‘light’ stable isotope labeling by amino acids in cell culture (SILAC) medium. One and 48 h after irradiation, the cells were lysed and samples from the heavy and light media were pooled together to form Set 1 and Set 2, respectively. Samples from both sets were enriched for phosphopeptides, analyzed using mass spectrometry and processed based on the principles of quantitative phosphoproteomics.
Enrichment for phosphopeptides. After digestion, redundant sodium deoxycholate was extracted by ethyl acetate (13) and samples from both sets were desalted using C18 solid-phase extraction cartridges (3M™ Empore™, St. Paul, MN, USA) with subsequent elution by 60% acetonitrile/0.1% trifluoroacetic acid. Afterward, the samples were enriched for phosphopeptides using titanium dioxide chromatography (14). Enrichment for phosphopeptides was performed using Mobicol spin columns (MoBiTec GmbH, Goettingen, Germany). Firstly, the samples were supplemented with loading buffer (65% acetonitrile, 2% TFA, 100 mM glutamic acid). Then titanium dioxide microparticles (Titansphere® 5 μm particles; GL Sciences, Torrance, CA, USA) suspended in loading buffer were added to the samples (peptide:TiO2 ratio, 1:10) and left mixing for 30 minutes at room temperature. Afterward, the microparticles were washed with 200 μl of loading buffer, 200 μl of washing buffer 1 (65% acetonitrile with 0.5% TFA), then sequentially with 200 μl and 100 μl of washing buffer 2 (65% acetonitrile with 0.1% TFA). Phosphopeptides were then eluted by 150 μl of elution buffer (NH4OH, pH 11.5). After elution, they were acidified with 10% TFA to pH 2 and desalted using C18 spin columns (Harvard Apparatus, Holliston, MA, USA). Desalted TiO2-enriched peptides were dried out in an Eppendorf™ Concentrator Plus (Eppendorf, Hamburg, Germany).
Mass spectrometry. For the mass spectrometric analysis, we used a Dionex Ultimate™ 3000 RSLCnano system coupled through Nanospray Flex ion source with a Q-Exactive mass spectrometer (both Thermo Fisher Scientific, Bremen, Germany). The TiO2-enriched peptide mixture (2% acetonitrile/0.05% TFA; 1 μl) was injected onto a capillary trap column (C18 PepMap100, 3 μm, 100 A, 0.075×20 mm; Dionex) and then eluted and separated on capillary column (C18 PepMap RSLC, 2 μm, 100 A, 0.075×150 mm; Dionex) with a step linear gradient of mobile phase B (80% acetonitrile/0.1% formic acid) over mobile phase A (0.1% formic acid) from 4% to 34% B in 68 minutes and from 34% to 55% B in 21 minutes, at flow rate of 300 nl/min. The column was maintained at 40˚C and the eluent was monitored at 215 nm.
Phosphoproteomic data processing. Raw mass spectrometric files were processed with MaxQuant software v. 1.5.6.5 (available online: https://maxquant.org) (15). Peak lists were searched against the human UniProt database using the Andromeda search engine (16). The parameters applied for protein identification were: MS/MS tolerance=0.02 Da; peptide mass tolerance for MS=6 ppm and for MS2=20 ppm; missed cleavages=0; enzyme=trypsin; fixed modification: carbamidomethyl (C) and variable modification: oxidation (M), acetyl (protein N-term), phospho (STY). Additionally, appropriate SILAC labels were selected (Arg6, Lys4). Only proteins, peptides, and phosphorylation sites with a false-discovery rate (FDR) lower than 0.01 were accepted. Both razor and unique peptides were used for the calculation of heavy/light protein ratios.
Statistical analysis. Statistical analysis was performed using Perseus software v. 1.5.6.0 (available online: https://maxquant.net/perseus). Contaminants and reversed hits were removed first before further data processing. To identify significantly differentially regulated phosphosites, ‘Significance B test‘ was used with Benjamini-Hochberg FDR correction (FDR<0.05). Proteins with differentially regulated phosphosites were subjected to Gene Ontology (GO) analysis. GO analysis was performed using the ConsensusPathDB over-representation analysis web tool v. 32 (p-value<0.01; available online: http://consensuspathdb.org). We deployed STRING software v. 10.5 (available online: http://string-db.org) to identify potential protein-protein interactions of phosphorylated proteins, applying a minimum confidence score of 0.4 and a maximum number of 20 additional interactors (added by the STRING software). The resulting inferred networks were visualized using the STRING network viewer.
Results
General phosphoproteomic description. We performed a phosphoproteomic (SILAC-based) analysis to investigate the mechanisms involved in the radiosensitization of H1299 cells mediated by the abrogation of autophagy. In general, we worked with two sets of H1299 cells: i) Those processed 1 h after irradiation (Set 1), and ii) those processed 48 h after irradiation (Set 2).
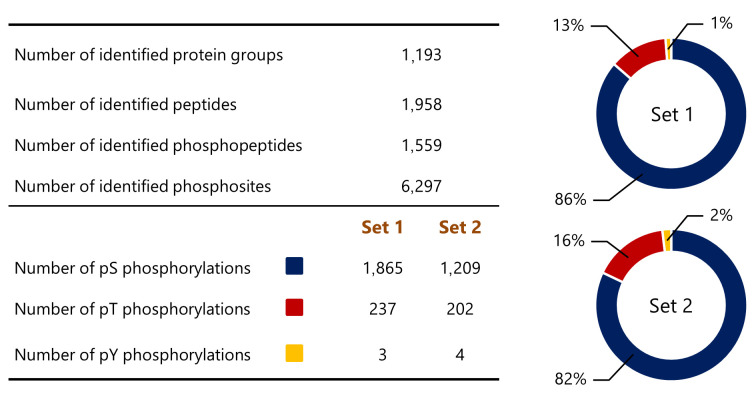
Overall, we identified 1,193 protein groups with 6,297 phosphorylation sites (Figure 3). Of these proteins, the most abundantly phosphorylated amino acid detected in both Set 1 and Set 2 was serine (86% and 82%, respectively), followed by threonine (13% and 16%, respectively) and tyrosine (1% and 2%, respectively) (Figure 3).
Figure 3. A general overview of the phosphoproteomic analysis. The table indicates the number of identified proteins, peptides, phosphopeptides, and phosphosites. The number of phosphorylations refers to identified phosphorylations of a particular amino acid in each set: pS: serine, pT: threonine, pY: tyrosine. The percentage distribution of phosphorylation among serine (blue), threonine (red), and tyrosine (yellow) residues is visualized using the ring plots.
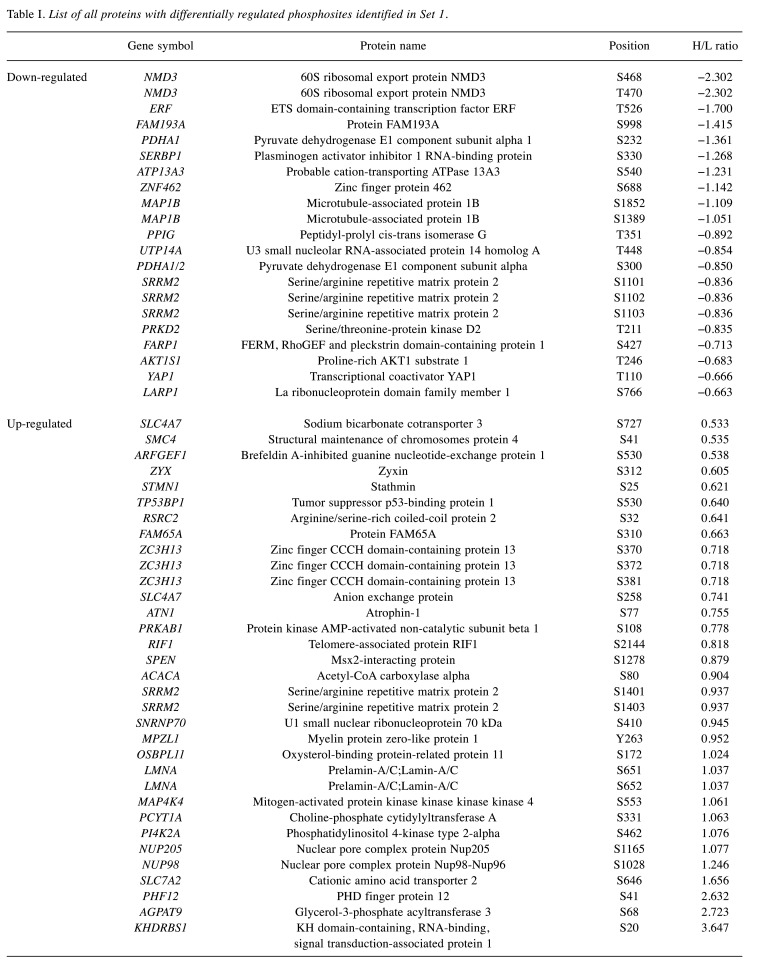
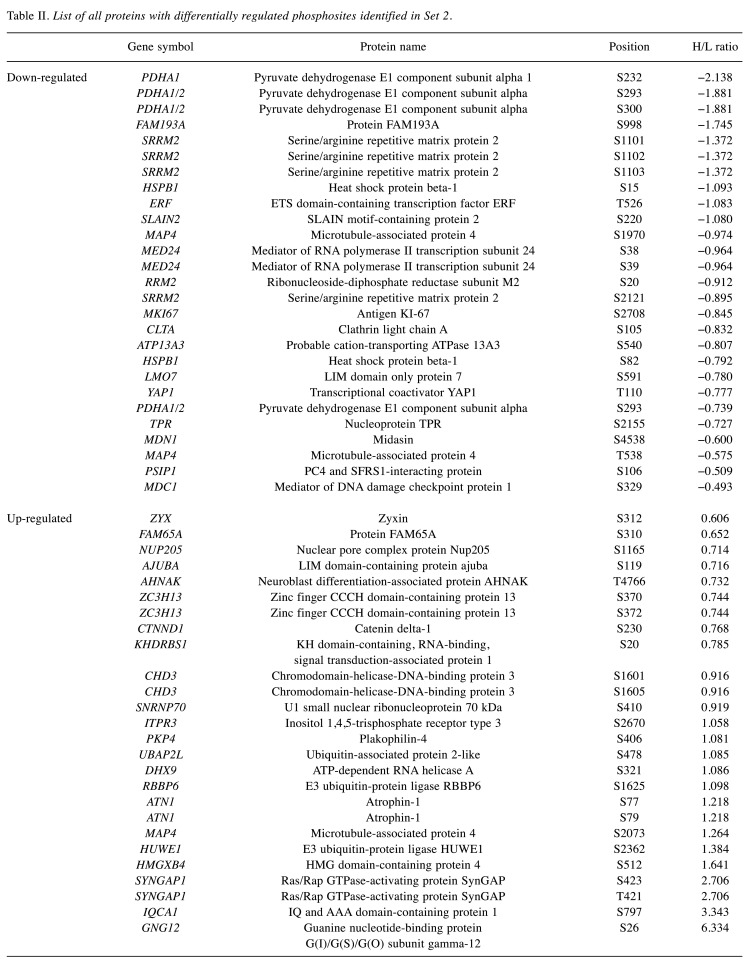
Overview of the differentially regulated phosphosites. Differential regulation of phosphosites correlated with an impact of the inhibitor on H1299 cells and with subsequent changes in the signaling pathways. We identified 54 proteins with differentially regulated phosphosites in Set 1. In this Set, we observed the up-regulation of 33 phosphosites and down-regulation of 21 phosphosites (Figure 4A). Additionally, we identified 53 proteins with differentially regulated phosphosites in Set 2. This Set included 26 up-regulated and 27 down-regulated phosphosites (Figure 4B). Finally, we detected 17 phosphosites differentially regulated in both sets (Figure 4C). Table I and Table II summarize all proteins with differentially regulated phosphosites identified in sets 1 and 2, respectively.
Figure 4. Overview of proteins with differentially regulated phosphosites. A: Proteins with significantly differentially regulated phosphosites identified 1 h after irradiation (Set 1). B: Proteins with significantly differentially regulated phosphosites identified 48 h after irradiation (Set 2). C: Venn diagram of proteins with differentially regulated phosphosites identified 1 h (red) and 48 h (green) after irradiation. H: Heavy labeled; L: light labeled.
Table I. List of all proteins with differentially regulated phosphosites identified in Set 1.
Table II. List of all proteins with differentially regulated phosphosites identified in Set 2.
GO analysis suggests delayed onset of autophagy inhibition in H1299 cells. In order to biologically evaluate proteins with differentially regulated phosphosites, we subjected both sets to GO analysis. According to the ConsensusPathDB GO analysis (level 4 terms), most of the proteins with differentially regulated phosphosites from Set 1 (displayed in Figure 5A) were localized in various parts of the nucleus. On the other hand, proteins with differentially regulated phosphosites from Set 2 (displayed in Figure 5B) were localized in both the nucleus and the cytosol. Proteins with differentially regulated phosphosites found in both sets performed molecular functions associated with transcription and RNA binding.
Figure 5. Gene ontology (GO) over-representation analysis of proteins of Set 1 (A) and Set 48 2 (B) with differentially regulated phosphosites using the ConsensusPathDB level 4 terms. GO terms with darker colors correspond to proteins with up-regulated phosphosites. GO terms with brighter colors correspond to those with down-regulated phosphosites.
In terms of biological processes, proteins with differentially up-regulated phosphosites from Set 1 took part mostly in cellular transport, biosynthetic and metabolic processes, gene expression, and in response to heat. The up-regulation of biosynthetic, metabolic, and transporting processes might represent one of the specific signs indicating activation of autophagy. Moreover, up-regulated processes of response to heat might be associated with the cellular reaction to various kinds of stress. On the other hand, proteins with differentially down-regulated phosphosites from Set 1 took part in processes associated with the regulation of cell growth (size) or with the main signaling pathway of autophagy, target of rapamycin signaling (TOR). Typically, an activated TOR signaling pathway leads to the inhibition of autophagy. In our setting, down-regulation of TOR signaling might suggest activation of autophagy.
Proteins with differentially up-regulated phosphosites from Set 2 fulfilled tasks associated with the RNA processing. Processes of cellular response to heat, as well as biosynthetic and metabolic processes, were down-regulated in this set, suggesting eventual inhibition of autophagy.
String analysis suggests inhibition of autophagy through Unc-51 like autophagy activating kinase 1 (ULK1)-autophagy-related protein 13 (ATG13) pathway. STRING is a database of known and predicted protein-protein interactions. We used STRING to study the potential interactions among the proteins with differentially regulated phosphosites and to outline the functional groups of proteins identified in both sets.
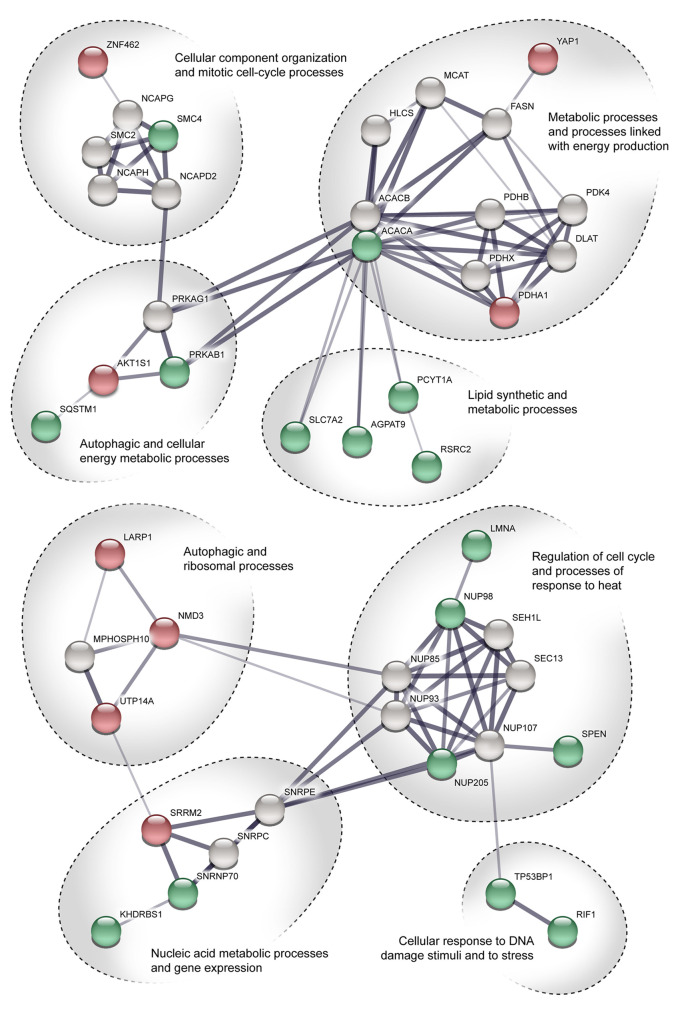
In regards to Set 1 (Figure 6), we recognized two significant groups: one associated with biosynthetic and metabolic processes, and one associated with regulation of the cell cycle. In the first group, we detected proteins with up-regulated phosphosites that control lipid synthetic and metabolic processes. These proteins interact with proteins that control processes linked to energy production. The up-regulation of these proteins suggests activation of autophagy. Moreover, regulatory proteins sequestosome 1 (SQSTM1), proline-rich AKT1 substrate 1 (AKT1S1), and protein kinase AMP-activated non-catalytic subunit beta 1 (PRKAB1), which are linked with autophagy induction and formation of autophagosomes, were detected. In the second group, we detected proteins that regulate the cellular response to stress. Their up-regulation suggests activation of autophagy. Considering these findings, we assume that autophagy is activated 1 h after irradiation.
Figure 6. STRING pathway interaction network of proteins with differentially regulated phosphosites. The figure shows the proteins identified 1 h after irradiation. Points colored green represent proteins with up-regulated phosphosites. Points colored red represent proteins with down-regulated phosphosites. Proteins colored grey were added automatically by the software. Line thickness indicates the strength of data support. See Tables I and II for protein names.
In Set 2 (Figure 7), we identified several smaller protein groups. Most of them were associated with the regulation of gene expression or transport mechanisms. The most relevant in terms of autophagy inhibition would seem to be the ULK1–ATG13 pathway. In this pathway, the mammalian target of rapamycin (mTOR) together with AMP-activated protein kinase (AMPK) play a critical role as they cooperate in phosphorylation of ULK1 at Ser638 (17). We identified ULK1 with up-regulation of a phosphosite on Ser638. There is evidence that such phosphorylation leads to reduced autophagic activity (18).
Figure 7. STRING pathway interaction network of proteins with differentially regulated phosphosites. The figure shows the proteins identified 48 h after irradiation. Points colored green represent proteins with up-regulated phosphosites. Points colored red represent proteins with down-regulated phosphosites. Proteins colored grey were added automatically by the software. Line thickness indicates the strength of data support. See Tables I and II for protein names.
Discussion
Our previous study highlighted the benefits of combined treatment using the autophagy inhibitor, Lys05, together with IR on lung cancer cells. We demonstrated that autophagy is activated at an early stage (1 h after IR) and at a later stage (48 h after IR) is inhibited (9). However, the mechanisms regulating these processes remain unclear. In this respect, we performed a phosphoproteomic study to elucidate molecular mechanisms triggered by Lys05 treatment.
The GO analysis provided the first insight into the proteins involved in biological processes, molecular functions, and cellular compartments. Analyzing data in more detail, we identified proteins with differentially regulated phosphosites that take part in autophagy.
One hour after irradiation, we identified several proteins with significantly up- or down-regulated phosphosites. Interactions between these proteins suggest the activation of autophagy early after the combined treatment by Lys05 together with IR.
We identified KH domain-containing, RNA-binding, signal transduction-associated protein 1 (KHDRBS1) as a protein with the most significantly up-regulated phosphosite 1 h after irradiation. Once phosphorylated, KHDRBS1 functions as an adapter protein in signal transduction cascades (19). It is predominantly a nuclear protein, and its primary function is to regulate alternative splicing. It influences alternative splicing of the mTOR kinase (20) and plays a role as an adapter between the autophagic machinery and misfolded proteins (21). KHDRBS1 may serve as a regulatory protein in autophagy activation since its loss in liver cells markedly attenuated liver injury caused by autophagy deficiency (22).
Furthermore, we identified glycerol-3-phosphate acyltransferase 3 (GPAT3, previously known as AGPAT9) as a protein with the second most significantly up-regulated phosphosite. GPAT3 catalyzes the initial step of de novo triacylglycerol synthesis. It transfers the acyl-group from acyl-CoA and plays a significant role in glycerolipid and phospholipid synthesis (23). It also contributes to autophagosome formation by its biosynthetic activity (24), and its function is controlled by insulin-mediated phosphorylation (25). We identified protein GPAT3 to be phosphorylated on Ser68, which is one of the ‘known sites’, according to PhosphoSitePlus (www.phosphositeplus.org).
SQSTM1 was another protein that was substantially up-regulated 1 h after irradiation. SQSTM1 is an autophagosome cargo protein. It targets other proteins that bind to it for selective autophagy (26). We observed this protein to be phosphorylated on Ser272. Phosphorylation of SQSTM1 on Ser272 contributes to the activation of autophagy (27).
Similarly, proteins with down-regulated phosphosites contribute to the apparent activation of autophagy early after treatment. For example, 60S ribosomal export protein NMD3 (NMD3), a protein with the most significantly down-regulated phosphosite 1 h after IR, acts as an adapter for exportin 1 (XPO1) also known as chromosomal maintenance 1 (CRM1)-mediated export of the 60S ribosomal subunit (28). According to Wengrod et al., inhibition of NMD3 may induce autophagy, and the hyperactivation of NMD3 may abate it (29).
AKT1S1, another protein with a down-regulated phosphosite 1 h after IR, is a subunit of mammalian target of rapamycin complex 1 (mTORC1). It possesses a regulatory function at the intersection of the AKT serine/threonine kinase 1 (AKT1) and mTORC1 signaling pathway and regulates cell growth and survival (30,31). AKT1S1 is also an autophagy regulatory protein, which binds to regulatory associated protein of MTOR complex 1 (RAPTOR) in the mTORC1 complex. Phosphorylation of AKT1S1 by AKT causes its dissociation from RAPTOR, resulting in mTOR activation and suppression of autophagy (32). We identified AKT1S1 as having down-regulation of phosphorylation on Thr246, indicating enhanced autophagic activity. It is known that AKT can phosphorylate AKT1S1 near its C-terminus on Thr246. This phosphorylation appears to release its inhibitory effect on mTORC1 (33).
Furthermore, we identified La ribonucleoprotein domain family member 1 (LARP1), another protein tightly associated with mTOR machinery. LARP1 is a downstream substrate of mTORC1 and promotes the translation of specific classes of mRNAs. LARP1 regulates global protein synthesis, cell growth, and proliferation, as well as cell migration and invasion (34,35). With its ability to reversibly phosphorylate and dephosphorylate, we consider LARP1 to be a phosphorylation-sensitive molecular switch in the translation of some mRNAs as well as an essential regulator of mTORC1 (36). We identified LARP1 with down-regulation of phosphosite on Ser766. This phosphosite is reportedly dephosphorylated during autophagy (37).
Taken together, all the deregulations of phosphorylated proteins mentioned above contribute to an increased rate of autophagy. The key regulators of this process appear to be the AKT1S1 pathway—initial autophagy inducer and SQSTM1 pathway—a regulator of autophagosome formation together with other regulatory proteins such as LARP1, NMD3, and GPAT3 (see Figure 6).
On the other hand, 48 h after IR, we identified proteins with significantly up- or down-regulated phosphosites that contribute to the inhibition of autophagy.
One of these proteins, Ras/Rap GTPase-activating protein SynGAP (SYNGAP1), is a Ras GTPase-activating protein that not only is critical for proper synapse function, but also takes part in other signaling processes (38). Importantly, it is a binding partner of the protein ULK1 (39), which was also detected 48 h after IR. ULK1 is a serine/threonine-protein kinase involved in autophagy regulation. It acts upstream of phosphatidylinositol 3-kinase to regulate the formation of autophagophores (the precursors of autophagosomes). ULK1 takes part in regulatory feedback loops in autophagy. It acts both as a downstream effector and a negative regulator of mTORC1 and is activated via phosphorylation by AMPK (40). When activated, mTORC1 inhibits autophagy by phosphorylating both ULK1 and ATG13 while reducing ULK1 kinase activity (41,42). AMPK can also negatively regulate autophagy by phosphorylating ULK1 at Ser638, leading to reduced autophagy-related activity of ULK1 (18).
It seems that the ULK1–ATG13 pathway might be the key regulator of the late-stage inhibition of autophagy. ULK1 appears to be the crucial regulator of autophagy inhibition 48 h after irradiation (see Figure 7).
It is far beyond the extent of this article to describe in full detail all the observed alterations of phosphorylated proteins. Therefore, we outlined the most prominent ones and included an overview of all detected up- and down-regulated phosphosites in the supplementary material (Supplementary Tables I and II).
Conclusion
When performing the in-depth phosphoproteomic analysis, we expected to find autophagy somewhat inhibited early after irradiation. Instead, we found numerous deregulations of phosphorylated proteins leading to an increased rate of autophagy. We assume that we can attribute such an effect to IR. Later after irradiation, the effect of Lys05 prevailed, as we detected phosphorylation leading to reduced autophagic activity. These findings add to the conclusions of our previous work, which confirmed inhibited autophagy by several different methodological approaches. Moreover, we presume that it is ULK1 and its binding partners which play a crucial role in such inhibition.
This work contributes to emerging phosphoproteomic insights into autophagy-mediated global signaling in lung cancer cells, which might consequently facilitate the development of precision medicine therapeutics.
Conflicts of Interest
The Authors declare that they have no conflicts of interest.
Authors’ Contributions
M.O. and A.T. conceived the study and wrote the article; M.O. performed the phosphoproteomic analysis; L.C. contributed to the study design and reviewed the article; I.F. and J.K. performed mass spectrometric analysis and provided technical information; A.T. provided project administration and supervision. All Authors read and approved the article.
Acknowledgements
Lys05 was a kind gift of Dr. Ravi Amaravadi from the Perelman School of Medicine (University of Pennsylvania, PA, USA). The Authors are grateful to Ian McColl, MD, Ph.D. for assistance with the article.
Funding
This work was supported by the Ministry of Defense of the Czech Republic through the long-term organization development plan Medical Aspects of Weapons of Mass Destruction of the Faculty of Military Health Sciences, University of Defense in Brno.
All supplementary material is available at: http://dx.doi.org/10.17632/djmfr34hdn.1
References
- 1.The American Cancer Society Lung Cancer Statistics | How Common is Lung Cancer, 2019. Available at: https://www.cancer.org/cancer/lung-cancer/about/keystatistics.html [Last accessed on January 6, 2020]
- 2.Ueki N, Matsuo Y, Togashi Y, Kubo T, Shibuya K, Iizuka Y, Mizowaki T, Togashi K, Mishima M, Hiraoka M. Impact of pretreatment interstitial lung disease on radiation pneumonitis and survival after stereotactic body radiation therapy for lung cancer. J Thorac Oncol. 2015;10:116–125. doi: 10.1097/JTO.0000000000000359. PMID: 25376512. DOI: 10.1097/JTO.0000000000000359. [DOI] [PubMed] [Google Scholar]
- 3.Chaachouay H, Fehrenbacher B, Toulany M, Schaller M, Multhoff G, Rodemann HP. AMPK-independent autophagy promotes radioresistance of human tumor cells under clinical relevant hypoxia in vitro. Radiother Oncol. 2015;116:409–416. doi: 10.1016/j.radonc.2015.08.012. PMID: 26318663. DOI: 10.1016/j.radonc.2015.08.012. [DOI] [PubMed] [Google Scholar]
- 4.Dikic I, Elazar Z. Mechanism and medical implications of mammalian autophagy. Nat Rev Mol Cell Biol. 2018;19:349–364. doi: 10.1038/s41580-018-0003-4. PMID: 29618831. DOI: 10.1038/s41580-018-0003-4. [DOI] [PubMed] [Google Scholar]
- 5.Ondrej M, Cechakova L, Durisova K, Pejchal J, Tichy A. To live or let die: Unclear task of autophagy in the radio-sensitization battle. Radiother Oncol. 2016;119:265–275. doi: 10.1016/j.radonc.2016.02.028. PMID: 26993419. DOI: 10.1016/j.radonc.2016.02.028. [DOI] [PubMed] [Google Scholar]
- 6.Chen Y, Li X, Guo L, Wu X, He C, Zhang S, Xiao Y, Yang Y, Hao D. Combining radiation with autophagy inhibition enhances suppression of tumor growth and angiogenesis in esophageal cancer. Mol Med Rep. 2015;12:1645–1652. doi: 10.3892/mmr.2015.3623. PMID: 25891159. DOI: 10.3892/mmr.2015.3623. [DOI] [PMC free article] [PubMed] [Google Scholar]
- 7.Tao H, Qian P, Lu J, Guo Y, Zhu H, Wang F. Autophagy inhibition enhances radiosensitivity of ECA-109 cells via the mitochondrial apoptosis pathway. Int J Oncol. 2018;52:1853–1862. doi: 10.3892/ijo.2018.4349. PMID: 29620258. DOI: 10.3892/ijo.2018.4349. [DOI] [PMC free article] [PubMed] [Google Scholar]
- 8.Park JM, Tougeron D, Huang S, Okamoto K, Sinicrope FA. Beclin 1 and UVRAG confer protection from radiation-induced DNA damage and maintain centrosome stability in colorectal cancer cells. PloS One. 2014;9:e100819. doi: 10.1371/journal.pone.0100819. PMID: 24956373. DOI: 10.1371/journal.pone.0100819. [DOI] [PMC free article] [PubMed] [Google Scholar]
- 9.Cechakova L, Ondrej M, Pavlik V, Jost P, Cizkova D, Bezrouk A, Pejchal J, Amaravadi RK, Winkler JD, Tichy A. A potent autophagy inhibitor (Lys05) enhances the impact of ionizing radiation on human lung cancer cells H1299. Int J Mol Sci 20: 2019;pii:E5881. doi: 10.3390/ijms20235881. PMID: 31771188. DOI: 10.3390/ijms20235881. [DOI] [PMC free article] [PubMed] [Google Scholar]
- 10.McAfee Q, Zhang Z, Samanta A, Levi SM, Ma X-H, Piao S, Lynch JP, Uehara T, Sepulveda AR, Davis LE, Winkler JD, Amaravadi RK. Autophagy inhibitor Lys05 has single-agent antitumor activity and reproduces the phenotype of a genetic autophagy deficiency. Proc Natl Acad Sci USA. 2012;109:8253–8258. doi: 10.1073/pnas.1118193109. PMID: 22566612. DOI: 10.1073/pnas.1118193109. [DOI] [PMC free article] [PubMed] [Google Scholar]
- 11.Šalovská B, Fabrik I, Ďurišová K, Link M, Vávrová J, Řezáčová M, Tichý A. Radiosensitization of human leukemic HL-60 cells by ATR kinase inhibitor (VE-821): Phosphoproteomic analysis. Int J Mol Sci. 2014;15:12007–12026. doi: 10.3390/ijms150712007. PMID: 25003641. DOI: 10.3390/ijms150712007. [DOI] [PMC free article] [PubMed] [Google Scholar]
- 12.Bendall SC, Hughes C, Stewart MH, Doble B, Bhatia M, Lajoie GA. Prevention of amino acid conversion in SILAC experiments with embryonic stem cells. Mol Cell Proteomics. 2008;7:1587–1597. doi: 10.1074/mcp.M800113-MCP200. PMID: 18487603. DOI: 10.1074/mcp.M800113-MCP200. [DOI] [PMC free article] [PubMed] [Google Scholar]
- 13.Yeung Y-G, Stanley ER. Rapid detergent removal from peptide samples with ethyl acetate for mass spectrometry analysis. Curr Protoc Protein Sci. 2010;16:Unit 16.12. doi: 10.1002/0471140864.ps1612s59. PMID: 20155730. DOI: 10.1002/0471140864.ps1612s59. [DOI] [PMC free article] [PubMed] [Google Scholar]
- 14.Larsen MR, Thingholm TE, Jensen ON, Roepstorff P, Jørgensen TJD. Highly selective enrichment of phosphorylated peptides from peptide mixtures using titanium dioxide microcolumns. Mol Cell Proteomics. 2005;4:873–886. doi: 10.1074/mcp.T500007-MCP200. PMID: 15858219. DOI: 10.1074/mcp.T500007-MCP200. [DOI] [PubMed] [Google Scholar]
- 15.Cox J, Mann M. MaxQuant enables high peptide identification rates, individualized p.p.b.-range mass accuracies and proteome-wide protein quantification. Nat Biotechnol. 2008;26:1367–1372. doi: 10.1038/nbt.1511. PMID: 19029910. DOI: 10.1038/nbt.1511. [DOI] [PubMed] [Google Scholar]
- 16.Cox J, Neuhauser N, Michalski A, Scheltema RA, Olsen JV, Mann M. Andromeda: a peptide search engine integrated into the MaxQuant environment. J Proteome Res. 2011;10:1794–1805. doi: 10.1021/pr101065j. PMID: 21254760. DOI: 10.1021/pr101065j. [DOI] [PubMed] [Google Scholar]
- 17.Shang L, Wang X. AMPK and mTOR coordinate the regulation of ULK1 and mammalian autophagy initiation. Autophagy. 2011;7:924–926. doi: 10.4161/auto.7.8.15860. PMID: 21521945. DOI: 10.4161/auto.7.8.15860. [DOI] [PubMed] [Google Scholar]
- 18.Puente C, Hendrickson RC, Jiang X. Nutrient-regulated phosphorylation of ATG13 inhibits starvation-induced autophagy. J Biol Chem. 2016;291:6026–6035. doi: 10.1074/jbc.M115.689646. PMID: 26801615. DOI: 10.1074/jbc.M115.689646. [DOI] [PMC free article] [PubMed] [Google Scholar]
- 19.KHDRBS1 - KH domain-containing, RNA-binding, signal transduction-associated protein 1 - Homo sapiens (Human) - KHDRBS1 gene & protein. Available at: https://www.uniprot.org/uniprot/Q07666 [Last accessed on January 6, 2020]
- 20.Huot M-É, Vogel G, Zabarauskas A, Ngo CT-A, Coulombe-Huntington J, Majewski J, Richard S. The Sam68 STAR RNA-binding protein regulates mTOR alternative splicing during adipogenesis. Mol Cell. 2012;46:187–199. doi: 10.1016/j.molcel.2012.02.007. PMID: 22424772. DOI: 10.1016/j.molcel.2012.02.007. [DOI] [PubMed] [Google Scholar]
- 21.Chen Z, Fu Q, Shen B, Huang X, Wang K, He P, Li F, Zhang F, Shen H. Enhanced p62 expression triggers concomitant autophagy and apoptosis in a rat chronic spinal cord compression model. Mol Med Rep. 2014;9:2091–2096. doi: 10.3892/mmr.2014.2124. PMID: 24715058. DOI: 10.3892/mmr.2014.2124. [DOI] [PubMed] [Google Scholar]
- 22.Komatsu M, Waguri S, Koike M, Sou Y-S, Ueno T, Hara T, Mizushima N, Iwata J-I, Ezaki J, Murata S, Hamazaki J, Nishito Y, Iemura S-I, Natsume T, Yanagawa T, Uwayama J, Warabi E, Yoshida H, Ishii T, Kobayashi A, Yamamoto M, Yue Z, Uchiyama Y, Kominami E, Tanaka K. Homeostatic levels of p62 control cytoplasmic inclusion body formation in autophagy-deficient mice. Cell. 2007;131:1149–1163. doi: 10.1016/j.cell.2007.10.035. PMID: 18083104. DOI: 10.1016/j.cell.2007.10.035. [DOI] [PubMed] [Google Scholar]
- 23.GPAT3 - Glycerol-3-phosphate acyltransferase 3 - Homo sapiens (Human) - GPAT3 gene & protein. Available at: https://www.uniprot.org/uniprot/Q53EU6 [Last accessed on January 6, 2020]
- 24.Dupont N, Chauhan S, Arko-Mensah J, Castillo EF, Masedunskas A, Weigert R, Robenek H, Proikas-Cezanne T, Deretic V. Neutral lipid stores and lipase PNPLA5 contribute to autophagosome biogenesis. Curr Biol CB. 2014;24:609–620. doi: 10.1016/j.cub.2014.02.008. PMID: 24613307. DOI: 10.1016/j.cub.2014.02.008. [DOI] [PMC free article] [PubMed] [Google Scholar]
- 25.Shan D, Li J, Wu L, Li D, Hurov J, Tobin JF, Gimeno RE, Cao J. GPAT3 and GPAT4 are regulated by insulin-stimulated phosphorylation and play distinct roles in adipogenesis. J Lipid Res. 2010;51:1971–1981. doi: 10.1194/jlr.M006304. PMID: 20181984. DOI: 10.1194/jlr.M006304. [DOI] [PMC free article] [PubMed] [Google Scholar]
- 26.Cassidy LD, Narita M. Cell biology. GATA get a hold on senescence. Science. 2015;349:1448–1449. doi: 10.1126/science.aad2501. PMID: 26404812. DOI: 10.1126/science.aad2501. [DOI] [PubMed] [Google Scholar]
- 27.Matsumoto G, Wada K, Okuno M, Kurosawa M, Nukina N. Serine 403 phosphorylation of p62/SQSTM1 regulates selective autophagic clearance of ubiquitinated proteins. Mol Cell. 2011;44:279–289. doi: 10.1016/j.molcel.2011.07.039. PMID: 22017874. DOI: 10.1016/j.molcel.2011.07.039. [DOI] [PubMed] [Google Scholar]
- 28.NMD3 - 60S ribosomal export protein NMD3 - Homo sapiens (Human) - NMD3 gene & protein. Available at: https://www.uniprot.org/uniprot/Q96D46 [Last accessed on January 6, 2020]
- 29.Wengrod J, Martin L, Wang D, Frischmeyer-Guerrerio P, Dietz HC, Gardner LB. Inhibition of nonsense-mediated RNA decay activates autophagy. Mol Cell Biol. 2013;33:2128–2135. doi: 10.1128/MCB.00174-13. PMID: 23508110. DOI: 10.1128/MCB.00174-13. [DOI] [PMC free article] [PubMed] [Google Scholar]
- 30.AKT1S1 - Proline-rich AKT1 substrate 1 - Homo sapiens (Human) - AKT1S1 gene & protein. Available at: https://www.uniprot.org/uniprot/Q96B36 [Last accessed on January 6, 2020]
- 31.Nascimento EBM, Snel M, Guigas B, van der Zon GCM, Kriek J, Maassen JA, Jazet IM, Diamant M, Ouwens DM. Phosphorylation of PRAS40 on Thr246 by PKB/AKT facilitates efficient phosphorylation of Ser183 by mTORC1. Cell Signal. 2010;22:961–967. doi: 10.1016/j.cellsig.2010.02.002. PMID: 20138985. DOI: 10.1016/j.cellsig.2010.02.002. [DOI] [PubMed] [Google Scholar]
- 32.Sancak Y, Thoreen CC, Peterson TR, Lindquist RA, Kang SA, Spooner E, Carr SA, Sabatini DM. PRAS40 is an insulin-regulated inhibitor of the mTORC1 protein kinase. Mol Cell. 2007;25:903–915. doi: 10.1016/j.molcel.2007.03.003. PMID: 17386266. DOI: 10.1016/j.molcel.2007.03.003. [DOI] [PubMed] [Google Scholar]
- 33.Yang Q, Guan K-L. Expanding mTOR signaling. Cell Res. 2007;17:666–681. doi: 10.1038/cr.2007.64. PMID: 17680028. DOI: 10.1038/cr.2007.64. [DOI] [PubMed] [Google Scholar]
- 34.Tcherkezian J, Cargnello M, Romeo Y, Huttlin EL, Lavoie G, Gygi SP, Roux PP. Proteomic analysis of cap-dependent translation identifies LARP1 as a key regulator of 5’TOP mRNA translation. Genes Dev. 2014;28:357–371. doi: 10.1101/gad.231407.113. PMID: 24532714. DOI: 10.1101/gad.231407.113. [DOI] [PMC free article] [PubMed] [Google Scholar]
- 35.Mura M, Hopkins TG, Michael T, Abd-Latip N, Weir J, Aboagye E, Mauri F, Jameson C, Sturge J, Gabra H, Bushell M, Willis AE, Curry E, Blagden SP. LARP1 post-transcriptionally regulates mTOR and contributes to cancer progression. Oncogene. 2015;34:5025–5036. doi: 10.1038/onc.2014.428. PMID: 26921696. DOI: 10.1038/onc.2014.428. PMID: 25531318. [DOI] [PMC free article] [PubMed] [Google Scholar]
- 36.Hong S, Freeberg MA, Han T, Kamath A, Yao Y, Fukuda T, Suzuki T, Kim JK, Inoki K. LARP1 functions as a molecular switch for mTORC1-mediated translation of an essential class of mRNAs. eLife. 2017;6:e25237. doi: 10.7554/eLife.25237. PMID: 28650797. DOI: 10.7554/eLife.25237. [DOI] [PMC free article] [PubMed] [Google Scholar]
- 37.Casado P, Bilanges B, Rajeeve V, Vanhaesebroeck B, Cutillas PR. Environmental stress affects the activity of metabolic and growth factor signaling networks and induces autophagy markers in MCF7 breast cancer cells. Mol Cell Proteomics. 2014;13:836–848. doi: 10.1074/mcp.M113.034751. PMID: 24425749. DOI: 10.1074/mcp.M113.034751. [DOI] [PMC free article] [PubMed] [Google Scholar]
- 38.SYNGAP1 - Ras/Rap GTPase-activating protein SynGAP -Homo sapiens (Human) - SYNGAP1 gene & protein. Availableat: https://www.uniprot.org/uniprot/Q96PV0 [Last accessed on January 6, 2020]
- 39.Lee JW, Park S, Takahashi Y, Wang H-G. The association of AMPK with ULK1 regulates autophagy. PloS One. 2010;5:e15394. doi: 10.1371/journal.pone.0015394. PMID: 21072212. DOI: 10.1371/journal.pone.0015394. [DOI] [PMC free article] [PubMed] [Google Scholar]
- 40.ULK1 - Serine/threonine-protein kinase ULK1 - Homo sapiens (Human) - ULK1 gene & protein. Available at: https://www.uniprot.org/uniprot/O75385 [Last accessed on January 6, 2020]
- 41.Alers S, Löffler AS, Wesselborg S, Stork B. The incredible ULKs. Cell Commun Signal CCS. 2012;10:7. doi: 10.1186/1478-811X-10-7. PMID: 22413737. DOI: 10.1186/1478-811X-10-7. [DOI] [PMC free article] [PubMed] [Google Scholar]
- 42.Lin MG, Hurley JH. Structure and function of the ULK1 complex in autophagy. Curr Opin Cell Biol. 2016;39:61–68. doi: 10.1016/j.ceb.2016.02.010. DOI: 10.1016/j.ceb.2016.02.010. [DOI] [PMC free article] [PubMed] [Google Scholar]


