

Abstract
Gut-brain connections monitor the intestinal tissue and its microbial and dietary content1, regulating both intestinal physiological functions such as nutrient absorption and motility2,3, and brain–wired feeding behaviour2. It is therefore plausible that circuits exist to detect gut microbes and relay this information to central nervous system (CNS) areas that, in turn, regulate gut physiology4. We characterized the influence of the microbiota on enteric–associated neurons (EAN) by combining gnotobiotic mouse models with transcriptomics, circuit–tracing methods, and functional manipulations. We found that the gut microbiome modulates gut–extrinsic sympathetic neurons; while microbiota depletion led to increased cFos expression, colonization of germ-free mice with short-chain fatty acid–producing bacteria suppressed cFos expression in the gut sympathetic ganglia. Chemogenetic manipulations, translational profiling, and anterograde tracing identified a subset of distal intestine-projecting vagal neurons positioned to play an afferent role in microbiota–mediated modulation of gut sympathetic neurons. Retrograde polysynaptic neuronal tracing from the intestinal wall identified brainstem sensory nuclei activated during microbial depletion, as well as efferent sympathetic premotor glutamatergic neurons that regulate gastrointestinal transit. These results reveal microbiota–dependent control of gut extrinsic sympathetic activation through a gut-brain circuit.
Extrinsic enteric–associated neurons (eEAN), comprised of sensory afferents and autonomic efferents, are equipped to sense multiple areas of the intestine simultaneously, transmit information to other tissues, and complement intrinsic EANs (iEAN) in the control of gut function5. We sought to better characterize the connections of eEAN and whether their activity or gene expression is influenced by the gut microbiota. To identify the location of eEAN cell bodies, we injected a fluorescent retrograde tracer, cholera toxin beta subunit (CTB), into the wall of different intestinal segments, and dissected extrinsic ganglia that project to the gut, specifically the sensory nodose ganglion (NG) and dorsal root ganglia (DRG), and the sympathetic celiac–superior mesenteric (CG-SMG) ganglion (Fig. 1a–c, Extended Data Fig. 1a–m). Individual CTB tracing of intestinal regions highlighted left versus right nodose bias, and an increasing density of sympathetic neuronal innervation moving from proximal to distal intestine. Simultaneous CTB tracing from different gut regions illustrated that sensory and sympathetic innervation of these anatomically distinct intestinal regions is mediated by non-overlapping peripheral neuronal cell populations (Fig. 1d, Extended Data Fig. 1n–q). These results highlight the compartmentalization of both sensory and effector eEAN projecting to the intestine.
Fig. 1 |. Gut-associated sympathetic neurons are activated in the absence of a microbiota.

a, (Left) Scheme depicting retrograde CTB555 or CTB488 tracing from intestinal regions to the CG-SMG, left (L) and right (R) NG of C57BL/6J SPF mice. (Right) Images representative of tracing from duodenum (n=5), ileum (n=6), and colon (n=5). b, c, Number of CTB+ neurons per (b) L-NG and R-NG or (c) CG-SMG retrograde labelled from the duodenum (n=3), ileum (n=4), and proximal colon (n=4). d, Triple CTB tracing in the CG-SMG and NG with CTB488 (duodenum), CTB555 (ileum), and CTB647 (colon) of C57BL6/J SPF mice. Images representative of n=2. e, f, Volcano plots of differentially expressed genes in the NG (e) or CG-SMG (f) of Snap25RiboTag GF and SPF mice. g, h, Gene ontology pathways, enriched in Snap25RiboTag GF vs SPF NG (g) or CG-SMG (h). i, Immunofluorescence images of the CG-SMG from C57BL/6J GF and SPF mice using anti-cFos antibody. White arrows indicate cFos+ nuclei. Images representative of GF (n=9) and SPF mice kept on GF diet (n=7). j, Numbers of cFos+ neurons in the CG-SMG of C57BL/6J GF mice from Rockefeller (n=9) or Mount Sinai (n=10) animal facilities, compared to SPF mice kept on GF diet (n=7) or normal chow (n=5), and Taconic SPF mice kept on normal chow (n=5). a, d, i, Scale bars = 50μm. b, c, j, Mean ± s.d. b, c, Two-tailed unpaired t-test. e-h, Number (n) of independent biological samples analysed are indicated in parentheses. Red/blue dots = log2 fold change > 0.5. Italicized parentheses = log2 fold change > 1. padj = two-tailed Benjamini and Hochberg test p-value of two-tailed Wald test p-value < 0.05. g, h, padj = two-tailed Benjamini and Hochberg test p-value of two-tailed Wald test p-value < 0.05. Dashed lines represent threshold of significance (1.3) as calculated by one-tailed Fisher’s test with an elimination algorithm. j, One-way ANOVA with Tukey multiple comparisons.
We characterized microbial-mediated eEAN gene expression changes by transcriptionally profiling ganglia identified by CTB tracing using translating ribosomal affinity purification (TRAP)6. We interbred pan–neuronal Snap25Cre with Rpl22lsl-HA (RiboTag) mice (Extended Data Fig. 2a, b) and performed TRAP-seq of the NG, thoracic 9 DRG, and CG-SMG isolated from specific pathogen-free (SPF) and germ-free (GF) Snap25RiboTag mice (Extended Data Fig. 2c–h). We did not observe significant changes in expression of actively–translated genes in DRG between SPF and GF groups (Extended Data Fig. 2i). Gene ontology (GO) analysis of the NG suggested an enrichment for genes associated with synaptic signalling and neuronal activation in GF mice (Fig. 1e, g). Additionally, the CG-SMG from GF animals displayed enriched GO pathways for plasticity and signalling with significantly higher transcript levels of Fos (Fig. 1f, h), a neuronal immediate–early gene and indirect marker for neuronal activity7. Immunofluorescence analysis confirmed that CG-SMG isolated from GF mice displayed significantly more cFos+ neuronal nuclei than their SPF mice counterparts (Fig. 1i, j, Extended Data Fig. 2j–l). These data indicate that absence of a microbiota results in elevated levels of gut–extrinsic sympathetic activity.
To address whether specific microbes could mediate tonic suppression of CG-SMG neurons, we utilized multiple microbial manipulation strategies. Faecal transfer from SPF donors into GF mice restored CG-SMG neuronal cFos to levels comparable to SPF conditions, suggesting that microbiota can suppress gut–extrinsic sympathetic neurons (Fig. 2a). The mere presence of live bacteria was not enough to suppress gut–projecting sympathetic activation, as mono-colonization of GF mice with segmented filamentous bacteria (SFB), Akkermansia muciniphilia or Bacteroides fragilis did not result in reduced cFos levels in the CG-SMG, while colonization of GF mice with defined bacterial consortia led to SPF levels (Fig. 2b, c). Conversely, microbiota depletion of SPF mice using broad-spectrum antibiotics resulted in increased cFos+ neurons in the CG-SMG (Fig. 2d, e). Treatment with individual antibiotics was sufficient to drive sympathetic cFos, overall suggesting that specific subsets of bacteria were able to suppress cFos activation (Fig. 2f). Additionally, a single oral gavage of streptomycin resulted in CG-SMG neuronal activation at 12h (not shown) and 24h post-gavage, returning to basal levels five days post-treatment (Fig. 2g, Extended Data Fig. 2m, n). To address whether activated sympathetic neurons project to the intestine, we injected fluorescent CTB in the ileum of broad-spectrum antibiotic–treated FosGFP mice. We observed extensive colocalization between CTB+ (red) and cFos+ (green) neurons in the CG-SMG (Fig. 2h), reinforcing the possibility that sympathetic neurons activated upon microbial depletion project to the intestine, while not excluding projections to other visceral tissues connected to the CG-SMG. Finally, we found that blockade of catecholamine release in microbial-depleted mice rescued changes in their gastrointestinal motility, suggesting that increased sympathetic activity is partly responsible for the motility deficits observed in these mice (Fig. 2i–l). The above results indicate that specific microbes can suppress cFos expression in gut sympathetic neurons, and that gut-specific sympathetic activity can reflect shifts in the gut microbial community.
Fig. 2 |. Dysbiosis triggers gut sympathetic activation.

a-d, Number of cFos+ neurons in the CG-SMG of (a) C57BL/6J GF mice (n=6) and GF mice colonized with faeces from SPF mice (GF-FC, n=8) 2 weeks prior to analysis, (b) C57BL/6J SFB (n=5), A. muciniphilia- (n=3) or B. fragilis- (n=5) monocolonized mice, and OligoMM12- (n=4) or ASF (n=3) consortia-colonized mice, (c) C57BL/6J GF mice (n=3) and GF mice colonized with Clostridium spp. consortia (n=4) from Weill Cornell animal facilities, (d) C57BL/6J SPF mice treated for 2 weeks with vancomycin, ampicillin, metronidazole, and neomycin (VAMN) (n=12) in drinking water as compared to Splenda (n=6) and water (n=5) treated mice. e, Immunofluorescence of the CG-SMG from C57BL/6J SPF mice treated with VAMN or Splenda, using anti-cFos antibody. Images representative of n=6 ganglia. f, g, Number of cFos+ neurons in the CG-SMG in (f) C57BL/6J SPF mice following 2 weeks of single antibiotic (metronidazole: n=10, neomycin: n=10, ampicillin: n=10, vancomycin: n=15) or Splenda (n=5) treatment, (g) C57BL/6J SPF mice 24 hours post streptomycin (strep, n=11) or PBS (n=6), BALBc/J SPF mice 24 hours post strep (n=6) or PBS: n = 4), CBA/J SPF mice 24 hours post strep (n=5) or PBS (n=5), C57BL/6J SPF mice 5 days post strep (n=4). h, (Left) Scheme for (right) immunofluorescence images of the CG-SMG from FosGFP SPF mice treated with VAMN or water for 2 weeks, with CTB555 injected into the ileum. i-l, Gastrointestinal transit time in C57BL/6J SPF mice treated with (i) Splenda (n=5) or VAMN (n=5), (j) VAMN with saline (n=10) or guanethidine, (k) strep (n=12) or PBS (n=13), (l) strep with saline (n=10) or guanethidine (n=10). e, h, Scale bars = 50μm. a-d, f, g, i-l, Mean ± s.d. a, c, i-l, Two-tailed unpaired t-test. b, d, f, g One-way ANOVA with Tukey’s multiple comparisons. b, q, Dashed line indicates the average number (334) of cFos+ neurons in GF mice. i-l, Dashed line indicates maximum time allowed per animal for motility measurement.
We observed that gnotobiotic manipulations resulted in suppression of CG-SMG neurons when defined microbial consortia, known to restore levels of SCFAs, were introduced8,9. Mass spectrometric quantification of SCFAs in the ceca of mice confirmed that specific antibiotics eliminated, and GF colonization rescued the levels of butyrate, propionate, and acetate to various degrees (Extended Data Fig. 3a–f). Cecum size did not correlate with sympathetic activation, suggesting that mechanosensation may not play a major role in the context of microbial depletion although acute distension can induce sympathetic activation (Extended Data Fig. 3g–i). In contrast to the lack of correlation between enteric infection–induced cFos10 and SCFA levels, in each of the gnotobiotic manipulations above, luminal SCFA levels correlated with the number of cFos+ neurons in the CG-SMG (Extended Data Fig. 3j–l). Thus, we tested whether supplementation of SCFAs in microbiota–depleted mice restores cFos levels in their CG-SMG. Administration of exogenous butyrate, acetate, and propionate in the drinking water suppressed streptomycin–induced cFos (Extended Data Fig. 3m). Prior studies suggested that SCFAs can cross the blood-brain barrier11; however, intra-cerebroventricular infusion of SCFAs did not suppress streptomycin-induced cFos in the CG-SMG (Extended Data Fig. 3n). Moreover, administration of tributyrin, a butyrate pro-drug12, was sufficient to suppress cFos expression in CG-SMG neurons of both GF mice and SPF mice treated with streptomycin, with no impact on cecum weight (Extended Data Fig.3 o–s). Thus, the ability of SCFAs to suppress sympathetic cFos is most likely mediated by processes in the periphery. SCFAs can modulate target cells via activation of G protein-coupled receptors including GPR41, 43 or 109A, inhibition of histone deacetylases, or by acting as an energy substrate13. Gpr41–/– mice, but not additional SCFA receptor-deficient strains analysed, showed a mild yet significant increase in the number of cFos+ neurons in the CG-SMG (Extended Data Fig. 3t–v), suggesting a potential role for GPR41, expressed by IECs, iEAN, and eEAN14, in modulating gut sympathetic ganglia. In addition to changes in SCFA levels, microbiota–depleted mice have increased intestinal levels of conjugated bile acids and decreased levels of unconjugated bile acids15. While a bile acid sequestrant, known to boost bile acid receptor agonist levels in the distal intestine16, significantly induced CG-SMG cFos in untreated SPF mice, the loss of all intestinal bile acids by bile duct cauterization led to a loss of streptomycin induced cFos, indicating that other microbiota-modulated metabolites also play a role in sympathetic regulation (Extended Data Fig. 4a, b). Furthermore, investigation of additional microbe-modulated epithelial cell factors revealed that GLP-1 and PYY can modulate sympathetic activity and gastrointestinal motility (Supplementary Information 1, Extended Data Fig. 4c–m). Overall, the above results identify SCFAs and additional gut–related metabolites or humoral factors as physiological modulators of gut sympathetic neuronal activation.
We investigated the neuronal population(s), or circuits, upstream of the CG-SMG that could be involved in driving sympathetic activity upon microbial depletion. Our multiple analyses did not support a role for direct sensing of microbial depletion by CG-SMG sympathetic neurons, nor for viscerofugal neurons modulating in gut sympathetic activity (Supplementary Information 2, Extended Data Fig. 5a–t, Supplementary Video 1–2). Fasting of antibiotic–treated or GF mice resulted in a significant reduction in CG-SMG activation, further pointing to a CNS–dependent circuit17. (Extended Data Fig. 6a–c). We thus investigated relevant sympathetic premotor areas in the brainstem by injecting mRFP1-expressing pseudorabies virus PRV-614 into the ileum or colon of SPF mice (Extended Data Fig. 6d–j, Supplementary Video 3–5). ClearMap analysis of the brains at day 4 post-injection of PRV-RFP by AdipoClear tissue clearing18 identified several brainstem nuclei polysynaptically connected to the intestine (Fig. 3a–c, Extended Data Fig. 6k, Supplementary Video 6). Search of the Allen Brain Atlas in situ hybridization database pointed to inhibitory GABAergic neurons and excitatory glutamatergic neurons as possible populations involved in the modulation of gut sympathetic neurons. Injection of PRV-RFP into the ileum of Slc32a1L10-GFP (VGAT: inhibitory) and Slc17a6L10-GFP (VGLUT2: excitatory) mice revealed extensive colocalization of RFP+/GFP+ neurons, with a majority of gigantocellular (Gi) neurons identified as VGAT+, and lateral paragigantocellular nucleus/rostral ventrolateral medulla (LPGi/RVLM) neurons identified as VGLUT2+ respectively with a minor contribution from other neurotransmitters (Fig. 3d–g, Extended Data Fig. 6l, m). Dual PRV tracing from different intestinal segments indicated that a majority of neurons in each of these brainstem areas were connected to multiple segments of the intestine (Fig. 3h, Extended Data Fig. 6n). These experiments define a common set of efferent premotor brainstem neurons polysynaptically connected to different regions of the intestine that may control gut–sympathetic activity.
Fig. 3 |. Sympathetic pre-motor mapping, control of CG-SMG neurons, and intestinal motility.
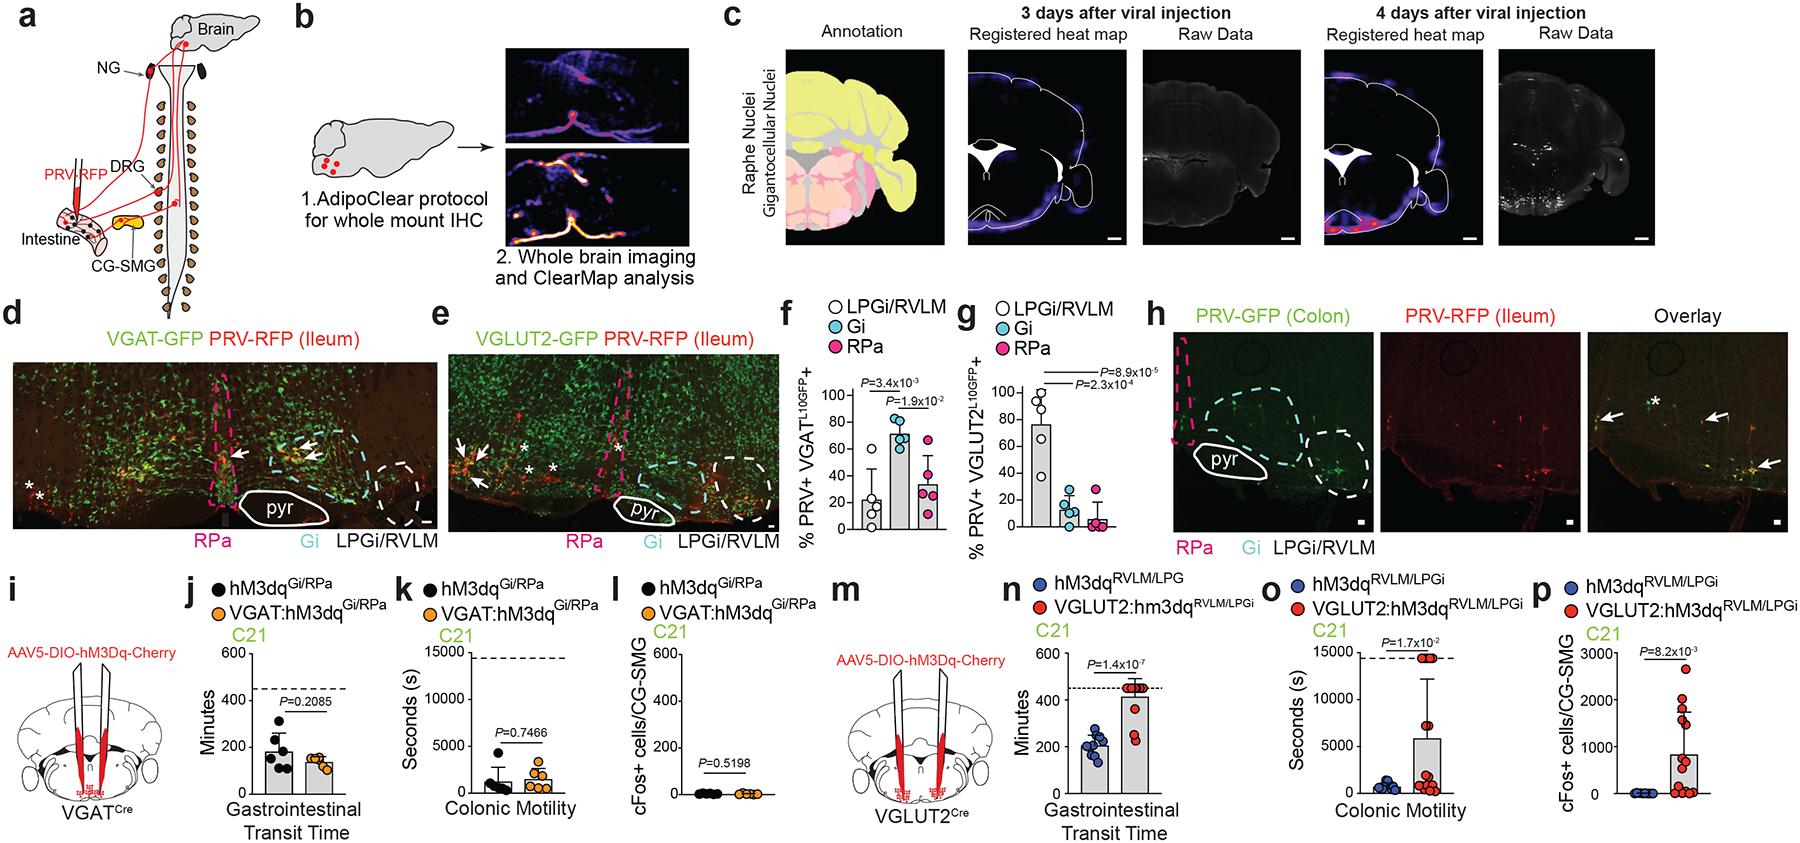
a, Scheme representing injection of PRV into the intestine for multisynaptic tracing (for c-k). b, Scheme representing tissue clearing followed by ClearMap analysis. c, ClearMap analysis of PRV-RFP injection into the ileum of C57BL/6J SPF mice at days 3 and 4 post-injection showing raphe/gigantocellular nuclei. Scale bar = 1mm. Images representative of n= 3 mice. d, e, Immunofluorescence images of the brainstem from (d) VGATL10GFP or (e) VGLUT2L10GFP mice 4 days post PRV-RFP injection into the ileum. Images representative of n=5 mice. pyr = pyramidal tract, RPa = raphe pallidus. f, g, Quantification of (f) PRV+ VGATL10GFP+ or (g) PRV+ VGLUT2L10GFP+ neurons in RPa, Gi, and LPGi/RVLM of mice in d and e, respectively. h, Immunofluorescence images of the brainstem from C57BL/6J SPF mice 4 days post injection of PRV-GFP (duodenum) and PRV-RFP (ileum). Images representative of n=3 mice. i, m, Scheme representing the injection of AAV5-DIO-hSyn1-hM3Dq-mCherry into the (i) Gi/RPa of VGATCre or into the (m) LPGi/RVLM of VGLUT2Cre SPF mice. j-l, n-p, Gastrointestinal transit time (j, n), colonic motility (k, o) and number of cFos+ neurons in the CG-SMG (l, p) of VGAT:hM3DqGi/RPa (n=6) or control (n=6) and VGLUT2:hM3DqLPGi/RVLM (n=14) or control (n=10) mice treated with 1mg/kg C21. Dashed line indicates maximum time allowed per animal for motility measurement. d, e, h, Scale bars = 50μm. d, e, h, Relevant brainstem regions are highlighted. Arrows indicate GFP+ RFP+ cells and asterisks indicate RFP+ GFP- cells. f, g, j-l, n-p, Mean ± s.d. j-l, n-p, Two-tailed unpaired t-test. f, g, One-way ANOVA with Tukey’s multiple comparisons.
Gut sympathetic innervation is involved in the control of blood flow, gut motility and epithelial secretion19. Consistent with a possible role for the premotor brainstem nuclei identified above in the regulation of gut sympathetic activity, we observed elevated cFos in both RPa and LPGi/RVLM neurons in GF mice (Extended Data Fig. 7a), which are known to display gut dysmotility20. To identify and permanently label recently-activated neurons following antibiotic treatment, we combined FosTRAP2:tdTomato mouse plasticity mapping21 and fluorescent PRV injection into the proximal colon, labelling gut–projecting neurons. Consistent with the increase in cFos, we observed an increase in the percentage of gut–connected (PRV+) TRAP+ cells in the LPGi/RVLM of these mice (Extended Data Fig. 7b). To directly determine whether these brainstem populations modulate gut–sympathetic activity, we bilaterally injected excitatory Designer Receptors Exclusively Activated by Designer Drugs (DREADD) AAV5-DIO-hSyn-hM3Dq-mCherry into the Gi or the LPGi/RVLM of VGATCre and VGLUT2Cre mice, respectively (Extended Data Fig. 7c). Administration of the DREADD ligand Compound 21 (C21) to wild-type or (Gi)VGAT mice did not affect baseline motility measurements, but significantly slowed intestinal transit and faecal pellet output in (LPGi/RVLM)VGLUT2 mice, with a corresponding increase in CG-SMG cFos in (LPGi/RVLM)VGLUT2 mice (Fig. 3i–p, Extended Data Fig. 7d–h). These findings demonstrate that glutamatergic LPGi/RVLM brainstem neurons are capable of driving gut sympathetic activity, which in turn can slow gastrointestinal transit.
Examination of the ClearMap data four days post PRV injection revealed additional brainstem regions previously shown to connect to the stomach22 and rectum23, specifically the dorso-vagal complex including the dorsal motor nucleus of the vagus (DMV), nucleus tractus solitarius (NTS) and area postrema (AP) (Extended Data Fig. 8a–d). Previous studies demonstrated that the NTS and AP can directly integrate gut sensory information from vagal sensory neurons or circulating factors2 and that these nuclei connect to the LPGi/RVLM24. Indeed, following streptomycin treatment, we observed a significant increase in cFos expression in both NTS and AP (Fig. 4a, Extended Data Fig. 8e). These areas also displayed high levels of cFos in GF mice and FosTRAP2:tdTomato treated with streptomycin, further suggesting their functional relevance (Extended Data Fig. 8f–h). Furthermore, tributyrin administration to streptomycin–treated mice resulted in suppression of cFos levels in the AP, while levels in the NTS remained elevated (Extended Data Fig. 8i, j), suggesting the AP as a potential distal sensory hub for intestinal SCFAs, although additional SCFAs and unknown visceral signals might be sensed in the NTS during dysbiosis or microbial depletion. These results characterize a set of brainstem sensory nuclei tuned to detect changes in the gut microbiota or metabolites thereof.
Fig. 4 |. Activation markers change upon microbial depletion in brainstem sensory nuclei connected to gut-projecting vagal afferents.

a, Number of cFos+ neurons in the AP, NTS and NTS-SolG of C57BL/6J SPF mice 24 hours post oral gavage with PBS (n=9) or streptomycin (strep) (n=9). b-d, Number of cFos+ neurons in the CG-SMG of (b) SNShM4Di (n=6) or control (n=4) SPF mice 6 hours post Compound 21 (10mg/kg) injection, (c) resiniferatoxin-treated C57BL/6J SPF mice 24 hours post strep (n=5 ganglia) or PBS (n=5 ganglia), and (d) Phox2bbhM4Di (n=5) or control (n=6) mice 4 hours post injection with 10mg/kg Compound 21. e,f, Volcano plot of differentially expressed genes from the NG of SNSRiboTag versus (e) AvilRiboTag or (f) Nav1.8RiboTag mice. g, RNAscope in situ hybridization images of the R-NG for Scn5a (Nav1.5) (red) and immunofluorescence from C57BL/6J SPF mice injected with CTB488 into the proximal colon. White arrows point to CTB+ Scn5a+ cells. Images representative of n=2 NG. h, (Left) Scheme for (right) immunofluorescence images of the NG from C57BL/6J SPF mice after PRV-GFP injection into the brainstem (1) or sdVx mice in the proximal colon (2). Mice in (2) received concomitant CTB594 injection in the proximal colon. Outline highlights NG. Images representative of n=3 ganglia. i, j, Immunofluorescence cleared-tissue images of the proximal colon (i) or the distal ileum (j) of mice AAV9-Syn-ChrimsonR-tdTomato injection into the R-NG (left 1x and right 4x zoom). Scale bars = 500μm (left) and 250μm (right). Images representative of n=3 from different mice. g, h, Scale bars = 50μm. a-d, Mean ± s.d. a-d, Two-tailed unpaired t-test. e,f, Number (n) of independent biological samples analysed are indicated in parentheses at top. padj = two-tailed Benjamini and Hochberg test p-value of two-sided Wald test p-value < 0.05.
The increased cFos expression in the NTS/AP upon microbial depletion suggests a functional role for afferent sensory neurons in the regulation of gut sympathetic activity. Extrinsic neuronal sensing at the intestinal epithelium, mucosa, and muscularis is primarily carried out by sensory afferents in the NG and DRG25, both also identified by our retrograde strategies described above. To target NG or DRG sensory activity we first crossed SNSCre with inhibitory hM4Di (Rosa26lsl-hM4Di) mice (Extended Data Fig. 9a, b, Supplemental Table 1). We reasoned that if afferent eEAN were involved in this circuit, administration of C21 to SNShM4Di mice to modulate sensory eEAN activity might functionally phenocopy the loss of microbial signals. Indeed, SNShM4Di mice displayed a significant activation of CG-SMG neurons upon administration of C21 (Fig. 4b). To determine whether NG alone or combined NG-DRG inhibition was responsible for this phenotype, we first utilized chemical and genetic ablation of gut–projecting TRPV1+ afferent neurons and found that it did not prevent antibiotic–induced cFos expression in the CG-SMG nor induce cFos in untreated SPF mice, suggesting that sensory DRG neurons do not play a major role in this circuit activated during microbial depletion (Fig. 4c, Extended Data Fig. 9c). Next, we crossed Rosa26lsl-hM4Di with Phox2bCre mice, targeting the NG, DMV, and a small population of iEAN, while avoiding recombination of DRG neurons26 (Extended Data Fig 9a, b, Supplemental Table 1). Injection of C21 into Phox2bhM4Di mice also led to a marked increase in the number of cFos+ cells in the CG-SMG (Fig. 4d). Because both SNShM4Di and Phox2bhM4Di also target a population of CG-SMG neurons, we performed selective chemogenetic manipulation of CG-SMG neurons directly, which ruled out possible hM4Di-mediated activation (Supplementary Information 3, Extended Data Fig. 9d–g). Of note, TRAP-seq analysis of the NG from SNS mice with NG from additional pan-sensory Cre lines that failed to activate CG-SMG neurons (AvilhM4Di and Nav1.8hM4Di) revealed a significant enrichment in the gene Scn5a (Nav1.5) in the NG of SNSCre targeted mice (Fig. 4e, f and Extended Data Fig. 9h, i). By coupling in situ hybridization with distal intestinal retrograde tracing, we confirmed that a proportion of distal gut-projecting NG neurons are indeed Nav1.5+ (Fig. 4g, Extended Data Fig. 9j–l). These chemogenetic, tracing, TRAP and ablation experiments indicate that modulation of specific vagal afferents is sufficient to drive gut sympathetic activity.
To address whether vagal modulation can activate sensory brainstem nuclei identified above, we treated SNShM4Di and Phox2bhM4Di mice with C21, which resulted in significant increase in cFos levels in the NTS and AP (Extended Data Fig. 10a, b). We were unable to surgically assess the requirement of vagal sensory input to these areas, as sdVx per se led to a significant increase in NTS/AP cFos (Extended Data Fig. 10c, d). Nevertheless, bilateral injection of fluorescent PRV into the LPGi/RVLM confirmed that both connect to the NG. Additionally, injection of fluorescent PRV into the wall of the colon of sdVx mice resulted in significant labelling of the left and right NG, with a bias towards right NG labelling, mirroring the trend observed with CTB tracing from the distal intestine (Fig. 4h, Extended Data Fig. 10e–g). Finally, visualization of vagal afferent projections27,28 revealed dense labelling of neuronal processes in the distal intestine, suggesting that NG sensory afferent neurons project fibres to sites of high microbial load or SCFA concentration (Fig. 4i–j, Extended Data Fig. 10h–k and Supplementary Video 7–11). Overall, our results identify a gut-brain-gut circuit whereby distinct microbes and microbial metabolites modulate activation of gut sympathetic neurons and brainstem sensory nuclei capable of integrating gut-specific stimuli (Extended Data Fig. 10l).
The functional, circuit and gene expression–based studies presented here suggest that EAN detection of microbes, or their metabolites, either directly or indirectly via epithelial cells, is a core sensory system whereby alterations in microbial composition is sufficient to significantly activate gut–projecting neurons. Additional CG-SMG targets such as the spleen, pancreas, and liver may also be regulated by the microbiota with conceivable impact on systemic immunity and metabolism. Furthermore, sympathetic signalling can impact gene transcription in a variety of cell targets found in the intestine and elsewhere, including gut–resident macrophages and innate lymphoid cells10,29,30. We identified multiple potential microbiota–derived signals that can modulate gut sympathetic activity and neuronal populations synaptically connected to the gut. In light of our findings, further characterization of microbial regulation of the autonomic nervous system, and additional circuits that integrate microbial signals, may be key for understanding the regulation of intestinal motility, visceral pain, enteric immunity, and systemic disorders related to the gut–brain axis – knowledge essential for defining therapeutic strategies.
Methods
Mice.
Mice were housed in a 12hr light-dark cycle with ad libitum access to food and water. Wild-type mice used: C57BL/6 (C57BL/6J, Jackson #000664 or C57BL/6NTac, Taconic #B6-M/F), CBA/J (Jackson #000656), BALB/cJ (Jackson #000651). Transgenic mice used: FosGFP (B6.Cg-Tg(Fos/EGFP)1–3Brth, Jackson #014135), RiboTag (B6N.129-Rpl22tm1.1Psam, Jackson #011029), Snap25cre (B6;129S-Snap25tm2.1(cre)Hze, Jackson #023525), Rosa26lsl-hM4Di (B6N.129-Gt(ROSA)26Sortm1(CAG-CHRM4*,-mCitrine)Ute, Jackson #026219), Rosa26lsl-tdTomato (B6.Cg-Gt(ROSA)26Sortm14(CAG-tdTomato)Hze, Jackson #007914), Vgatcre (Slc32a1tm2(cre)Lowl, Jackson #016962), Chatcre (B6;129S6-Chattm2(cre)Lowl, Jackson #006410). SNScre (Tg(Scn10acre)1Rkun, gift of R. Kuhner), Nav1.8cre (Scn10atm2(cre)Jnw, gift of J. Wood), Vgatcre (Slc32a1tm2(cre)Lowl, Jackson #016962), AdvillinCreERT2 (B6.Cg-Tg(Avil-icre/ERT2)AJwo/J Jackon # 026516), Vglut2cre (Slc17a6tm2(cre)Lowl/J, Jackson #016963), Glp1rcre (Glp1rtm1.1(cre)Lbrl/J, Jackson #029283), Phox2bcre (B6(Cg)-Tg(Phox2b-cre)3Jke/J, Jackson #016223), VillincreERT2 (Tg(Vil-cre/ERT2)23Syr), FosTRAP2 (Fostm2.1(icre/ERT2)Luo/J, Jackson #030323) Tph1flox (Tph1tm1Kry, gift of G. Karsenty), Htr3aCre (Gift of N. Heintz), Glp1rtm1Ddr or Glp1r–/– (gift of D. Drucker and generously provided by J. Ayala), Gpr43–/– (Gift of N. Arpaia), Gpr43–/–/Gpr109a–/– (gift of S. Mehandru), Gpr41–/– (gift of J. Gordon and M. Yanagisawa, generously provided by J. Pluznick), Trpv1DTA (Gift of R. Medzhitov). Gnotobiotic mice used: Germ-Free (GF) C57BL/6, Snap25RiboTag, SFB-monocolonized, Akkermansia muciniphilia monocolonized, Bacteroides fragilis monocolonized, OligoMM12-colonized, ASF-colonized (Rockefeller University), GF C57BL/6J (gift of J. Faith), GF C57BL/6J 6J and Clostridium spp. colonized mice (gift of D. Artis and G. Sonnenberg). Mice were bred within our facility to obtain strains described and were 7–12 weeks of age for all experiments unless otherwise indicated. For comparisons to GF mice, mice were maintained on sterilized Autoclavable Mouse Breeder Diet (5021, LabDiet, USA), the same used in the gnotobiotic facility. Female mice were used for all sequencing experiments. Male and female mice were used for all other experiments. Animal care and experimentation were consistent with NIH guidelines and approved by the Institutional Animal Care and Use Committee (IACUC) at The Rockefeller University.
Tamoxifen treatment.
For VillinTph1 mice 1mg of tamoxifen (Sigma) was injected i.p. on two consecutive days. Mice were then analysed 2 weeks following the last dose of tamoxifen. For AdvillinCreERT2 strains, mice were given 1mg of tamoxifen by i.p. injection on five consecutive days. Mice were then analysed at least 1 week following the final dose of tamoxifen.
Guanethidine treatment.
Mice were treated with guanethidine monosulfate (Sigma, 1301801–200MG) at 30mg/kg31 by i.p. injection concomitantly with treatment for Exendin-4 and DREADD experiments. For streptomycin experiments mice were treated with guanethidine monosulfate (30mg/kg) by i.p. injection 2 hours before streptomycin treatment (18:00) and 2 hours before GITT (08:00) the following day. For broad spectrum antibiotic experiments mice that were on antibiotics for at least 8 days were treated with guanethidine monosulfate (30mg/kg) the day before the experiment (18:00) and 2 hours before GITT (08:00) the following day.
Resiniferatoxin treatement.
Resiniferatoxin (RTX) was injected subcutaneously in the flank of with escalating doses of RTX (30, 70, 100 ug/kg on consecutive days) or vehicle (2% DMSO / 0.15% Tween-80 / PBS) while under isoflurane anesthesia32. 7 days after the last treatment of RTX mice were given an oral gavage of streptomycin (20mg) and the CG-SMG was dissected 24 hours later.
Tph1-flox recombination PCR.
DNA was extracted from the epithelial fraction of cells made by Percoll gradient of homogenized colon from VillinΔTph1 mice two weeks following tamoxifen administration using Quick Extract (Lucigen) DNA extraction buffer. Target sequences were amplified using the following primers: Tph1-forward 5’-GGATCCTAACCGAGTGTTCC-3’ Thp1-reverse-flox: 5’-GCACACCACCAACTCTTTCC-3’ Tph1-reverse-recombined: 5’-CTTGGAAGGTTTTGTATCACC-3’ PCR products were run on a 2% agarose gel and bands were analysed for the presence of the recombined band33.
Serotonin (5-HT) ELISA.
1cm of proximal colon, 1cm distal to the ceco-colonic junction, was dissected and then homogenized in a bead tube with 1mL of 0.1% ascorbic acid in PBS. The tubes were spun down and the supernatant was diluted 1/1000 in the same buffer and frozen at −80°C. The samples were then run in a Serotonin Ultrasensitive ELISA Kit (Eagle Biosciences, SEU39-K01) according to the manufacturer’s instructions.
Controlling for stress.
Due to the sensitivity of the sympathetic nervous system to stress, the following steps were taken eliminate this potential confounding factor. Experiments were not performed on days when cage changing took place. Mice were transported to the lab and sacrificed immediately, and all experiments with injections were done after a minimum of 5 days of i.p./handling habituation.
SFB colonization.
Mice mono-colonized with segmented filamentous bacteria (SFB) were kept in GF isolators and originally colonized by gavage with faecal extract from SFB mono-colonized mice kept at NYU (Littman lab). SFB colonization was verified by real time PCR using SFB-specific 16S primers; GF faeces served as a negative control, Taconic Farms C57BL/6 faeces as a positive control.
Akkermansia muciniphilia colonization.
7 week old GF C57BL/6 mice were mono-colonized with a culture of A. muciniphila YL44. A. muciniphila was BHI (Becton Dickinson) with hemin (5 μg/ml, Sigma), vitamin K1 (5 μg/ml, Sigma0, and 10 g/L porcine mucin type 3 (Sigma) and grown in an anaerobic atmosphere of 5% hydrogen, 10% carbon dioxide, and 85% nitrogen. Colonized mice were then kept in sterile isocages for 6 weeks.
Bacteroides fragilis colonization.
7 week old GF C57BL/6 mice were mono-colonized with a culture of B. fragilis NCTC9343. B. fragilis was cultured in BHI (Becton Dickinson) with hemin (5 μg/ml, Sigma) and vitamin K1 (5 μg/ml, Sigma) and grown in an anaerobic atmosphere of 5% hydrogen, 10% carbon dioxide, and 85% nitrogen. Colonized mice were then kept in sterile isocages for 6 weeks.
Clostridium spp. colonization.
Mice were colonized with Clostridium spp.9 in the Cornell Weill gnotobiotic facility.
Altered Schaedler Flora colonization.
C57BL/6 mice were maintained in germ-free conditions in ISOcage biocontainment isolator cages (Tecniplast, PA, USA) in the gnotobiotic facility at Rockefeller University. ASF colonization was achieved by inoculating germ-free mice with cecal contents of ASF donor mice stably colonized by vertical transmission (kindly provided by Amanda Ramer-Tait, University of Nebraska-Lincoln). Ceca were prepared by homogenization through a 100 μm filter in sterile phosphate-buffered saline (PBS) at a ratio of one cecum per 1 ml of PBS. Mice received 200 μl of ASF inoculum via oral-gavage twice, one week apart. The presence of members of the ASF microbial community was confirmed by a real-time PCR-based assay previously described34. All mice were analysed at least four weeks post colonization, with colonization further confirmed by 16s RNA sequencing of both faeces and ceca of analysed mice. We could detect RNA of at least 6 species by qPCR and 16s RNA sequencing after colonization.
OligoMM12 colonization.
The Oligo-MM12 consortium was a kind gift from K. McCoy (U. Calgary). OligoMM12 Ceca were prepared by homogenization through a 100 μm filter in sterile phosphate-buffered saline (PBS) at a ratio of one cecum per 1 ml of PBS. We colonized GF C57BL6/J breeders with a single gavage of OligoMM12 and monitored colonization by 16S sequencing, including the presence of the entire consortium in successive generations. Fully colonized mice were maintained and bred in germ free isolators. Vertically colonized C57BL6/J OligoMM12 mice were used for all experiments.
Antibiotic treatments.
Broad spectrum antibiotics (0.25 g Vancomycin, 0.25 g metronidazole, 0.5 g ampicillin, and 0.5 g neomycin) were dissolved in 500 mL of filtered water and supplemented with 5 g Splenda. Individual antibiotics (0.25 g vancomycin, 0.25 g metronidazole, 0.5 g ampicillin and 0.5 g neomycin) were dissolved in 500 mL of filtered water and supplemented with 5 g Splenda. To control for the sweet taste of the antibiotic solution, 5 g of Splenda was dissolved in filtered water. Water controls were given filtered water as their drinking water. All solutions were passed through a SteriCup 0.22 μm filter. All mice were maintained on combination or single antibiotics for 2 weeks. Streptomycin was prepared in sterile DPBS at a concentration of 200 mg/mL and then filtered with a 0.22 μm (EMD Millipore PES Express) syringe filter. A dose of 20 mg was given as an oral gavage of 100 μL of this stock solution.
Tributyrin treatment.
Tributyrin (Sigma W222305, 3.29M) was filter sterilized through a 0.22 μm (EMD Millipore PES Express) syringe filter prior to oral gavage or i.p. injection. 200 μL of tributyrin was given by oral gavage8. Two oral gavages were given over a period of 24 h, the first after giving streptomycin/PBS an the second dose given 8 h before sacrifice.
Exendin treatment.
Exendin-4 (Sigma E7144) was dissolved in sterile 0.9% saline and aliquots were kept at −20°C. 20 μg/kg Exendin-4 or saline was given by i.p. injection and issue was isolated 4 hours post-injection or motility was measured 5 minutes following injection. Exendin-9 (Sigma E7269) was dissolved in sterile 0.9% saline and aliquots were kept at −20°C. 40μg/kg Exendin-9 or saline was given by i.p. injection and tissue was isolated 4 hours post-injection.
PYY treatment.
PYY (Sigma P1306) was dissolved in sterile 0.9% saline and aliquots were kept at −20°C. 50 μg/kg PYY or saline was given by i.p. injection. Tissue was isolated 4 hours post-injection.
DREADD agonist.
Water soluble Compound 21 (HelloBio HB6124) was dissolved in sterile 0.9% saline and aliquots were stored at −80°C. Mice were given intraperitoneal injection at a dose of 10 mg/kg or 1mg/kg.
Acute intestinal distension.
Mice were given an oral gavage of 1M mannitol (Sigma) in DI water or 1% methyl cellulose in DI water35. The CG-SMG was then removed 5 hours post-gavage.
Cholestyramine treatment.
Mice were given an oral gavage of 100 uL of cholestyramine (200mg/mL). Two oral gavages were given over a period of 24 h, the first after giving streptomycin/PBS and the second dose given 8 h before sacrifice.
6-OHDA treatment.
6-hydroxydopamine (6-OHDA; Sigma) was dissolved in 0.1% L-ascorbic acid (Sigma) in sterile saline. This solution was injected i.p. at a concentration of 80 mg/kg body weight on three consecutive days 7 days before an oral gavage of PBS or streptomycin. Denervation was confirmed by immunofluorescence whole mount of tyrosine hydroxylase in the colon.
Fasting experiments.
Mice were fasted overnight for 16 hours.
Tracing injections.
Mice were anesthetized with 2% isoflurane with 1% oxygen followed by 1% isoflurane with 1% oxygen to maintain anaesthesia. After shaving and sterilization of the abdomen, mice were placed on a sterile surgical pad on top of a heating pad and covered with a sterile surgical drape. Ophthalmic ointment was placed over the eyes to prevent dehydration and the incision site was sterilized. Upon loss of recoil paw compression, a midline incision was made through the abdominal wall exposing the peritoneal cavity. For injections into the CG-SMG or duodenum an additional incision was made laterally to allow for better access. The duodenum, ileum, colon, or CG-SMG were located and exposed for injection. All injections were made with a pulled glass pipette using a Nanoject III. Following injection, the abdominal wall was closed using absorbable sutures and the skin was closed using surgical staples. Antibiotic ointment was applied to the closed surgical site and mice were given 0.05 mg/kg buprenorphine every 12 h for 2 days.
Stereotactic Surgery.
Mice were anesthetized using isoflurane, with induction at 4% and maintenance at 1.5–2%. Coordinates were identified using the Paxinos mouse brain atlas. For tracing studies of the nucleus tractus solitarius (NTS), mice were bilaterally injected with 150 nL of rgAAV-FLEX-CAG-tdTomato (Addgene #28306-AAVrg) into the NTS at AP −7.2, DV −4.3, ML 0.35 relative to bregma. For tracing studies of the LPGi/RVLM, mice were bilaterally injected with PRV-GFP at −6.35 AP, ML 0.9, DV −6.0. For chemogenetic activation studies, VGATCre mice were injected with 50nL of AAV5-hSyn-DIO-hM3D(Gq)-mCherry virus into the gigantocellular reticular nucleus (Gi) at AP-6.35, DV −5.8, ML 0.5 relative to bregma. VGLUT2Cre mice were injected with AAV5-hSyn-DIO-hM3D(Gq)-mCherry into the rostral ventrolateral medulla (LPGi/RVLM) at −6.35 AP, ML 0.9, DV −6.0 relative to bregma. Skin was closed using sutures.
Intracerebroventricular (i.c.v.) delivery of SCFAs.
Mice were anaesthetized under isofluorane and positioned in a stereotaxic frame (Kopf Instruments). The skull was exposed and a 26-gauge stainless steel guide cannula (PlasticsOne) was implanted into the lateral ventricle (midline −0.2 mm, 1.0 mm posterior from bregma, depth 2.3 mm from skull surface). The cannula was secured to the skull with dental cement and temporarily occluded with a dummy cannula (PlasticsOne). After surgery, the mice were singly-housed and given at least 1 week to recover. Prior to the study, cannula placement was verified by a positive dipsogenic response to angiotensin II (1 nmol in 1 μl; Sigma-Aldrich). I.c.v. injections were performed using a 30-gauge needle that extended 0.5 mm below the guide cannula (PlasticsOne), connected by cannula connector to a 5 μl Hamilton syringe and infused over 1 min using a microinfusion pump (Harvard Apparatus). Mice were habituated to i.c.v. infusions for at least 5 days prior to the experiment. An oral gavage of streptomycin (20mg at 200mg/mL) was given and then later artificial cerebrospinal fluid (aCSF) or SCFA (100uM sodium acetate, 10uM sodium propionate, and 10um sodium butyrate) dissolved in aCSF were delivered through the cannula. 16 hours later another i.c.v infusion of aCSF or SCFA was given and the CG-SMG was dissected 8 hours after the second infusion.
Subdiaphragmatic vagotomy (sdVx).
Mice were anesthetized using isoflurane (induction: 2% isoflurane with 1% oxygen, maintenance: 1% isoflurane with 1% oxygen). After shaving and sterilization of the abdomen, mice were placed on a sterile surgical pad on top of a heating pad and covered with a sterile surgical drape. Ophthalmic ointment was placed over the eyes to prevent dehydration and the incision site was sterilized. Adequate depth of anaesthesia was confirmed by loss of recoil paw compression. A midline abdominal incision was then made along the linea alba, exposing the peritoneal cavity. The liver was retracted using sterile, saline-dampened cotton Q-tips. The right and left vagus nerve were visualized along the oesophagus below the diaphragm by a surgical microscope and cut using microscissors. This included the hepatic, gastric, ventral and dorsal vagal trunks. 0.5 μL of CTB555/594 was then injected into the stomach or ileum to confirm successful vagotomy by a lack of labelling in the nodose ganglion. Following the procedure, the abdominal wall was closed using absorbable sutures and the skin was closed using surgical staples. Antibiotic ointment was applied to the closed surgical site and mice were given 0.05 mg/kg buprenorphine every 12 h for 2 days. For sham-operated animals the vagus nerve was similarly exposed but not cut.
PRV tracing with sdVx.
Mice were given sdVx as described above, followed by injection of a 1 μL mixture of (0.5 μL PRV-152 and 0.5 μL CTB594) into the proximal colon. The inclusion of CTB was necessary to confirm successful vagotomy and to ensure that nodose neurons observed came from retrograde transport of PRV originating in the CG-SMG and traveling through the CNS. Following the procedure, the abdominal wall was closed using absorbable sutures and the skin was closed using surgical staples. Antibiotic ointment was applied to the closed surgical site and mice were given 0.05 mg/kg buprenorphine every 12 h for 2 days. For sham-operated animals the vagus nerve was similarly exposed but not cut.
Whole mount intestine immunofluorescence.
Briefly, mice were sacrificed by cervical dislocation and the small intestine was removed and placed in HBSS Mg2+Ca2+(Gibco) + 5% FCS. The intestine was cut open longitudinally and the luminal contents washed away in DPBS. The muscularis was then carefully dissected away from the underlying mucosa in one intact sheet. The tissue was pinned down in a plate coated with Sylgard and then fixed O/N with 4% PFA with gentle agitation. After washing in DPBS whole mount samples were then permeabilized first in 0.5% Triton X-100/0.05% Tween-20/4 μg heparin (PTxwH) for 2 hours at room temperature (RT) with gentle shaking. Samples were then blocked for 2 h in blocking buffer (PTxwH with 5% bovine serum albumin/5% donkey/goat serum) for 2 hr at RT with gentle agitation. Antibodies were added to the blocking buffer at appropriate concentrations and incubated for 2 days at 4°C. After primary incubation the tissue was washed 4 times in PTxwH and then incubated in blocking buffer with secondary antibody at concentrations within the primary antibody range for 2 hours at RT. Samples were again washed 4 times in PTxwH and then mounted with FluoroMount G on slides with 1 ½ coverslips. Slides were kept in the dark at 4°C until they were imaged.
Restraint stress.
For restraint stress experiments, each mouse was placed in a properly ventilated 50 mL conical plastic tube for 15 min. The mice could rotate but could not turn head to tail.
Cholera toxin tracing.
Mice were anesthetized and operated on as described above. 1.5 uL of 1% CTB 488, 555, or 647 in PBS with 0.1% FastGreen was injected with a pulled glass pipette using a Nanoject III into the ileum, duodenum, colon and celiac-superior mesenteric ganglion. For triple labelling, 0.5uL of 1% CTB488, 555, or 647 was injected into the duodenum, ileum, and proximal colon of the same mice. The tissue was carefully washed several times with PBS to prevent possible spill over of tracer to other tissues. Following the procedure, the abdominal wall was closed using absorbable sutures and the skin was closed using surgical staples. Antibiotic ointment was applied to the closed surgical site and mice were given 0.05 mg/kg buprenorphine every 12 h for 2 days. Relevant tissues were then dissected after a minimum of 2–4 days post-injection.
Ileal denervation to confirm cholera toxin tracing specificity.
Mice were anesthetized as described above and the ileal vein and artery to the distal ileum was identified. A cauterizer was used to sever the main ileal artery/vein and surrounding nerves. Once the mesentery was resected, 0.5uL of CTB594 or CTB647 with 0.1% FastGreen was injected with a pulled glass pipette using a Nanoject III was injected into the distal ileum between the two most distal lymph nodes. The tissue was carefully washed several times with PBS to prevent possible spill over of tracer to other tissues. LNG, RNG, and CG-SMG tissues were then dissected after 2 days post-injection followed by overnight fixation in 4% PFA. Following the procedure, the abdominal wall was closed using absorbable sutures and the skin was closed using surgical staples. Antibiotic ointment was applied to the closed surgical site and mice were given 0.05 mg/kg buprenorphine every 12 h for 2 days. Sham was identical to the previous procedure, but the mesentery was left intact.
Bile duct cauterization.
Mice were anesthetized as described above and a lateral incision was made to expose the liver and upper GI tract. Cotton swabs soaked in DPBS were used to gently lift the liver and expose the stomach and upper duodenum. The common bile duct was located and was cauterized 5mm from the choledocho-duodenal junction. Following the procedure, the abdominal wall was closed using absorbable sutures and the skin was closed using surgical staples. Antibiotic ointment was applied to the closed surgical site and mice were given 0.05 mg/kg buprenorphine every 12 h for 2 days. Mice began to display signs of jaundice after 2–3 days following the procedure. Successful interruption of the bile duct was confirmed by observation of significant dilation of the gall bladder and bile duct upon dissection of mice day 10 post cauterization.
Nodose ganglion injection.
Mice were anesthetized as described above and the ventral neck surface was cut open. Associated muscle was removed by blunt dissection to expose the trachea. The NG was located by following the vagus nerve along the carotid artery to the base of the skull. Fine forceps were used to separate the vagus from the carotid artery, and the NG body was exposed by careful dissection. 1uL of AAV9-Syn-ChrimsonR-tdTomato (Addgene #59171-AAV9) with 0.1% FastGreen was injected with a pulled glass pipette using a Nanoject III. The skin was then closed with absorbable sutures and antibiotic cream was applied. Relevant tissues were dissected at a minimum of 2 weeks post-injection.
FosTRAP2-PRV analysis.
FosTRAP2 mice were crossed with Rosa26lsl-tdTomato:RiboTag mice to generate a TRAP2Tom:RiboTag reporter strain. Mice were habituated and singly housed for at least 5 days. A single oral gavage of streptomycin (20mg/mouse) was given and after 24 hours fed mice were injected i.p. with an aqueous solution 4 hydroxytamoxifen36 to induce Cre recombinase activity in Fos expressing cells, resulting in tdTomato and RPL22-HA expression by recently activated neurons. After 7 days, we injected 1uL of PRV-152 (GFP) into the proximal colon. Four days later, were perfused and relevant brain areas were analysed for the presence of Tomato+ and GFP+ neurons.
CTB NG and CG-SMG counting.
CTB488 was injected into the duodenum, ileum, and proximal colon. Mice were sacrificed by cervical dislocation and the CG-SMG and NG were harvested and fixed overnight in 4% PFA. Tissue was then washed four times in DPBS at RT and permeabilized in PTxwH for 4 hr at RT. Primary antibody anti-AlexaFluor488 (1:400, Thermo Fisher Scientific, A-11094) was added to the samples in PTxwH and incubated at 4°C for 48 h. Samples were washed four times in PTxwH at RT and then stained with goat-anti rabbit AF555/568/647 at 4°C for 24 h. Samples were washed four times in PTxwH at RT, covered in Fluormount G, and coverslipped for confocal imaging. Each ganglion was captured in full by multiple z-stacks and the total number of CTB+ neurons were counted.
Celiac ganglion tracing.
Mice were anesthetized and operated on as described above. 1.5 uL of AAVrg-hSyn1-Cre with 0.1% FastGreen was injected into the CG-SMG of Rosa26lsl-tdTomato mice. 1.5 uL of AAV2-CAG-FLEX-tdTomato with 0.1% FastGreen was injected into the CG-SMG of Snap25cre mice. Intestine samples were dissected after 2.5 weeks for AdipoClear, RIMS, or Focus Clear analysis.
Viscerofugal tracing.
Mice were anesthetized and operated on as described above. 1.5 uL of AAV6-CAG-FLEX-tdTomato with 0.1% FastGreen was injected into the ileum wall of Snap25cre mice. CG-SMG samples were then dissected after 2.5 weeks for whole mount immunofluorescence analysis.
Virus.
All viruses used in these studies were: AAV5-hSyn-DIO-mCherry (Addgene), AAVrg-CAG-tdTomato (Addgene), AAV5-hSyn-DIO-hM3Dq-mCherry (Addgene), AAV5-hSyn-DIO-hM4Di-mCherry (Addgene), (Addgene)AAVrg-CAG-FLEX-tdTomato (Addgene), AAV6-CAG-FLEX-tdTomato (Addgene), AAVrg-hSyn1-Cre (Janelia), AAV2-hSyn-hM3Dq-mCherry (Addgene), AAV2-hSyn-hM4Di-mCherry (Addgene), AAV9-Syn-ChrimsonR-tdTomato (Addgene #59171-AAV9), PRV-152 (Gift of L. Enquist), PRV-614 (Gift of L. Enquist). Fast Green (Sigma) was added (0.1%) to virus injected into peripheral tissues.
Fluorogold Labelling.
A stock solution of 4 mg/mL Fluorogold (Fluorochrome) was made in sterile 0.9% saline and then filter sterilized through a 0.22 μm syringe filter. An i.p. injection of 300 μL of Fluorogold solution was given 3 days before tissue harvesting.
Retrograde PRV Tracing.
Mice were anesthetized and operated as described above. PRV Bartha 152 (GFP) or 614 (RFP) were a gift of L. Enquist. 3uL with 0.1% FastGreen was injected with a pulled glass pipette using a Nanoject III into the wall of the ileum, duodenum, and colon. Brains and spinal columns were harvested three (CG-SMG, spinal cord, and brain) and four days (brain) after injection.
Chemogenetics of CG-SMG neurons.
1 μL of AAV2-hSyn-hM3Dq-mCherry or AAV2-hSyn-hM4Di-mCherry (Addgene) was injected into the CG-SMG of C57BL/6J mice. Mice were then sutured, and staples were applied. Antibiotic ointment was applied to the closed surgical site and mice were given 0.05 mg/kg buprenorphine every 12 h for 2 days. After 2 weeks mice were habituated to i.p. injections for 5 days before administration of 1 mg/kg or 10mg/kg Compound 21.
Antibodies.
The following primary antibodies were used, and unless otherwise indicated concentrations apply to all staining techniques: NeuroTrace AF569/AF647 (1:200, Thermo Fisher Scientific, N21482/N21483), GFP Tag AF488/555/647 (1:400, Thermo Fisher Scientific A21311/A31851/A31852), TH (1:200, Aves Labs, TYH; 1:400, Millipore Sigma, AB152; 1:200 Millipore Sigma, AB1542), BIII-Tubulin (1:400, Millipore Sigma, T2200; 1:200, Aves Labs, TUJ), NPY (1:200, Immunostar, 22940), RFP (1:200, Sicgen, AB8181; 1:200 and 1:1000 AdipoClear brain, Rockland, 600-401-379), ANNA-1 (1:200,000, Gift of Dr. Vanda A. Lennon), cFos (1:1000, Cell Signaling Technologies, 2250S), HA (1:1000, Cell Signaling Technologies, 3724S; 1:1000, Aves Labs, ET-HA100; RiboTag: 1:160, abcam, ab9110), 5-HT (1:200, Millipore Sigma, MAB352), anti-AlexaFluor488 (1:1000, Thermo Fisher Scientific, A-11094), and VGLUT2 (1:200, Millipore Sigma, AB2251-I). Fluorophore-conjugated secondary antibodies were either H&L or Fab (Thermo Fisher Scientific) at a consistent concentration of 1:1000 in the following species and colors: goat anti-rabbit (AF488/568/647), goat anti-rat (AF488/647), goat anti-chicken (AF488/568/647), goat anti-human (AF568/647), donkey anti-guinea pig (AF488/647), donkey anti-rabbit (AF568/647), donkey anti-goat (AF568/647), donkey anti-sheep (AF568/790).
Intestine dissections.
Mice were sacrificed and duodenum (1 cm moving proximal from the gastroduodenal junction), ileum (1 cm moving proximal from the ileocecal junction), or colon (4 cm moving proximal from the rectum) was removed. For AdipoClear fecal contents were flushed from the lumen and tissue was left intact. Tissue used for RIMS or FocusClear were cut open longitudinally and fecal contents were washed out. For dissection of the muscularis, following the above procedures, the intestinal tissue was placed on a chilled aluminium block with the serosa facing up10. Curved forceps were then used to carefully remove the muscularis.
Nodose ganglion (NG) dissections.
Mice were sacrificed and the ventral neck surface was cut open. Associated muscle was removed by blunt dissection to expose the trachea. The NG was then located by following the vagus nerve along the carotid artery to the base of the skull. Micro-dissection scissors were used to cut the vagus nerve below the NG and superior to the jugular ganglion.
Superior cervical ganglion (SCG) dissections.
Mice were sacrificed and the ventral neck surface was cut open. Associated muscle was removed by blunt dissection to expose the trachea. The SCG was then located by following the carotid artery to its bifurcation into internal and external, where the SCG is positioned underneath. In some cases, the NG and SCG are fused, thus only fully separate ganglia were isolated to avoid the appearance of NG neurons at one pole of the SCG. Fine forceps and micro-dissection scissors were used to remove the SCG.
Stellate ganglion dissections.
Mice were sacrificed and the ribs were separated along the midline. Relevant organs were then removed to expose the spine and the stellate ganglion was located under first or second rib near the costovertebral joint, in close proximity to the spine. Fine forceps and micro-dissection scissors were used to remove the stellate ganglion.
Celiac-superior mesenteric ganglion dissections.
Mice were sacrificed and a midline incision was made, and the viscera were reflected out of the peritoneal cavity. The intersection of the descending aorta and left renal artery was identified, from which the superior mesenteric artery was located. The CG-SMG is wrapped around the superior mesenteric artery and associated lymphatic vessels. Fine forceps and micro-dissection scissors were used to remove the CG-SMG.
Dorsal root ganglion dissections.
The spinal column was isolated, cleaned of muscle, and bisected sagittally. The spinal cord was removed leaving the dorsal root ganglion (DRG) held in place by the meninges. The thoracic 13 DRG was identified by its position just caudal to thoracic vertebra. The meninges were cleared and individual DRGs were removed with fine forceps and micro-dissection scissors.
Spinal cord dissections.
For 3DISCO analysis the spinal cord was isolated by hydraulic extrusion as previously described37. For whole spinal column calAdipoClear imaging, the entire spinal column was removed with associated tissue. Costae and muscle were carefully trimmed to reduce the size of the sample to fit into a 5 mL Eppendorf tube while avoiding disrupt ventral tissue attached to the spinal cord.
RiboTag.
Heterozygous or homozygous Snap25RPL22HA were used for TRAP-seq analysis as no differences were found between either genotype. For NG, DRG, and CG-SMG IP, tissues were isolated as described above. The RiboTag IP protocol was then followed (http://depts.washington.edu/mcklab/RiboTagIPprotocol2014.pdf) with the following modifications. All samples were homogenized by hand with a dounce homogenizer in 2.5 mL supplemented homogenization buffer (changes per 2.5 mL: 50 μL Protease Inhibitor, 75 μL heparin (100 mg/mL stock), 25 uL SUPERase• In RNase Inhibitor). Samples were then centrifuged for 10 minutes at 10,000 G, after which 800 μL of supernatant was removed and 5 μL of anti-HA antibody (Abcam, ab9110) was added. Samples were kept rotating at 4°C with antibody for 1 hour. 200 μL of Thermo Protein magnetic A/G beads were washed with homogenization buffer, added to the sample, and kept rotating for 30 minutes at 4°C. The beads were washed four times with high-salt buffer and samples were eluted with 100 μL of PicoPure lysis buffer. RNA was extracted using the Arcturus PicoPure RNA isolation kit (Applied Biosystems) according to the manufacturer’s instructions.
RiboTag RNA-sequencing.
RNA libraries were prepared using SMARTer Ultra Low Input RNA (ClonTech Labs) and sequenced using 75 base-pair single end reads on a NextSeq 500 instrument (Illumina). Reads were aligned using Kallisto38 to the Mouse transcriptome (Ensembl, release v91). Transcript abundance files were then used in the DESeq2 R package39, which was used for all downstream differential expression analysis and generation of volcano plots. For intestine samples cre+ samples were compared with cre- samples to generate a list of immunoprecipitated (IP) enriched genes (log2FC > 1 and padj < 0.05). This IP enriched list was then used to perform downstream analysis. Differentially expressed genes between samples were defined as those contained within the total IP enriched list from tissues being compared and with a cutoff of log2FC > 1. PCA plots were generated from log transformed DEseq2 data, as indicated in figure legends, with the FactoMineR R package. GSEA pre-ranked analysis was performed with desktop software and the C5 gene ontology database using 1000 permutations. Gene ontology enrichment analysis was performed with differentially expressed genes (log2FC > 1, padj < 0.05) using the TopGO R package and a Fisher test with an elimination algorithm was used to calculate significance.
16S sample processing.
16s samples were processed utilizing a Promega Maxwell® RSC 48 Instrument. Following DNA extraction from all samples, DNA samples were quantified using a ThermoFisher Quant-It dsDNA High-Sensitivity Kit on a microplate reader.
16S sequencing.
16s sequencing was performed on the Illumina MiSeq depending on project-specific needs. Raw paired-end fastq files containing sequence reads were merged at the overlapping region to produce a single 16s contig. All merged sequences having more than 1 expected error per read were filtered. Operational taxonomic units (OTUs) were generated by clustering sequences with a 99% correspondence and chimera sequences were removed using usearch40 (v11). Reads were mapped against the OTU reference to generate a matrix of counts. Subsequently, OTU taxonomy and classification were performed with mothur41 (v1.40.5) using the greengenes database. Next, statistical analysis were implemented using the phyloseq42 package for R.40 (v1.40.5) using the greengenes database. Next, statistical analysis were implemented using the phyloseq41 package for R.
Brain immunofluorescence.
Mice were sacrificed and transcardially perfused with cold PBS with heparin followed by cold 4% PFA (Electron Microscopy Sciences). The intact brain was separated carefully from the skull and placed in 4% PFA, and then rotated for 48 h at 4°C. Whole brains were washed with PBS/0.03%Azide and sectioned at 50 μm on a Leica vibratome for immunofluorescence. Samples were then permeabilized in 0.5% Triton/0.05 Tween-20 in PBS (PTx) followed by blocking in 5% goat serum in PTx each for 2 h at room temperature. Primary antibody was added to the blocking buffer and samples were incubated with constant rotation at 4°C overnight. Four 15-minute washes were done in PTx at RT after which samples were moved to blocking buffer with secondary antibody. Slices were incubated in secondary antibody for 2 hours at room temperature followed by four 15-minute washes in PTx at room temperature. Samples were then placed on microscope slides, covered in Fluormount G, and coverslipped.
Confocal imaging.
Whole mount intestine, NG, DRG, and CG-SMG samples were imaged on an inverted LSM 880 NLO laser scanning confocal and multiphoton microscope (Zeiss) and on an inverted TCS SP8 laser scanning confocal microscope (Leica).
PRV counting.
Images of brainstem vibratome slices were taken at 10x magnification. The raphe pallidus, gigantocellular nucleus, and lateral paragigantocellular nucleus/rostral ventrolateral medulla were identified based on the Allen Brain Atlas. All VGATGFP and VGLUT2GFP cells were counted within this region, as well as all PRV-RFP+ cells. These numbers were then averaged across each brainstem region for all slices from a single animal. Thus, each point on the graph is representative of one animal.
RIMS clearing.
Briefly, following secondary staining CG-SMG, nodose and DRG were submerged in Refractive Index Matching Solution (RIMS) for 30–120 min then mounted in RIMS solution on a glass slide and sealed with a coverslip for confocal imaging30.
FocusClear.
Whole intestine and celiac ganglion samples were first fixed in 4% PFA overnight at 4°C. Samples were then washed three times in DPBS at RT. Samples were placed into 250 μL of FocusClear solution for 15–20 minutes. They are then transferred to MountClear solution on a glass slide and a 1 ½ coverslip was used to seal the sample in place.
3DISCO.
3DISCO clearing of whole spinal cord was done as previously described43.
AdipoClear.
Adipoclear whole tissue clearing was adapted from Adipoclear protocol18. Mice were sacrificed and intestinal sections were removed followed by overnight fixation in 4% PFA. Tissues were washed in PBS then dehydrated in 20/40/60/80/100% Methanol in B1N followed by dichloromethane. Tissues were then rehydrated in 100/80/60/40/20% methanol in B1N. Subsequently, samples were washed in PTxwH and then incubated in primary antibody dilutions in PTxwH for 7 Days. Samples were washed in PTxwH then incubated in secondary antibody at 1:400 in PTxwH for 7 days. Samples were again washed in PTxwH followed by PBS then dehydrated in 20/40/60/80/100% methanol followed by dichloromethane and finally cleared in dibenzyl ether.
calAdipoClear.
CalAdipoclear whole tissue clearing was adapted from Adipoclear protocol18. Briefly, mice were sacrificed and perfused with PBS followed by 4% PFA. Whole spinal columns were removed and put into 4% PFA overnight. Tissues were washed in PBS then dehydrated in 20/40/60/80/100% methanol in B1N followed by dichloromethane. Tissues were then rehydrated in 100/80/60/40/20% methanol in B1N. Subsequently, samples were decalcified in Morse Solution (1-part 45% formic acid/1-part 0.68 mM sodium citrate dihydrate) overnight followed by PTxwH washes. Samples were then incubated in primary antibody dilutions in PTxwH for 7 Days. Samples were washed in PTxwH then incubated in secondary antibody at 1:400 in PTxwH for 7 days. Samples were again washed in PTxwH followed by PBS then dehydrated in 20/40/60/80/100% methanol followed by dichloromethane and finally cleared in dibenzyl ether.
Light sheet microscopy and 3D reconstructions.
Whole-tissue cleared samples were imaged submerged in DBE on a LaVision Biotech Ultramicroscope II with 488 nm, 561nm, 640 nm, or 785 light sheet illumination using a 1.3x or 4x objective with 2.5um Z-slices. Images were adjusted post hoc using Imaris x64 software (version 9.1 Bitplane) and 3D reconstructions were recorded as mp4 video files. Optical slices were taken using the orthoslicer or oblique slicer tools.
ClearMap analysis.
All analyses for whole-brain studies were performed adapting ClearMap pipeline (latest version available from www.idisco.info, see also22).
Quantification of enteric neurons.
A minimum of 10 images were randomly acquired across a piece of whole mount muscularis. These images were then opened in ImageJ, and the cell counter was used to count the number of ANNA-1+ cells in a given field. This number was then multiplied by a factor of 2.95 (20x objective) or 3.125 (25x objective), to calculate the number of counted neurons per square millimeter (mm2). The average of 10 (or more) images were then calculated and plotted. Thus, every point on a given graph corresponds to a single animal.
Quantification of CG-SMG cFos.
Mice were sacrificed by cervical dislocation and CG-SMG were harvested and fixed overnight in 4% PFA. CG-SMG were then washed four times in DPBS at RT and permeabilized in PTxwH at 4°C for at least 5 days. Primary antibody cFos (1:1000, Cell Signaling Technologies, 2250S) was added to the samples in PTxwH and incubated at 4°C for 3 days. Samples were washed four times in PTxwH at RT and then stained with goat-anti rabbit AF555/568/647 at 4°C for 3 days. Samples were washed four times in PTxwH at RT, covered in Fluormount G, and coverslipped for confocal imaging. We first established criteria for identifying neuronal cFos+ nuclei by staining CG-SMG from restraint-stressed mice, a condition known to activate the sympathetic nervous system7,44. FluoroGold was used to identify sympathetic neurons and cFos+ nuclei were defined as morphologically circular with a diameter of 8–14um. These criteria were sufficient to distinguish between small intensely fluorescent cells and possibly macrophages that also have cFos expression. We captured all sympathetic neurons within the CG-SMG, as defined by tyrosine hydroxylase staining, FluoroGold fluorescence, tdTomato fluorescence, or autofluorescence (experiment dependent), with multiple z-stack images. All images were analysed in Image-J. Total cFos+ nuclei were counted using the Cell Counter plugin for Image-J, and data were not normalized to area or volume. Each data point represents the number of cFos+ cells per CG-SMG.
Brainstem cFos counting experiments.
Mice were fasted for 16 hours (GF, SPF, SNShM4Di, Phox2bhM4Di) before perfusion (GF, SPF) or injection of Compound 21 (SNShM4Di, Phox2bhM4Di). Mice were perfused 3 hours post Compound 21 injection or 24 hours post streptomycin gavage. Brains were sectioned as described above and sections were permeabilized in 0.5% Triton/0.05 Tween-20 in PBS (PTxwH) followed by blocking in 5% goat serum in PTxwH each for 2 h at room temperature. cFos primary antibody (1:1000, CST) was added to the blocking buffer and samples were incubated with constant rotation for 48 hours at 4°C. Four 15-minute washes were done in PTxwH at RT after which samples were moved to blocking buffer with secondary antibody. Slices were incubated in secondary antibody for 2 hours at room temperature followed by four 15-minute washes in PTxwH at room temperature. Samples were placed on microscope slides, covered in Fluormount G, and coverslipped. All sections containing NTS/AP were imaged and included in counting of cFos+ cells. Therefore, each data point represents the total number of cFos+ cells per relevant brain area captured.
RNAScope.
Nodose ganglia (NG) from C57Bl/6 mice were dissected as described above. Once removed ganglia were dipped in Fast Green (1%, Sigma-Aldrich) to assist with visualization when slicing and flash frozen in OCT. 15 um sections of NG were sliced on a cryostat for RNAScope. Samples were processed and stained with Scn5a, positive control or negative control probes according to the manufacturer’s instructions. Samples were mounted in Prolong gold antifade with DAPI (Thermo-Fisher) for imaging and imaged within 24 hours on an inverted LSM 880 NLO laser scanning confocal and multiphoton microscope (Zeiss) and images were processed using Image J.
RNAScope/IHC.
C57Bl/6 mice were injected bilaterally with CTB 488 into the colon as described above. NG were dissected 1 week post injection as described above, dipped in Fast Green (1%, Sigma-Aldrich) to assist with visualization and flash frozen in OCT. 15 um sections of NG were sliced on a cryostat for RNAScope/IHC. Samples were processed and stained with Scn5a, positive or negative control probes according to the manufacturer’s instructions. After in situ hybridization sections were washed three times in wash buffer (1X, ACDBio) and then fixed in 1% PFA in TBS for 10 minutes at 4 C to stabilize the ISH labeling. Samples were next washed three times in TBS-T and incubated in 10% Goat Serum in TBS with 1% BSA for 30 minutes. Samples were stained with anti Alexafluor-488 antibody (1:1000, Thermo-Fisher) for 1 hour in TBS-1% BSA. After primary antibody staining, sections were washed three times for 5 minutes each in TBST and stained with Goat anti rabbit AF488 (1:1000, Thermo-Fisher) in TBS-1% BSA for 30 minutes. Samples were again washed three times for 5 minutes each in TBST and finally mounted in Prolong gold antifade with DAPI (Thermo-Fisher) for imaging. Slides were imaged within 24 hours of mounting on an inverted LSM 880 NLO laser scanning confocal and multiphoton microscope (Zeiss) and images were processed using Image J.
Intestine motility measurements.
For measurement of total intestinal transit time, mice were given an oral gavage of 6% carmine red dissolved in 0.5% methylcellulose (made with sterile 0.9% saline). Total intestinal transit time was measured as the time from oral gavage it took for mice to pass a fecal pellet that contained carmine. To measure colonic motility a glass bead (3 mm diameter) was pushed into the colon to a distance of 2 cm from the anal verge. The time required for expulsion of the glass bead was measured and taken as an estimate of colonic motility. Mice in both assays were injected 2 minutes before starting with i.p. Compound 21 (1mg/kg or 10mg/kg as indicated).
Open Field Test.
For locomotion activity assessment an open field test (OFT) was performed using a small cubic box, measuring 27.3 cm3. The top of the cube of the OFT box is uncovered. Mice were placed in the bottom surface, and movements were recorded over the course of 2 sessions of 5 minutes. The first session was measured without manipulating the animal (basal). The second session was measured immediately after an I.P. injection of Compound 21 (10mg/kg). Computer-tracking program EthoVision XT (Noldus) was used to analyse the movements of the animal over time. Total distance travelled and velocity was assessed.
Salmonella infections.
CBA/J mice were given an oral gavage of 109 WT Salmonella typhimurium (IR715). For all Salmonella infections, a single aliquot of either strain of Salmonella was grown in 3 ml of luria broth (LB) overnight at 37°C with agitation. Bacteria were then sub-cultured (1:300) into 3 ml of LB for 3.5 hours at 37°C with agitation, and diluted to final concentration in 1 ml of LB. Bacteria were inoculated by gavage into recipient mice in a total volume of 100 μl and mock infected mice were given an oral gavage of 100 μl LB.
Colony forming unit counting.
Faecal pellets from Salmonella-infected mice were weighed and then disrupted in 400 μL of DPBS. Serial dilutions were made from the original suspension and then 5μL of each dilution was plated onto Salmonella-Shigella plates. The plates were then incubated overnight, and the number of black colonies were counted for the serial dilution with the clearest delineation of single units. This number was then multiplied by the dilution factor and by 80 to give the number of colony forming units (CFUs) in the original suspension. CFU numbers were then divided by the original fecal pellet weight to give the number of CFUs per mg of faeces.
Cecal short chain fatty acid measurements.
Concentrations of acetate, propionate, and butyrate were measured as previously described45. Briefly, cecal samples were weighed into 2 mL microtubes containing 2.8 mm ceramic beads (Omni International) and resuspended to a final concentration of 100 mg/mL using 80:20 methanol:water containing acetate-d3, propionate-d5, butyrate-d7, valerate-d9 internal standards (Cambridge Isotope Laboratories). Homogenization was using a Bead Ruptor (Omni International) at 5.4 m/s for 3 minutes at 4°C. Samples were centrifuged for 20 minutes at 20,000 × g at 4°C. 100 μL of cecal extract was added to 100 μL of 100 mM borate Buffer (pH 10). Subsequently 400 μL of 100 mM pentafluorobenzyl bromide (Thermo Scientific) in acetone (Fisher) and 400 μL of cyclohexane (Acros Organics) was added and the reaction vials were sealed. Samples were heated to 65°C for 1 hour with agitation and then cooled to room temperature to allow phase separation. 100 μL of the cyclohexane (upper) phase was then transferred to an autosampler vial and analysed at 1:10 and 1:100 dilutions made using cyclohexane. A calibration curve was prepared in PBS and borate buffer covering the range 0.1 – 50 mM. Analysis by GC-MS was using an Agilent 7890A GC and Agilent 5975C MS detector operating in negative chemical ionization (CI) mode. Methane was used as the CI reagent gas at 2 mL/min and a 1 μL splitless injection was made onto a DB-5MS column (30 m × 0.25 mm, 0.25 μm; (Agilent Technologies). For SCFA quantitation raw peak areas of acetate (m/z 59) and propionate (m/z 73) were normalized to acetate-d3 (m/z 62) and propionate-d5 (m/z 78) internal standards respectively; C4 compounds butyrate and isobutyrate (m/z 87) were normalized to butyrate-d7 (m/z 94). Data analysis was using Agilent MassHunter Quantitative Analysis software (version 10.1, Agilent Technologies).
Statistical analysis.
Exact values of significance are indicated in all figures. All data are presented as mean ± s.d. indicated in the figure legends. The experiments were not randomized, and no statistical methods were used to predetermine sample size. Multivariate data was analysed by one-way ANOVA and Tukey’s multiple comparisons post hoc test. Comparisons between two conditions were analysed by unpaired Student’s t-test. We used GraphPad PRISM version 8.0d and R 3.4.3 for generation of graphs and statistics.
Extended Data
Extended Data Figure 1 |. Comparison of extrinsic EAN organization.

a, Number of CTB+ neurons per left (L) and right (R) (n=5 ganglia from independent mice) nodose ganglion (NG) of C57BL/6J SPF mice injected with CTB555 into the cecum. b, Number of CTB+ neurons per CG-SMG of mice injected with CTB555 into the cecum (n=4 ganglia from independent mice). c, Retrograde CTB tracing from intestinal segments to the DRG Th10. Images representative of duodenum (n=3 averaged pairs of ganglia from independent mice), ileum (n=3 averaged pairs of ganglia from independent mice), and proximal colon (n=3 averaged pairs of ganglia from independent mice). d, (Left) Scheme showing retrograde tracing to the DRG. (Right) Distribution of labelled neurons in the DRG of mice injected with CTB555 in the duodenum (n=3 averaged pairs of ganglia from independent mice), ileum (n=3 averaged pairs of ganglia from independent mice), proximal colon (n=3 averaged pairs of ganglia from independent mice), and mid-distal colon (n=2 averaged pairs of ganglia from independent mice). e, (Left) Number of CTB+ neurons and (right) representative images of individual superior cervical (n=10 ganglia from 7 mice) and stellate (n=8 ganglia from 4 mice) ganglia of mice injected with CTB647 in the ileum and proximal colon. f, Loop of distal ileum from sham-operated and locally denervated (DNx) mice. Representative of n=7 mice. g, Representative R-NG of mice injected with CTB594 into the distal ileum of sham (n=7 ganglia) or DNx mice (n=6 ganglia). h, Number of CTB+ neurons in the CG-SMG and NG of sham (L-NG, n=5 ganglia; R-NG, n=7 ganglia; CG-SMG, n=5 ganglia) or DNx mice (L-NG, n=5 ganglia,; R-NG, n=7 ganglia; CG-SMG, n=4 ganglia) injected with CTB594/647 in the distal ileum. i, Image of NG of mice injected with CTB488 into the jejunum (n=2 mice). j, Anatomical verification of subdiaphragmatic vagotomy (sdVx) showing (top) enlarged stomach and (bottom) successful severing of the vagal nerves below the diaphragm. Images representative of n= 10 mice. k, Immunofluorescence images of NG from sham or sdVx mice 3 days after i.p. FluoroGold injection (native fluorescence). Images representative of n= 5 ganglia. l, Immunofluorescence images of NG from sham or sdVx mice injected with CTB488 in the stomach. Images representative of n=5 ganglia. m, Immunofluorescence images of NG from sdVx mice injected with CTB488 in the ileum/proximal colon or sham mice injected with CTB488 in the proximal colon. Images representative of n=2 ganglia. n, Dual CTB tracing in the Th9 DRG from the duodenum (green arrows) and ileum (red arrows). Representative of n=3 mice. o-q, Dual CTB tracing in the CG-SMG and NG from the: (o) duodenum (green arrows) and ileum (red arrows); (p) spleen (green arrows) and distal colon (red arrows); (q) duodenum and stomach (white arrows indicate dual labelled neurons). Images representative of n=3 ganglia from independent mice. c,e,g,i,k-q, Scale bars = 50μm. a,b,d,e,h, Mean ± s.d. a,h, Two-tailed unpaired t-test. g,i,k,l, Dashed lines highlight the NG. m-q, Arrows indicate CTB+ cells.
Extended Data Figure 2 |. Microbial depletion leads to changes in extrinsic EAN.

a, Immunofluorescence images of the nodose ganglion (NG), CG-SMG, and dorsal root ganglion (DRG) from Snap25RiboTag SPF mice using anti-hemagglutinin (HA, in green) antibody and NeuroTrace (red). Images representative of n=4. b, Immunofluorescence images of the NG, CG-SMG, and DRG from Snap25RiboTag mice GF mice using anti-hemagglutinin (HA, in green) antibody and NeuroTrace (red). Images representative of n=2. c-e, Volcano plots of differentially expressed genes by (c) NG and Th9 DRG, (d) Th9 DRG and CG-SMG, and (e) NG and CG-SMG of Snap25RiboTag SPF mice. f-h, Immunofluorescence images of CG-SMG from (f) C57BL/6J SPF mice using anti-TH (green) and anti-NPY (red), (g) ChattdTomato mice using anti-cFos (red) antibody and native tdTomato fluorescence (green), and (h) C57BL/6J SPF mice using anti-TH (green) and anti-SST (red) antibodies. Images representative of n=3 ganglia. i, Volcano plots of differentially expressed genes by Th9 DRG from GF and SPF Snap25RiboTag mice. Red/blue dots = log2 fold change > 0.5. Italicized parentheses = log2 fold change > 1. j, Immunofluorescence images of the CG-SMG from C57BL/6J SPF mice 3 days after i.p. FluoroGold injection (native fluorescence). Dotted line outlines the FluoroGold+ signal. Image representative of n=4 ganglia. k, Immunofluorescence images of CG-SMG from acutely stressed C57BL/6J SPF mice 3 days after i.p. FluoroGold injection using with anti-cFos (red) antibody and native FluoroGold fluorescence. Image representative of n=4 ganglia. l, Immunofluorescence images of CG-SMG from acutely stressed C57BL/6J SPF mice stained for cFos (white). White arrows indicate neuronal cFos+ nuclei, red arrows indicate non-neuronal cFos+ nuclei. Scale bar = 10 μm. Image representative of n=4 ganglia. m,n, (m) Most abundant bacterial genera and (n) Shannon diversity index in 16S sequencing of cecal samples from 24 hours post PBS- (n=5) and streptomycin- (n=5) treated C57BL6/J mice as determined by the phyloseq R package. a, b, f-h, j, k, l, Scale bars = 50 μm. g, Arrows indicate cFos+ cells and stars indicate tdTomato+ cells. c-e, i, Number (n) of independent biological samples analysed are indicated in parentheses. c-e, Red/blue dots = log2 fold change > 3. c-e, i, padj = two-tailed Benjamini and Hochberg test p-value of two-sided Wald test p-value < 0.05.
Extended Data Figure 3 |. Effects of modulation of SCFAs on gut sympathetic neurons.

a-f, Quantification of SCFA in the cecal contents of (a) VAMN- (n=5) and Splenda- (n=5) treated C57BL/6J mice, (b) PBS- (n=5) and strep- (n=5) treated C57BL/6J mice, (c) single antibiotic- (n=5 for each antibiotic) and Splenda- (n=5) treated C57BL/6J mice, (d) C57BL/6J GF mice (n=3) colonized with ASF (n=2) or Clostridium consortium (n=4), (e) C57BL/6J GF (n=5), GF mice monocolonized with SFB (n=5), or SPF (n=5) mice and (f) GF mice (n=5), SPF mice (n=5), GF mice colonized with A. muciniphilia (n=3), B. fragilis (n=3), or OligoMM12 (n=4). g, Cecal weight of SPF (n=6) and OligoMM12 (n=14) mice. h, Dissected cecum (in 6 well cell culture plate) images from mice treated with Splenda, ampicillin, neomycin, vancomycin, or metronidazole for 2 weeks. Each representative of n=5 ceca from separate mice. i, Number of cFos+ neurons in the CG-SMG of C57BL/6J mice treated with methylcellulose (n=5) or mannitol (n=5). j, Number of Salmonella colony-forming-units (CFU) per mg of faeces of Salmonella-infected CBA/J mice (n=5), compared to luria broth (LB)-gavaged control mice (n=5). k, Number of cFos+ neurons in the CG-SMG of CBA/J mice orally inoculated with Salmonella (n=10) or given oral gavage of luria broth (n=10). Dashed line indicates average number of cFos+ neurons for antibiotic treated mice (320). l, Quantification of SCFA in the cecal contents of CBA/J mice orally inoculated with Salmonella (n=4) or given oral gavage of LB (n=5). m, Number of cFos+ neurons in the CG-SMG of (m) C57BL/6J SPF mice 24 hours post oral gavage with strep and treated with SCFA-supplemented or sodium-containing water, (n) C57BL/6J SPF mice treated with intracerebroventricular (i.c.v.) artificial cerebrospinal fluid (aCSF) (n=5) or SCFA in aCSF (n=4) post strep treatment, (o) C57BL/6J GF mice 24 hours post-treatment with tributyrin (n=5) or PBS (n=5), (p) C57BL/6J SPF mice treated with tributyrin (n=7) or PBS (n=6) 24 hours post oral gavage of streptomycin, (q) CBA/J SPF mice treated with tributyrin (n=5) or PBS (n=5) 24 hours post oral gavage of streptomycin. r, Quantification of SCFA in cecal samples of GF mice given consecutive oral gavage of PBS (n=2) or Tributyrin (n=3). s, Cecal weight of mice given oral gavage of streptomycin followed by treatment with PBS (n=5) or Tributyrin (n=5). t-v, Number of cFos+ neurons in the CG-SMG of (r) Gpr109a–/– (n=3) and littermate control Gpr109a+/– mice (n=3), (s) Gpr109a–/–Gpr43–/– mice (n=8), (t), Gpr41–/– and littermate control Gpr41+/+ mice. a-f, g, i-t Mean ± s.d. a, b, d, g, i, k-q, s-v, Two-tailed unpaired t-test. c, e, f, One-way ANOVA with Tukey’s multiple comparisons. a-d, j, Dashed line indicates lowest limit of detection. r-t, Dashed line indicates average number of cFos+ neurons/CG-SMG for GF mice (334).
Extended Data Figure 4 |. Effects of microbe-modulated host factors on sympathetic activation and gut motility.

a, Number of cFos+ neurons in the CG-SMG of C57BL/6J mice treated with cholestyramine after oral gavage of PBS (n=5) or streptomycin (n=5). b, Number of cFos+ neurons in the CG-SMG of C57BL/6J mice with bile duct cauterization after oral gavage of PBS (n=3) or streptomycin (n=4). c, Agarose gel image of recombination PCR analysis of colon samples. Lower bands correspond to recombined allele in tamoxifen-treated VilTph1fl/fl (n=3) mice, compared to VilCreERT2- (n=3) control mice. d, 5-HT concentration in colonic tissues from VilΔTph (n=5), VilTph1fl/+ (n=7), and VilCreERT2- (n=7) mice 2 weeks post-tamoxifen injection. e, f, (e) Gastrointestinal transit time and (f) Number of cFos+ neurons in the CG-SMG of VilΔTph (n=5) or control mice (n=8) two weeks post-tamoxifen injection. g-i, (g) Number of cFos+ neurons in the CG-SMG, (h) colonic motility and (i) gastrointestinal transit time of C57BL/6J mice 4 hours post i.p. injection of Exendin-4 (n=5) or saline (n=5). j, Gastrointestinal transit time of C57BL/6J mice 5 minutes post i.p. injection of Exendin-4 with saline (n=10) or guanethidine (n=9). k, Number of cFos+ neurons in the CG-SMG of C57BL/6J mice 4 hours post i.p. injection of saline (n=5) or Exendin (9–39) (n=5) and 24 hours post streptomycin treatment. l, Number of cFos+ neurons in the CG-SMG of Glp1r–/– mice treated for 2 weeks with broad spectrum antibiotics (VAMN, n=5) or Splenda (n=4) in drinking water. m, n, Number of cFos+ neurons in the CG-SMG of C57BL6/J mice (m) 4 hours post i.p. injection of saline (n=5) or PYY (50 mg/kg) (n=5) or (n) 4 hours post i.p. injection of saline (n=5) or PYY (50 mg/kg) (n=5) in mice treated with streptomycin 24 hours prior. a, b, d-n, Mean ± s.d. a, b, e-n, Two-tailed unpaired t-test. d, One-way ANOVA with Tukey’s multiple comparisons. e, h-j, Dashed line indicates maximum time allowed per animal for each motility measurement. f, g, l, m, Dashed line indicates average number of cFos+ neurons/CG-SMG for antibiotic treated mice (320).
Extended Data Figure 5 |. CG-SMG activation unlikely requires direct sensing of microbes or viscerofugal input.

a-d, AAVrg-CAG-FLEX-tdTomato injection into the CG-SMG of Snap25Cre mice for tracing of fibres in the intestine. a, (Left) Scheme and (right) Immunofluorescence images of the CG-SMG using anti-TH (green) antibody and native tdTomato fluorescence (red). Image representative of n=2. b, Light-sheet 3D reconstruction and optical section of the (left) colon or (right) cecum. (Left) Scale bars= 300 μm (left image) and 200 μm (right image). (Right) Scale bars = 500 μm (left image) and 200 μm (right image). Images representative of n=3. c, Immunofluorescence images of the (top) ileum and (bottom) colon myenteric plexus using anti-TH (green) antibody and native tdTomato fluorescence (red). Image representative of n=2. d-f, AAVrg-hSyn1-Cre injection into the CG-SMG of Rosa26lsl-tdTomato mice for tracing of fibres in the intestine. d, (Left) Scheme and (right) immunofluorescence image of the CG-SMG using native Tomato fluorescence (red). Image representative of n=2. e, Immunofluorescence image of the ileum myenteric plexus using native Tomato fluorescence (red). Image representative of n=2. f, Immunofluorescence image of the ileum villi using anti-TH(green) antibody and native Tomato fluorescence (red). Image representative of n=2. g, Immunofluorescence stitched images of the colon myenteric plexus from C57BL/6J mice treated with 6-OHDA using anti-TH (red) antibody. Dashed lines indicate mesenteric border. Scale bar = 500 μm. Image representative of n=10. h, Number of cFos+ neurons in the CG-SMG of C57BL/6J mice treated with 6-OHDA before PBS (n=5) or streptomycin (n=5) treatment. i, Transcripts per million (TPM) as calculated by Kallisto alignment for Ffar3 expression by CG-SMG neurons isolated from SPF (n=3) and GF (n=3) Snap25RiboTag mice (TRAPseq analyses). j, Immunofluorescence image of the CG-SMG from C57BL/6J mice i.p. injected with Tributyrin using anti-cFos antibody. Image representative of n=4. k, (Left) Scheme representing injection of CT555 into the CG-SMG for visualization of viscerofugal neurons. (Right) Immunofluorescence image of the ileum myenteric plexus using native CTB555 fluorescence. White arrows indicate CTB+ neurons. Image representative of n=3. l, (Left) Scheme representing injection of AAV6-CAG-FLEX-tdTomato into the intestine of Snap25cre mice for tracing of fibres. (Right) Immunofluorescence image of CG-SMG showing tdTomato+ fibres originating, in part, from the intestine. CG-SMG is outlined with dashed lines. Image representative of n=2. m-t, PBS- and streptomycin-treated C57BL/6J mice 24 hours post gavage received retrograde CTB594 injection into the CG-SMG. m-v, Analysis of the ileum (m-o, s, u; n=5 PBS, n=5 Strep) and colon (p-r, t, v; n=4 PBS, n=5 Strep). (m,p) Total number of, (n,q) percentage of cFos+ within, (o,r) percentage of cFos+ among CTB+ within, ANNA-1+ neurons. s, t, Immunofluorescence staining of myenteric plexus neurons from the (s) ileum or (t) colon using anti-neuronal nuclear (ANNA-1) (green) and anti-cFos (white) antibodies combined with native CTB594 fluorescence. Arrows indicate CTB+ cFos+ cells. u, v, Percent of CTB+ among ANNA-1+ neurons in the ileum (u) or colon (v). a, c-f, j-l, s, t, Scale bars = 50 μm. h, i, m-r, u, v, Mean ± s.d. h, i, m-r, u, v, Two-tailed unpaired t-test.
Extended Data Figure 6 |. Mapping and characterization of sympathetic premotor populations that connect to the intestine.

a-c, Number of cFos+ neurons in the CG-SMG of (a) Splenda-treated fasted (n=5) or fed (n=6), VAMN-treated fasted (n=4) or fed (n=4), (b) streptomycin-treated fasted (n=5) or fed (n=5), and (c) GF fasted (n=6) or fed (n=5) C57BL/6J mice. d, Cecal weights of Splenda-treated fasted (n=5) or fed (n=6), VAMN-treated fasted (n=5) or fed (n=4), streptomycin-treated fasted (n=8) or fed (n=7), and GF fasted (n=6) or fed (n=5) C57BL/6J mice. e, Optical projection of 3DISCO-cleared spinal cord showing sympathetic preganglionic CTB+ neurons from C57BL/6J SPF mice injected with CTB555 into the CG-SMG. Scale bar = 20 μm. IML=intermediolateral cell column, IC: intercalated nucleus, IPPe: central autonomic area. Image representative of n=3. f-h, 3D reconstruction of calAdipoClear-cleared (f) CG-SMG, (g), spinal cord (sympathetic preganglionic neurons) and (h) intact spinal column, from C57BL/6J SPF mice 4 days post injection of PRV-RFP (red) into the ileum, stained with anti-TH (green) antibody. Scale bar = 300 μm. Image representative of n= 3. In h, anti-TH (white) antibody and autofluorescence in green; (right) outline of relevant spinal cord structures. Scale bars = 400 μm. Image representative of n=3. i, Immunofluorescence images of brainstem slices from VGATL10GFP mice 4 days post injection of PRV-RFP into the ileum or peritoneum. Dashed lines highlight relevant areas. Images representative of n=2. j, Immunofluorescence images of the dorsal vagal complex in brainstem slices from C57BL/6J mice subjected to subdiaphragmatic vagotomy (sdVx), 4 days post injection of PRV-RFP in the ileum. Dashed lines highlight relevant areas. Images representative of n=2. k, Immunofluorescence image of medullary regions in a brainstem slice from C57BL6/J mice subjected to subdiaphragmatic vagotomy (sdVx), 4 days post injection of PRV-RFP into the ileum. Dashed lines highlight relevant areas. Images representative of n=2. l, ClearMap analysis of C57BL6/J mice 3 and 4 days post injection of PRV-RFP into the ileum, showing the caudal pontine reticular nucleus (right). Scale bars = 1 mm. Images representative of n= 3. m, Immunofluorescent images for neuronal subsets within the RPa and Gi in mice 4 days post PRV-RFP injection into the ileum. Native fluorescence for RFP (red) and stained with anti-5-HT (green), anti-VGLUT2 (green), and anti-TH (green) antibodies. Dashed lines highlight the RPa. White arrows indicate VGLUT2+ cells. Images representative of n=2. n, Immunofluorescent images of the brainstem from mice 4 days post-injection of PRV-GFP (duodenum) and PRV-RFP (ileum). Relevant brainstem regions are highlighted. Representative images of n=3. i-k, m, n, Scale bars = 50 μm. a-d, Mean ± s.d. a, d, One-way ANOVA with Tukey’s multiple comparisons. b, c, Two-tailed unpaired t-test.
Extended Data Figure 7 |. Gut-connected sympathetic pre-motor brainstem regions modulate intestinal motility.

a, Immunofluorescence images of brain slices from C57BL/6J SPF and GF mice stained with anti-cFos (black) and anti-TH (red) antibodies. White-dashed lines outline RPa, Gi, LPGi, RVLM. Images representative of n=2. b, (Left) Percentage of TRAP+ cells among PRV GFP+ cells and (right) total number of TRAP+ cells in the LPGi/RVLM of FosTRAP2:tdTomato mice. Animals were treated with streptomycin (n=4) or PBS (n=4), and with 4-OHT 24 hours later. c, Immunofluorescent images of brain slices from VGAT:hM3DqGi/RPa and VGLUT2:hM3DqLPGi/RVLM mice stained with anti-cFos (green) and anti-RFP (red) antibodies. White-dashed lines outline relevant areas. Arrows indicate mCherry+ cFos+ cells. Images representative of n=3. d, (Top) Colonic motility or (bottom) gastrointestinal transit time of C57BL6/J mice treated with 1 mg/kg Compound 21 (n=5) or saline (n=5). e, Gastrointestinal transit time of VGLUT2:hM3DqLPGi/RVLM (n=14) or hM3DqLPGi/RVLM (n=14) mice treated with saline. f, Total fecal output of VGLUT2:hM3DqLPGi/RVLM (n=14) hM3DqLPGi/RVLM (n=10) mice treated with 1mg/kg Compound 21. g, h, Open-field test velocity of (left) VGLUT2:hM3DqLPGi/RVLM (n=14) hM3DqLPGi/RVLM (n=8) mice and (right) VGAT:hM3DqGi/RPa (n=6) and hM3DqGi/RPa (n=6) treated with (g) saline or (h) 1 mg/kg Compound 21. a, c, Scale bars = 50 μm. b, d-h, Mean ± s.d. b, d-h, Two-tailed unpaired t-test. d, e, Dashed line indicates maximum time allowed per animal for motility measurement.
Extended Data Figure 8 |. Mapping and characterization of the dorsal vagal complex connected to distal intestine.
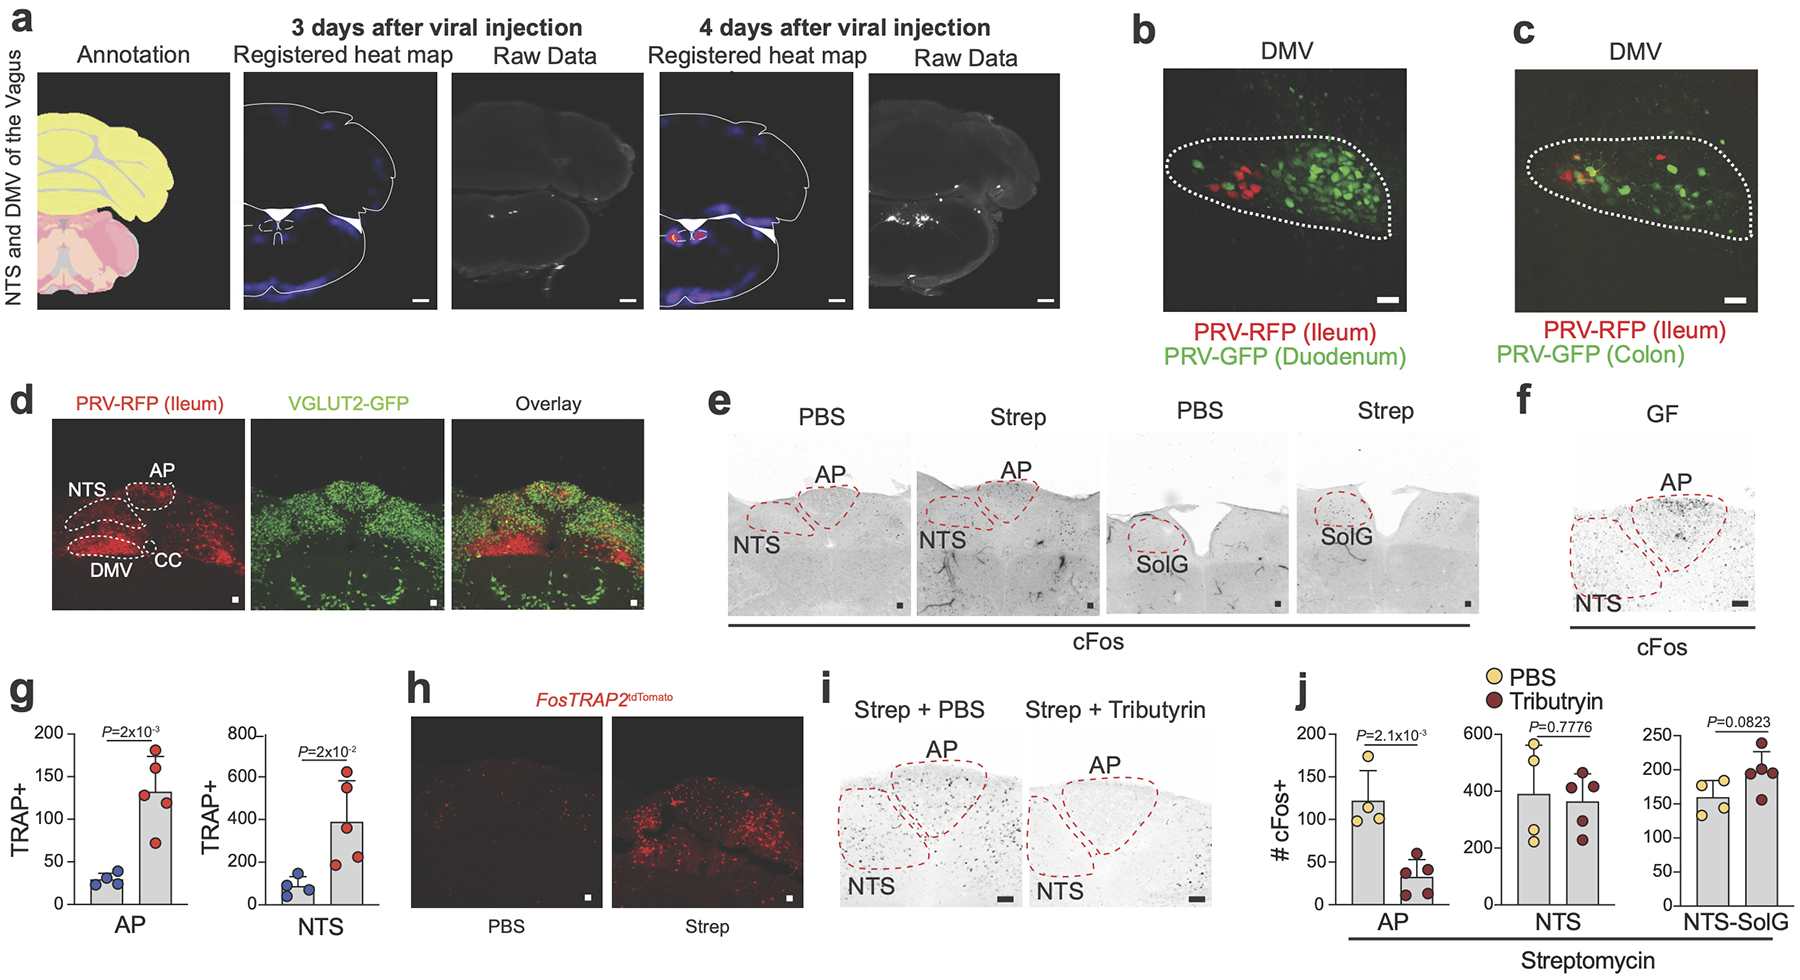
a, ClearMap analysis of the nucleus tractus solitarius (NTS)/dorsal motor nucleus of the vagus nerve (DMV) and the caudal pontine reticular nucleus, days 3 and 4 post PRV-RFP injection into the ileum of C57BL/6J mice. Scale bars = 1mm. Images representative of n= 3. b, c, Immunofluorescence images of the caudal brainstem 4 days post PRV injection into the (b) ileum (PRV-RFP) and duodenum (PRV-GFP) or (c) ileum (PRV-RFP) and colon (PRV-GFP) of C57BL/6J mice. Dashed line outlines the borders of the DMV. Image representative of n=3. d, Immunofluorescence images of brainstem sensory nuclei from VGLUT2L10GFP mice 4 days post-injection of PRV-RFP using with anti-GFP and anti-RFP antibodies. e, Immunofluorescence images of brains slices from C57BL/6J mice treated with PBS or streptomycin. Images representative of n=9. f, Immunofluorescence images of NTS and AP from C57BL/6J GF mice stained with anti-cFos (black) antibody. Images representative of n=3. g, Number of TRAP+ cells in the AP and NTS of FosTRAP2:tdTomato mice treated with streptomycin (n=5) or PBS (n=4), given 4-OHT 24 hours later. h, Immunofluorescence images of brains slices showing TRAP+ cells in the AP and NTS of FosTRAP2:tdTomato mice treated with PBS (left) or streptomycin (right), given 4-OHT 24 hours later. Images representative of n=4. i, j, (i) Immunofluorescence images of the NTS and AP, stained using anti-cFos (black) antibody, and (j) number of cFos+ neurons in the AP, NTS, and SolG, 24 hours post concomitant treatment with streptomycin (n=4) and PBS (n=5) (left) or Tributyrin (right) of C57BL/6J mice, Images representative of n=5; PBS (n=4), Tributyrin (n=5). b-f, h, Scale bars = 50 μm. g, j, Mean ± s.d. g, j, Two-tailed unpaired t-test.
Extended Data Figure 9 |. Targeting of peripheral neurons using different Cre mouse lines.

a, b, Immunofluorescence images of (a) NG, CG-SMG, and DRG or (b) myenteric plexus and villi in the ileum from Phox2btdTomato:RiboTag, SNStdTomato:RiboTag, and Nav1.8tdTomato:RiboTag mice. Images representative of n=3. In (b), red-dashed lines highlight villi structure. c, Number of cFos+ neurons in the CG-SMG of Trpv1Cre- and Trpv1DTA mice treated with PBS (n=2, n=3 respectively) or streptomycin (n=3, n=3 respectively). d, Immunofluorescence images of CG-SMG from C57BL/6J mice injected with AAV2-hSyn-hM3Dq-mCherry or AAV2-hSyn-hM3Dq-mCherry virus, post administration of 1mg/kg Compound 21. Arrows indicate cFos+ mCherry+ cells. Asterisks indicate other cFos+ cells (possibly hematopoietic cells). e, Percentage of cFos+ among mCherry+ neurons in the CG-SMG of C57BL/6J mice injected with AAV2-hSyn-hM3Dq-mCherry (n=4) or AAV2-hSyn-hM4Di-mCherry (n=5 or n=4) virus, post administration of 1mg/kg or 10mg/kg Compound 21. f, Number of cFos+ neurons in the CG-SMG of C57BL6/J mice injected with AAV2-hSyn-hM3Dq-mCherry (n=4) or AAV2-hSyn-hM4Di-mCherry virus post administration of 1mg/kg (n=5) or 10mg/kg (n=4) Compound 21. g, Number of mCherry+ neurons in the CG-SMG of C57BL/6J mice injected with AAV2-hSyn-hM3Dq-mCherry (n=4) or AAV2-hSyn-hM4di-mCherry post administration of 1mg/kg (n=5) or 10mg/kg (n=4) Compound 21. h, Immunofluorescence images of CG-SMG from Nav1.8tdTomato, AviltdTomato, and SNStdTomato mice injected with CTB488 in the proximal colon. Arrows indicate neurons that are CTB+ and tdTomato–. i, Number of cFos+ neurons in the CG-SMG of Nav1.8hM4Di mice 6 hours post administration with 10mg/kg Compound 21 (n=3) or saline (n=3). j, RNAscope in situ hybridization images of left (L-NG) and right nodose ganglion (R-NG) for Scn5a (Nav1.5) (red). Images representative of n=4. k, RNAscope in situ hybridization images of the R-NG for Scn5a (Nav1.5) (red) and Cre from mice injected with AAVrg-pmSyn-Cre-EGFP into the proximal colon. Images representative of n=2. l, RNAscope in situ hybridization images of the R-NG for Scn5a (Nav1.5) (red) and immunofluorescence for CTB488 from mice with CTB488-injected into the proximal colon. Images representative of n=2. a, b, d, h, j-l, Scale bars = 50 μm. c, e-g, i, Mean ± s.d. c, i, Two-tailed unpaired t-test. e-g, One-way ANOVA with Tukey’s multiple comparisons.
Extended Data Figure 10 |. Gut-connected brainstem regions modulate intestinal motility.
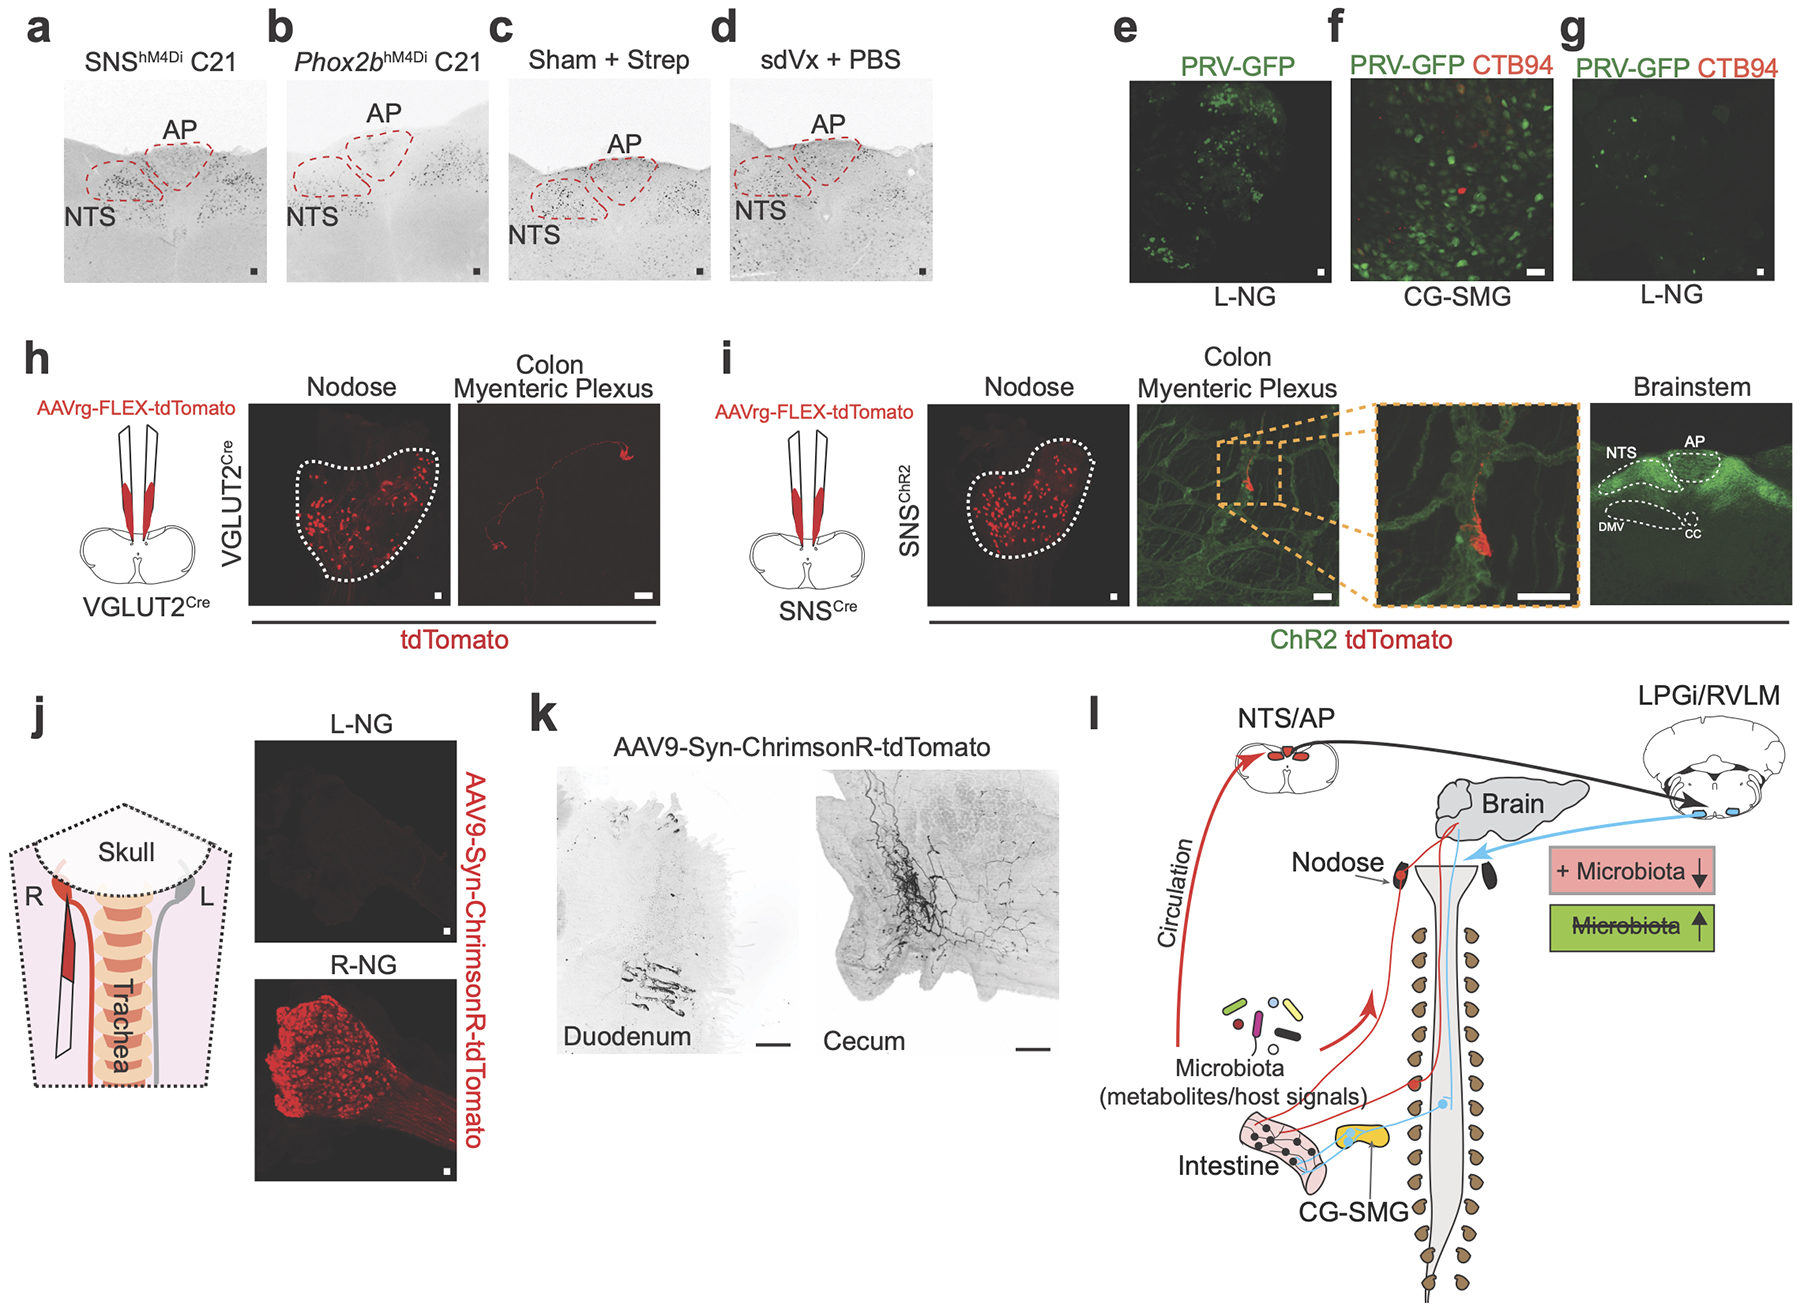
a, b, Immunofluorescence images of brains slices highlighting the NTS/AP from (a) SNShM4Di or (b) Phox2bhM4Di mice treated with Compound 21 at 10 mg/kg, stained with anti-cFos (black) antibody. Images representative of n=3. c, d, Immunofluorescence images of brains slices highlighting the NTS/AP from (c) sham-operated C57BL6/J mice treated with streptomycin or (d) sdVx C57BL6/J mice treated with PBS, stained with cFos (black) antibody. Images representative of n=5. e, Immunofluorescence image of the left NG post injection of PRV-GFP into LPGi/RVLM of brainstem. Outline highlights NG. Image representative of n=3. f, g, Immunofluorescence images of (f) CG-SMG or (g) L-NG the after PRV-GFP and CTB594 injection into the proximal colon of subdiaphragmatically vagotomized C57BL/6J mice. Image representative of n=3. h, i, (Left) Scheme of injection of AAVrg-FLEX-tdTomato into the NTS of (h) VGLUT2Cre or (i) SNSChR2 mice. (Right) Immunofluorescence images of the NG and colonic myenteric plexus. Outline highlights NG. Images representative of n=2. i, Inset shows tdTomato+ fibre surrounding an intrinsic neuron. Brainstem slice shows absence of Cre activity in the dorsal motor nucleus of the vagus. Outline highlights relevant areas. Images representative of n=3. j, Immunofluorescence cleared-tissue images of the duodenum (left) and cecum (right) of mice injected with AAV9-Syn-ChrimsonR-tdTomato in the R-NG. Scale bar = 500 mm. Image representative of n=3. k, (left) Scheme of right NG injection. (right) Expression of AAV9-Syn-ChrimsonR-tdTomato in NG. Image representative of n=3. l, Scheme for microbiota-sensitive circuits controlling sympathetic activity to the gut, and potentially other visceral organs. a-j, Scale bars = 50 μm.
Supplementary Material
Acknowledgements
We thank all Mucida Lab members past and present for assistance in experiments, fruitful discussions and critical reading of the manuscript. In particular we thank; A. Rogoz for the maintenance of gnotobiotic mice; S. Gonzalez for maintenance of SPF mice; T. Rendon and B. Lopez for genotyping; C. Nowosad for setting up the ASF; A. North, C. Pyrgaki, T. Tong, C. Rico, and P. Ariel of the Rockefeller University Bio-imaging Research Center for assistance with the light sheet microscopy and image analysis; the Rockefeller University Genomics Center for RNA sequencing; Rockefeller University employees for continuous assistance; T.Y. Oliveira for valuable discussions on TRAPseq approaches and help with initial analysis; S. Poliak (Kallyope) for help in setting up tracing experiments and valuable input throughout the project; K. Loh and A. Ilanges for fruitful experimental discussions; J. Friedman and V. Ruta for the generous use of lab equipment; A. Lockhart, V. Jové, and V. Ruta for critical reading of the manuscript; V. Jové for critical reading of the reviewer responses; L. Vosshall, M. Nussenzweig, G. Victora and J. Lafaille and their respective lab members for fruitful discussions and suggestions; D. Littman and M. Xu for generously providing faeces from SFB mono-colonized mice; D. Artis, and G. Sonnenberg for generously providing GF mice and Clostridium consortium colonized mice; N. Arpaia for Gpr43−/− mice; S. Mehandru for Gpr109a−/− Gpr43−/− mice; J. Pluznick, J. Gordon, and M. Yanagisawa for Gpr41−/− mice; I. Chiu and J. Wood for Nav1.8Cre mice; C. Woolf and R. Kuhner for SNSCre mice; A. Ramer-Tait for ASF ceca; J. Faith for providing GF; G. Donaldson for providing the A. muciniphilia and B. frag mono-colonized mice; C. Nowosad for providing the OligoMM12 mice. We finally thank R.U. Muller for his inspiration. This work was supported by NIDDK K99 DK120869 (M.S.), NIH Virus Center grant no. P40 OD010996, NIH F31 Kirchstein Fellowship (P.A.M.), NCATS NIH UL1TR001866 (P.A.M., D.M.), Philip M. Levine Fellowship (P.A.M.), Kavli Graduate Fellow (P.A.M.), Kavli Postdoctoral Fellow (M.S.), Anderson Graduate Fellowship (F.M.), Leon Levy Fellowship in Neuroscience (J.d.M.), the Leona M. and Harry B. Helmsley Charitable Trust (D.M.), the Kenneth Rainin Foundation (D.M.), the Burroughs Wellcome Fund PATH Award (D.M.), Transformative R01DK116646 (D.M).
Footnotes
Competing interests
The authors declare no competing financial interests.
Data Availability Statement
TRAP RNA sequencing and 16S sequencing data that support the findings of this study have been deposited in the GEO repository with the accession code PRJNA608916. Raw data is provided for all figures with bar graphs: Figures 1–4 and Extended Data Figures 1–10.
References
- 1.Furness JB, Rivera LR, Cho HJ, Bravo DM & Callaghan B The gut as a sensory organ. Nature reviews. Gastroenterology & hepatology 10, 729–740, doi: 10.1038/nrgastro.2013.180 (2013). [DOI] [PubMed] [Google Scholar]
- 2.Han W et al. A Neural Circuit for Gut-Induced Reward. Cell 175, 665–678 e623, doi: 10.1016/j.cell.2018.08.049 (2018). [DOI] [PMC free article] [PubMed] [Google Scholar]
- 3.Williams EK et al. Sensory Neurons that Detect Stretch and Nutrients in the Digestive System. Cell, doi: 10.1016/j.cell.2016.05.011 (2016). [DOI] [PMC free article] [PubMed] [Google Scholar]
- 4.Fung TC, Olson CA & Hsiao EY Interactions between the microbiota, immune and nervous systems in health and disease. Nature neuroscience 20, 145–155, doi: 10.1038/nn.4476 (2017). [DOI] [PMC free article] [PubMed] [Google Scholar]
- 5.Veiga-Fernandes H & Mucida D Neuro-Immune Interactions at Barrier Surfaces. Cell 165, 801–811, doi: 10.1016/j.cell.2016.04.041 (2016). [DOI] [PMC free article] [PubMed] [Google Scholar]
- 6.Heiman M, Kulicke R, Fenster RJ, Greengard P & Heintz N Cell type-specific mRNA purification by translating ribosome affinity purification (TRAP). Nature protocols 9, 1282–1291, doi: 10.1038/nprot.2014.085 (2014). [DOI] [PMC free article] [PubMed] [Google Scholar]
- 7.Mei Q, Mundinger TO, Kung D, Baskin DG & Taborsky GJ Jr. Fos expression in rat celiac ganglion: an index of the activation of postganglionic sympathetic nerves. Am J Physiol Endocrinol Metab 281, E655–664, doi: 10.1152/ajpendo.2001.281.4.E655 (2001). [DOI] [PubMed] [Google Scholar]
- 8.Biggs MB et al. Systems-level metabolism of the altered Schaedler flora, a complete gut microbiota. ISME J 11, 426–438, doi: 10.1038/ismej.2016.130 (2017). [DOI] [PMC free article] [PubMed] [Google Scholar]
- 9.Atarashi K et al. Treg induction by a rationally selected mixture of Clostridia strains from the human microbiota. Nature 500, 232–236, doi: 10.1038/nature12331 (2013). [DOI] [PubMed] [Google Scholar]
- 10.Gabanyi I et al. Neuro-immune Interactions Drive Tissue Programming in Intestinal Macrophages. Cell 164, 378–391, doi: 10.1016/j.cell.2015.12.023 (2016). [DOI] [PMC free article] [PubMed] [Google Scholar]
- 11.Braniste V et al. The gut microbiota influences blood-brain barrier permeability in mice. Sci Transl Med 6, 263ra158, doi: 10.1126/scitranslmed.3009759 (2014). [DOI] [PMC free article] [PubMed] [Google Scholar]
- 12.Rivera-Chavez F et al. Depletion of Butyrate-Producing Clostridia from the Gut Microbiota Drives an Aerobic Luminal Expansion of Salmonella. Cell host & microbe 19, 443–454, doi: 10.1016/j.chom.2016.03.004 (2016). [DOI] [PMC free article] [PubMed] [Google Scholar]
- 13.Koh A, De Vadder F, Kovatcheva-Datchary P & Backhed F From Dietary Fiber to Host Physiology: Short-Chain Fatty Acids as Key Bacterial Metabolites. Cell 165, 1332–1345, doi: 10.1016/j.cell.2016.05.041 (2016). [DOI] [PubMed] [Google Scholar]
- 14.Nohr MK et al. Expression of the short chain fatty acid receptor GPR41/FFAR3 in autonomic and somatic sensory ganglia. Neuroscience 290, 126–137, doi: 10.1016/j.neuroscience.2015.01.040 (2015). [DOI] [PubMed] [Google Scholar]
- 15.Buffie CG et al. Precision microbiome reconstitution restores bile acid mediated resistance to Clostridium difficile. Nature 517, 205–208, doi: 10.1038/nature13828 (2015). [DOI] [PMC free article] [PubMed] [Google Scholar]
- 16.Harach T et al. TGR5 potentiates GLP-1 secretion in response to anionic exchange resins. Sci. Rep 2, 430, doi: 10.1038/srep00430 (2012). [DOI] [PMC free article] [PubMed] [Google Scholar]
- 17.Young JB & Landsberg L Suppression of sympathetic nervous system during fasting. Science 196, 1473–1475, doi: 10.1126/science.867049 (1977). [DOI] [PubMed] [Google Scholar]
- 18.Chi J et al. Three-Dimensional Adipose Tissue Imaging Reveals Regional Variation in Beige Fat Biogenesis and PRDM16-Dependent Sympathetic Neurite Density. Cell metabolism 27, 226–236 e223, doi: 10.1016/j.cmet.2017.12.011 (2018). [DOI] [PubMed] [Google Scholar]
- 19.Browning KN & Travagli RA Central nervous system control of gastrointestinal motility and secretion and modulation of gastrointestinal functions. Compr Physiol 4, 1339–1368, doi: 10.1002/cphy.c130055 (2014). [DOI] [PMC free article] [PubMed] [Google Scholar]
- 20.Barbara G et al. Interactions between commensal bacteria and gut sensorimotor function in health and disease. The American journal of gastroenterology 100, 2560–2568, doi: 10.1111/j.1572-0241.2005.00230.x (2005). [DOI] [PubMed] [Google Scholar]
- 21.Allen WE et al. Thirst-associated preoptic neurons encode an aversive motivational drive. Science 357, 1149–1155, doi: 10.1126/science.aan6747 (2017). [DOI] [PMC free article] [PubMed] [Google Scholar]
- 22.Renier N et al. Mapping of Brain Activity by Automated Volume Analysis of Immediate Early Genes. Cell, doi: 10.1016/j.cell.2016.05.007 (2016). [DOI] [PMC free article] [PubMed] [Google Scholar]
- 23.Fung C et al. Cholinergic Submucosal Neurons Display Increased Excitability Following in Vivo Cholera Toxin Exposure in Mouse Ileum. Front Physiol 9, 260, doi: 10.3389/fphys.2018.00260 (2018). [DOI] [PMC free article] [PubMed] [Google Scholar]
- 24.Young AA Brainstem sensing of meal-related signals in energy homeostasis. Neuropharmacology 63, 31–45, doi: 10.1016/j.neuropharm.2012.03.019 (2012). [DOI] [PubMed] [Google Scholar]
- 25.Pavlov VA, Chavan SS & Tracey KJ Molecular and Functional Neuroscience in Immunity. Annual review of immunology 36, 783–812, doi: 10.1146/annurev-immunol-042617-053158 (2018). [DOI] [PMC free article] [PubMed] [Google Scholar]
- 26.Zeng WZ et al. PIEZOs mediate neuronal sensing of blood pressure and the baroreceptor reflex. Science 362, 464–467, doi: 10.1126/science.aau6324 (2018). [DOI] [PMC free article] [PubMed] [Google Scholar]
- 27.Berthoud HR, Jedrzejewska A & Powley TL Simultaneous labeling of vagal innervation of the gut and afferent projections from the visceral forebrain with dil injected into the dorsal vagal complex in the rat. J Comp Neurol 301, 65–79, doi: 10.1002/cne.903010107 (1990). [DOI] [PubMed] [Google Scholar]
- 28.Wang FB & Powley TL Topographic inventories of vagal afferents in gastrointestinal muscle. J Comp Neurol 421, 302–324 (2000). [PubMed] [Google Scholar]
- 29.Moriyama S et al. beta2-adrenergic receptor-mediated negative regulation of group 2 innate lymphoid cell responses. Science 359, 1056–1061, doi: 10.1126/science.aan4829 (2018). [DOI] [PubMed] [Google Scholar]
- 30.Matheis F et al. Adrenergic Signaling in Muscularis Macrophages Limits Infection-Induced Neuronal Loss. Cell 180, 64–78 e16, doi: 10.1016/j.cell.2019.12.002 (2020). [DOI] [PMC free article] [PubMed] [Google Scholar]
- 31.Zhang B et al. Hyperactivation of sympathetic nerves drives depletion of melanocyte stem cells. Nature 577, 676–681, doi: 10.1038/s41586-020-1935-3 (2020). [DOI] [PMC free article] [PubMed] [Google Scholar]
- 32.Lai NY et al. Gut-Innervating Nociceptor Neurons Regulate Peyer’s Patch Microfold Cells and SFB Levels to Mediate Salmonella Host Defense. Cell 180, 33–49 e22, doi: 10.1016/j.cell.2019.11.014 (2020). [DOI] [PMC free article] [PubMed] [Google Scholar]
- 33.Yadav VK et al. Lrp5 controls bone formation by inhibiting serotonin synthesis in the duodenum. Cell 135, 825–837, doi: 10.1016/j.cell.2008.09.059 (2008). [DOI] [PMC free article] [PubMed] [Google Scholar]
- 34.Gomes-Neto JC et al. A real-time PCR assay for accurate quantification of the individual members of the Altered Schaedler Flora microbiota in gnotobiotic mice. J Microbiol Methods 135, 52–62, doi: 10.1016/j.mimet.2017.02.003 (2017). [DOI] [PMC free article] [PubMed] [Google Scholar]
- 35.Bai L et al. Genetic Identification of Vagal Sensory Neurons That Control Feeding. Cell 179, 1129–1143 e1123, doi: 10.1016/j.cell.2019.10.031 (2019). [DOI] [PMC free article] [PubMed] [Google Scholar]
- 36.Ye L et al. Wiring and Molecular Features of Prefrontal Ensembles Representing Distinct Experiences. Cell 165, 1776–1788, doi: 10.1016/j.cell.2016.05.010 (2016). [DOI] [PMC free article] [PubMed] [Google Scholar]
- 37.Kennedy HS, Jones C 3rd & Caplazi P Comparison of standard laminectomy with an optimized ejection method for the removal of spinal cords from rats and mice. J Histotechnol 36, 86–91, doi: 10.1179/014788813X13756994210382 (2013). [DOI] [PMC free article] [PubMed] [Google Scholar]
- 38.Bray NL, Pimentel H, Melsted P & Pachter L Near-optimal probabilistic RNA-seq quantification. Nature biotechnology 34, 525–527, doi: 10.1038/nbt.3519 (2016). [DOI] [PubMed] [Google Scholar]
- 39.Love MI, Huber W & Anders S Moderated estimation of fold change and dispersion for RNA-seq data with DESeq2. Genome biology 15, 550, doi: 10.1186/s13059-014-0550-8 (2014). [DOI] [PMC free article] [PubMed] [Google Scholar]
- 40.Edgar RC Search and clustering orders of magnitude faster than BLAST. Bioinformatics 26, 2460–2461, doi: 10.1093/bioinformatics/btq461 (2010). [DOI] [PubMed] [Google Scholar]
- 41.Schloss PD et al. Introducing mothur: open-source, platform-independent, community-supported software for describing and comparing microbial communities. Applied and environmental microbiology 75, 7537–7541, doi: 10.1128/AEM.01541-09 (2009). [DOI] [PMC free article] [PubMed] [Google Scholar]
- 42.McMurdie PJ & Holmes S phyloseq: an R package for reproducible interactive analysis and graphics of microbiome census data. PloS one 8, e61217, doi: 10.1371/journal.pone.0061217 (2013). [DOI] [PMC free article] [PubMed] [Google Scholar]
- 43.Erturk A et al. Three-dimensional imaging of solvent-cleared organs using 3DISCO. Nature protocols 7, 1983–1995, doi: 10.1038/nprot.2012.119 (2012). [DOI] [PubMed] [Google Scholar]
- 44.Abe C et al. C1 neurons mediate a stress-induced anti-inflammatory reflex in mice. Nature neuroscience 20, 700–707, doi: 10.1038/nn.4526 (2017). [DOI] [PMC free article] [PubMed] [Google Scholar]
- 45.Haak BW et al. Impact of gut colonization with butyrate-producing microbiota on respiratory viral infection following allo-HCT. Blood 131, 2978–2986, doi: 10.1182/blood-2018-01-828996 (2018). [DOI] [PMC free article] [PubMed] [Google Scholar]
Associated Data
This section collects any data citations, data availability statements, or supplementary materials included in this article.