

Abstract
Background:
COVID-19, like every other pandemic, has imposed an unprecedented threat to doctors' physical and mental health. Literature in this area is sparse. The present study has been done to explore the knowledge, attitude, and behavior of doctors regarding this pandemic and how it influences their depression, anxiety, and stress level.
Materials and Methods:
This online survey has been done for 10 days. Data were collected on background characteristics, knowledge, attitude, and behavior of the respondents in a semi-structured pro forma, and psychiatric morbidity was measured by the Depression, Anxiety, and Stress Scale-21. A total of 152 complete responses have been received. The data were assessed using SPSS software.
Results:
Out of 152 study participants, 34.9% were depressed and 39.5% and 32.9% were having anxiety and stress, respectively. Significant predictors for psychiatric morbidities were experience in health sector, duty hours, use of protective measures, and altruistic coping. Multivariable logistic regression showed most of the factors to be significantly associated with depression, anxiety, and stress level.
Discussion:
Doctors who were working during COVID pandemic have a high prevalence of psychiatric morbidity. Age and having multiple comorbidities are significant predictive factors. Adequate protective measures should be warranted. Altruistic coping and a sense of greater goal are significant among the doctor community, in this pressing time. The doctors are pushing themselves to the best of their capacity and also protecting their patients' best interest. A large-scale, multicentric study will probably give a larger picture and will guide us for better service planning and delivery.
Keywords: Attitude and practice, comorbidities, COVID-19, online survey, stress and depression
INTRODUCTION
Starting as a mere local transmission from the Wuhan city of China, COVID-19 has become one of the major catastrophes in the last century, affecting the global socio-political scene. In the last week of March 2020, the World Health Organization (WHO) declared it as Public Health Emergency of International Concern (PHEIC), which is the sixth PHEIC under the International Health Regulations after H1N1 Influenza (2009), Polio (2014), Ebola in West Africa (2014), Zika (2016), and Ebola in the Democratic Republic of Congo (2019).[1,2] On February 11, 2020, the WHO has officially declared the COVID-19 as “pandemic” from the previous status of global health emergency.[3]
In the following months, Europe and the USA are devastated by its wrath and even with their highly developed health system, they are falling terribly as evident by the steep upwardly directed epidemic curve.[4] There are reports of escalating new cases and death rate, globally, and the Government of India imposed Complete Safety Restrictions. The cases have been detected from all the states, and West Bengal, being a bordering state and having its multicultural demography, is a fertile ground for the virus to spread faster, and all precautions for containment are being made from both government and nongovernmental sectors.[5,6]
It has been learned from the past experiences, whenever situations like these arise, health-care workers come to play a major role and push their limits every day. Doctors, being in the frontline of the system, take the brunt the most. Situation is further complicated due to complete uncertainty; lack of proper guidelines; unprepared health infrastructure; and fear, anxiety, stigma, prejudice, and marginalization toward the disease. Overall, doctors have a high prevalence of mental health morbidities, but the topic is very less researched.[7] The recent pandemic of COVID-19 has thrown serious challenges to health-care professionals. This situation exposed them to higher stress level, anxiety, and apprehension. Moreover, it affects their work output which, in the pipeline, affects the health-care delivery to the whole nation.[8,9]
There are few studies done on how situation like this affect their mental health. Previously, during severe acute respiratory syndrome outbreak, a study was done which found 26.6% prevalence of depression among doctors.[10] Just 2 weeks ago, a study from Wuhan, China, revealed 50.4% of depression, 44.6% of anxiety, 34.0% of insomnia, and 71.5% of distress among 1257 health-care workers.[11] There is no such published Indian study till date. To explore this gap, the plan for this study was made to assess the depression, anxiety, and stress among doctors during the corona outbreak and evaluate their attitude to this major disaster.
MATERIALS AND METHODS
Sample
This was a cross-sectional, observational study carried out on doctors in West Bengal. An online semi-structured questionnaire was developed, with a consent form attached to it. It started from March 28, 12:00 h, and ended on April 6, 23:59 h. The link of the questionnaire was sent through E-mails, WhatsApp, and other social media to the contacts of the investigators. The link was also posted in social media group comprised of only doctors. On receiving and clicking the link, the participants got auto directed to the information about the study and informed consent. Once they accepted to take the survey, they filled up the demographic details. Then, a set of several questions appeared sequentially, which the participants were to answer.
Instruments
The questionnaire was formed on three sections: the first section was for background data which included age, gender, place of practice, qualification, specialties, duration in health-care sectors, number of patients seeing, and comorbidities; the second section comprised of a set of questions prepared by expert opinion targeting attitude and knowledge regarding COVID-19. In the third section, the Depression, Anxiety, and Stress Scale (DASS)-21 was applied. The DASS-21 is based on three subscales of depression, stress, and anxiety, and each subscale consists of seven questions each. The rating of DASS subitems such as depression, anxiety, and stress can be rated as normal, mild, moderate, and extremely severe. Each item is scored in a self-rated Likert scale from 0 (didn't apply to me all) to 3 (much or mostly applied to me) in the past 1 week.[12] The scale does not cover several domains of depression such as sleep, appetite, and sexual functions, so it cannot be used as a diagnostic tool but can be applied as an aid to diagnostic tool as well as to measure treatment response. Both English and non-English versions have high internal consistency (Cronbach's alpha scores >0.7). The DASS scale has shorter version and longer version (comprising of 21 and 42 items, respectively). In DASS-21, the final score of each item is multiplied by two to obtain the final score.[13]
On piloting, it was found that it takes approximately five minutes to complete each form. Those forms with complete response were finally analysed. While collecting data, confidentiality and anonymity was maintained. It was assured that the interpretation of this study will not be utilized for commercial purposes. Anyone can opt out from the study if they don't want to submit the data in the midway of this survey. Collected data was checked for completeness and consistency. Data cleaning done and then data entered in the computer on Excel data sheets (Microsoft Excel, 2013).
SPSS version 25 (IBM Corp., Armonk, NY, USA) was used for statistical analysis. For comparisons between the groups, t-test was used for continuous variables and Chi-square tests were used for categorical variables. Statistical significance was determined at P < 0.05. Significant predictors were further analyzed using logistic regression.
RESULTS
Sample characteristics
The sample had a mean age of 42.05 (±12.19) years. Most of the participants were male (n = 119, 78.3%), practicing in urban background (n = 107, 70.3%), working in the government sector (n = 101, 66.4%), and having postgraduate qualification (n = 96, 63.2%) [Table 1].
Table 1.
Sociodemographic and clinical characteristics of the sample depression
| Variables | Total sample (n=152), n (%) | No depression (n=99), n (%) | Depression present (n=53), n (%) | χ2/t | P |
|---|---|---|---|---|---|
| Background characteristics | |||||
| Age, mean±SD | 42.05±12.19 | 44.04±12.902 | 38.34±9.798 | 2.810 | 0.006* |
| Gender | |||||
| Male | 119 (78.3) | 76 (76.8) | 43 (81.1) | 0.387 | 0.537 |
| Female | 33 (21.7) | 23 (23.2) | 10 (18.9) | ||
| Practicing area | |||||
| Urban | 107 (70.3) | 74 (74.7) | 33 (62.3) | 2.581 | 0.108 |
| Rural | 45 (29.7) | 25 (25.3) | 20 (37.7) | ||
| Working sector | |||||
| Government | 101 (66.4) | 61 (61.6) | 40 (75.5) | 2.972 | 0.850 |
| Nongovernment | 51 (33.6) | 38 (38.4) | 13 (24.5) | ||
| Qualification | |||||
| MBBS | 52 (34.2) | 29 (29.3) | 23 (43.4) | 5.820 | 0.667 |
| PG | 96 (63.2) | 66 (66.7) | 30 (56.6) | ||
| Superspecialty | 4 (2.6) | 4 (4) | 0 (0) | ||
| Specialty | |||||
| Nonspecialist | 44 (28.9) | 24 (24.2) | 20 (37.7) | 8.751 | 0.724 |
| Medicine and allied | 58 (38.2) | 43 (43.4) | 15 (28.3) | ||
| Surgery and allied | 33 (21.7) | 19 (19.2) | 14 (26.4) | ||
| Preparaclinical, administrative | 17 (11.2) | 13 (13.1) | 4 (7.5) | ||
| Years of experience (years), mean±SD | 17.93±12.1 | 19.94±12.60 | 14.19±10.143 | 2.861 | 0.005* |
| Comorbidities | |||||
| Diabetes only (T2DM) | 2 (1.3) | 0 (0.0) | 2 (3.8) | 15.218 | 0.03* |
| HTN only | 16 (10.5) | 14 (14.1) | 2 (3.8) | ||
| COPD only | 19 (12.5) | 13 (13.1) | 6 (11.3) | ||
| None | 9 (5.9) | 3 (3.0) | 6 (11.3) | ||
| Diabetes+HTN+COPD | 87 (57.2) | 58 (58.6) | 29 (54.7) | ||
| Diabetes+HTN | 9 (5.9) | 6 (6.1) | 3 (5.7) | ||
| Diabetes+COPD | 8 (5.4) | 5 (5.1) | 3 (5.7) | ||
| HTN+COPD | 2 (1.3) | 0 (0.0) | 2 (3.8) | ||
| Number of patient seen by you daily | |||||
| <10 | 27 (17.8) | 22 (22.2) | 5 (9.4) | 8.778 | 0.026* |
| 11-30 | 10 (6.6) | 7 (7.1) | 6 (6.5) | ||
| 31-50 | 53 (34.9) | 30 (30.3) | 23 (43.4) | ||
| >50 | 62 (40.7) | 40 (40.4) | 20 (37.7) | ||
| Knowledge, attitude, and practice characteristics | |||||
| When have you heard about COVID-19 disease | |||||
| December 2019 | 60 (38.8) | 45 (45.5) | 15 (28.3) | 4.590 | 0.204 |
| January 2020 | 75 (49.3) | 45 (45.5) | 30 (56.6) | ||
| February 2020 | 11 (7.3) | 6 (6.1) | 5 (9.4) | ||
| March 2020 | 7 (4.6) | 3 (3.0) | 3 (5.7) | ||
| Are you doing duty? | |||||
| Yes | 119 | 79 (79.8) | 40 (75.5) | 0.380 | 0.538 |
| No | 33 | 20 (20.2) | 13 (24.5) | ||
| How long doing duty | |||||
| <6 h | 40 (26.4) | 32 (32.3) | 8 (15.1) | 10.948 | 0.012* |
| 6-12 h | 57 (37.5) | 38 (38.4) | 19 (35.8) | ||
| >12 h | 25 (16.4) | 10 (10.1) | 15 (28.3) | ||
| Administrative jobs | 30 (19.7) | 19 (19.2) | 11 (20.8) | ||
| High-risk procedures | |||||
| Surgical | 36 (23) | 18 (18.2) | 18 (34.0) | 13.390 | 0.010* |
| Isolation ward | 7 (4.6) | 3 (3.0) | 4 (7.5) | ||
| CCU/ICU/ITU setup | 15 (9.9) | 9 (9.1) | 6 (11.3) | ||
| Fever clinic | 37 (24.3) | 22 (22.2) | 15 (28.3) | ||
| None | 57 (27.5) | 47 (47.5) | 10 (18.9) | ||
| The precautionary measures | |||||
| N 95 mask | 30 (19.7) | 20 (20.2) | 10 (18.9) | 3.967 | 0.265 |
| Surgical mask | 89 (58.6) | 53 (53.5) | 36 (67.9) | ||
| Triple-layered mask | 24 (15.8) | 19 (19.2) | 5 (9.4) | ||
| None of the above | 9 (5.9) | 7 (7.1) | 2 (3.8) | ||
| Knowledge, attitude, and practice characteristics | |||||
| Washing hands at regular interval | |||||
| Yes | 145 (95.4) | 97 (98.0) | 48 (90.6) | 4.319 | 0.041* |
| No | 7 (4.6) | 2 (2) | 5 (9.4) | ||
| How frequently washing hands | |||||
| Every 15 min and when required | 5 (3.3) | 4 (4.0) | 1 (1.9) | 4.696 | 0.005* |
| Every 30 min and when required | 22 (14.5) | 10 (10.1) | 12 (22.6) | ||
| Every 1 h and when required | 60 (39.5) | 41 (41.4) | 19 (35.8) | ||
| As and when required | 65 (42.8) | 44 (44.4) | 21 (39.6) | ||
| Feeling proud as doctor to fight against COVID-19 | |||||
| Yes | 132 (86.8) | 90 (90.9) | 42 (79.2) | 10.003 | 0.04* |
| No | 20 (13.2) | 9 (9.1) | 11 (20.8) | ||
| Have you been ostracized | |||||
| Yes | 32 (21.1) | 12 (12.1) | 20 (37.7) | 16.625 | 0.002* |
| No | 120 (78.9) | 87 (87.9) | 33 (62.3) | ||
*P<.05 was considered significant. SD – Standard deviation, HTN – Hypertension, COPD – Chronic obstructive pulmonary disease, ICU – Intensive care unit, T2DM – Type 2 diabetes mellitus, CCU – Critical care unit, ITU – Intensive therapy unit
Majority of the doctors are using a surgical mask (58.6%) and only few of them are using N95 masks (19.7%). The majority of them are using the mask for 2–6 h (47.4%) and 95.4% of the doctors are practicing hand hygiene (95.4%) at a regular interval. The doctors who participated in this survey are mostly washing their hands on an as-and-when-required basis (42.8%) by predominantly with soap and 70% alcohol-based sanitizer (77.0%). Only 24.3% of the participants have access to PPE in their setup and 11.2% are actually using it. Approximately 9.2% of the doctors are currently in quarantine. Only 2.6% of the doctors have come across a COVID-positive case. Among the participants, 86.8% are feeling proud to be a doctor while fighting against COVID-19. Unfortunately, 21.1% of the frontline warriors have been ostracized by friends, neighbor, and the society for working in the hospital for being exposed and spreading others [Table 1].
Depression
Among the 152 total samples, 53 (34.9%) doctors were depressed, among which 16 (10.5%) were mild and 22 (14.5%), 9 (5.9%), and 6 (3.9%) doctors were having moderate, severe, and very severe depression scores, respectively [Figure 1] Mean depression subscale score were found to be 8.37±8.93. [Table 2]. On bivariate analysis between nondepressed and depressed groups, statistically significant difference was observed for the associated factors such as comorbidities of the study participants (P = 0.03), daily patients' consultation number (P = 0.026), longer duty hours (P = 0.012), involvement in high-risk procedure (0.010), washing hands at a regular interval (P = 0.041), frequency of washing hands (P = 0.005), high self-esteem of profession (P = 0.040), and being ostracized (P = 0.02), whereas using N95 mask and working in this scenario had no statistical significance with the dependent variable [Table 1]. Age was significantly correlated with depression subscore.
Figure 1.
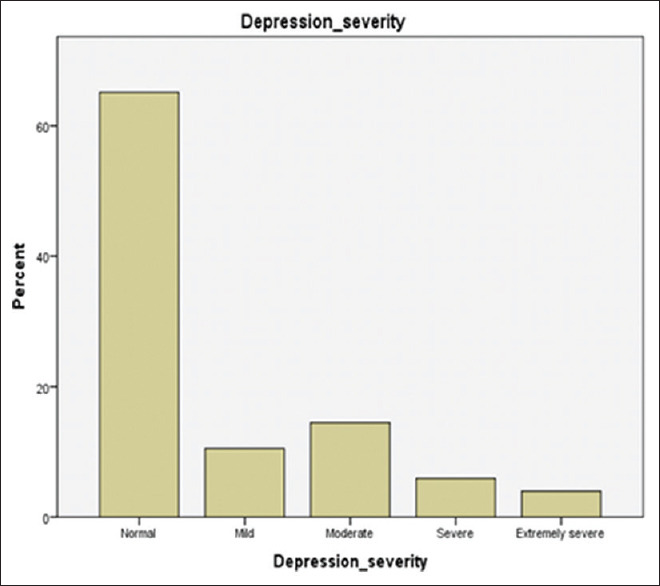
Depression severity among doctors
Table 2.
Mean score of Depression, Anxiety, and Stress scale subitems
| Variable | Mean±SD |
|---|---|
| Depression subscale total | 8.37±8.93 |
| Anxiety subscale total | 7.07±7.79 |
| Stress subscale total | 11.92±9.66 |
| DASS score total | 27.36±24.4 |
DASS – Depression, Anxiety, and Stress Scale; SD – Standard deviation
Anxiety
Out of the total 152 study participants, 60 (39.5%) were found to have any type of anxiety and 11 (7.2%), 27 (17.8%), 10 (6.6%), and 11 (7.2%) participants were having mild, moderate, severe, and extremely severe anxiety, respectively [Figure 2]. Mean anxiety subscale score were found to be 7.07±7.79 [Table 2]. Significant factors contributing to anxiety were practicing area (P = 0.047), working sector (P = 0.031), working hours (P = 0.014), high-risk procedure (P = 0.039), use of any hand sanitizer (P = 0.012), and having a history of being ostracized (P = 0.001) [Table 3].
Figure 2.

Anxiety severity among doctors
Table 3.
Sociodemographic and clinical characteristics of the sample anxiety
| Variables | Total sample (n=152), n (%) | No anxiety (n=92), n (%) | Anxiety present (n=60), n (%) | χ2/t | P |
|---|---|---|---|---|---|
| Background characteristics | |||||
| Age, mean±SD | 42.05±12.19 | 20.35±12.940 | 14.23±9.629 | 3.136 | 0.053 |
| Gender | 0.154 | 0.695 | |||
| Male | 119 (78.3) | 73 (79.3) | 46 (76.7) | ||
| Female | 33 (21.7) | 19 (20.7) | 14 (23.3) | ||
| Practicing area | 3.624 | 0.047* | |||
| Urban | 107 (70.3) | 70 (76.1) | 37 (61.7) | ||
| Rural | 45 (29.7) | 22 (23.9) | 23 (38.3) | ||
| Working sector | 4.634 | 0.031* | |||
| Government | 101 (66.4) | 55 (59.8) | 46 (76.7) | ||
| Nongovernment | 51 (33.6) | 37 (40.2) | 14 (23.3) | ||
| Qualification | 1.000 | 0.607 | |||
| MBBS | 52 (34.2) | 29 (31.5) | 23 (38.3) | ||
| PG | 96 (63.2) | 60 (65.2) | 36 (60.0) | ||
| Superspecialty | 4 (2.6) | 3 (3.3) | 1 (1.7) | ||
| Specialty | 2.372 | 0.499 | |||
| Nonspecialist | 44 (28.9) | 24 (26.1) | 20 (33.3) | ||
| Medicine and allied | 58 (38.2) | 39 (42.4) | 19 (31.7) | ||
| Surgery and allied | 33 (21.7) | 18 (19.6) | 15 (25.0) | ||
| Preparaclinical, administrative | 17 (11.2) | 11 (12.0) | 6 (10.0) | ||
| Years of experience (years), mean±SD | 17.93±12.1 | 20.35±12.94 | 14.23±9.629 | 3.136 | 0.049* |
| Comorbidities | 8.392 | 0.299 | |||
| Diabetes only (T2DM) | 2 (1.2) | 0 (0.0) | 2 (3.3) | ||
| HTN only | 16 (10.5) | 9 (9.8) | 7 (11.7) | ||
| COPD only | 19 (12.5) | 12 (13.0) | 7 (11.7) | ||
| None | 9 (5.9) | 4 (4.3) | 5 (8.3) | ||
| Diabetes + HTN + COPD | 86 (56.5) | 55 (59.89) | 31 (58.3) | ||
| Diabetes + HTN | 9 (5.9) | 6 (6.5) | 3 (5.0) | ||
| Diabetes + COPD | 8 (5.3) | 6 (6.5) | 2 (3.3) | ||
| HTN + COPD | 2 (1.2) | 0 (0.0) | 2 (3.3) | ||
| Number of patient seen by you daily | 3.796 | 0.434 | |||
| <10 | 27 (17.8) | 17 (18.5) | 10 (16.7) | ||
| 11-30 | 10 (6.6) | 5 (5.4) | 5 (8.3) | ||
| 31-50 | 53 (34.9) | 32 (34.8) | 19 (35.0) | ||
| >50 | 62 (40.8) | 38 (41.3) | 24 (40.0) | ||
| Knowledge, attitude, and practice characteristics | |||||
| When have you heard about COVID-19 disease | 3.653 | 0.989 | |||
| December 2019 | 59 (38.8) | 39 (42.4) | 21 (35.0) | ||
| Knowledge, attitude, and practice characteristics | |||||
| January 2020 | 75 (49.3) | 43 (46.7) | 32 (53.3) | ||
| February 2020 | 11 (7.3) | 6 (6.5) | 5 (8.3) | ||
| March 2020 | 7 (4.6) | 4 (4.3) | 3 (3.3) | ||
| Are you doing duty? | 0.171 | 0.095 | |||
| Yes | 117 (76.9) | 71 (77.2) | 48 (80.0) | ||
| No | 35 (23.1) | 21 (22.8) | 12 (20.0) | ||
| How long doing duty (h) | 10.605 | 0.014* | |||
| <6 h | 40 (26.3) | 31 (33.7) | 9 (15.0) | ||
| 6-12 h | 57 (37.5) | 31 (33.7) | 26 (43.4) | ||
| >12 h | 25 (16.5) | 10 (10.9) | 15 (25.0) | ||
| Administrative jobs | 30 (19.7) | 20 (21.7) | 10 (16.7) | ||
| High-risk procedures | 10.078 | 0.039* | |||
| Surgical | 36 (23) | 20 (21.7) | 16 (26.7) | ||
| Isolation ward | 7 (4.6) | 3 (3.3) | 4 (6.7) | ||
| CCU/ICU/ITU setup | 15 (9.9) | 5 (5.4) | 10 (16.7) | ||
| Fever clinic | 37 (24.3) | 22 (23.9) | 15 (25.0) | ||
| None | 57 (27.5) | 42 (45.7) | 15 (25.0) | ||
| The precautionary measures | 2.185 | 0.541 | |||
| N 95 mask | 30 (19.7) | 16 (17.4) | 14 (23.3) | ||
| Surgical mask | 89 (58.6) | 53 (57.6) | 36 (60.0) | ||
| Triple-layered mask | 24 (15.8) | 16 (17.4) | 8 (13.3) | ||
| None of the above | 9 (5.9) | 7 (7.6) | 2 (3.3) | ||
| Washing hands at regular interval | 4.134 | 0.388 | |||
| Yes | 144 (94.7) | 88 (95.7) | 57 (97.0) | ||
| No | 8 (5.3) | 4 (4.3) | 3 (3.0) | ||
| How frequently washing hands | 5.206 | 0.157 | |||
| Every 15 min and when required | 5 (3.3) | 4 (4.3) | 1 (1.7) | ||
| Every 30 min and when required | 22 (14.5) | 9 (9.8) | 13 (21.7) | ||
| Every 1 h and when required | 60 (39.5) | 36 (39.1) | 24 (40.0) | ||
| As and when required | 64 (42.1) | 43 (46.7) | 22 (36.7) | ||
| Any hand sanitizer | 7.944 | 0.012* | |||
| Soap | 5 (3.3) | 2 (2.2) | 3 (5.0) | ||
| Hand sanitizer with 70% alcohol | 16 (10.5) | 5 (5.4) | 11 (18.3) | ||
| Both soap and 70% alcohol-based hand sanitizer | 14 (9.2) | 10 (10.9) | 4 (6.7) | ||
| Your setup provides PPE | 6.224 | 0.183 | |||
| Yes | 37 (24.3) | 20 (21.7) | 17 (28.3) | ||
| No | 115 | 72 (78.3) | 43 (71.7) | ||
| Have you used PPE | 0.857 | 0.354 | |||
| Yes | 17 (11.2) | 10 (10.9) | 7 (11.7) | ||
| No | 135 (88.8) | 82 (89.1) | 53 (88.3) | ||
| Feeling proud as doctor to fight against COVID-19 | 7.975 | 0.093 | |||
| Yes | 132 (86.8) | 84 (91.3) | 48 (80.0) | ||
| No | 20 (13.2) | 8 (8.7) | 12 (20.0) | ||
| Have you been ostracized | 25.601 | 0.001* | |||
| Yes | 32 (21.1) | 9 (9.8) | 23 (38.3) | ||
| No | 120 (78.9) | 83 (90.2) | 37 (61.7) | ||
*P<.05 was considered significant. SD – Standard deviation, PPE – Personal protective equipment, HTN – Hypertension, COPD – Chronic obstructive pulmonary disease, ICU – Intensive care unit, T2DM – Type 2 diabetes mellitus, CCU – Critical care unit, ITU – Intensive therapy unit
Stress
Among the 152 total samples, 50 (32.9%) doctors were stressed, among which 20 (13.2%) were mild and 16 (10.5%), 11 (7.2%), and 3 (2.0%) doctors were having moderate, severe, and very severe depression scores, respectively [Figure 3]. Mean stress subscale score were found to be 11.92±9.66 [Table 2]. Variables related to background characteristics did not contribute to stress among the study participants, whereas washing hands (P = 0.042), altruistic feeling (P = 0.03), and perception of being ostracized (P = 0.001) had a significant association with doctors' anxiety [Table 4].
Figure 3.

Stress severity among doctors
Table 4.
Sociodemographic and clinical characteristics of the sample stress
| Variables | Total sample (n=152), n (%) | No stress (n=102), n (%) | Stress present (n=50), n (%) | χ2/t | P |
|---|---|---|---|---|---|
| Background characteristics | |||||
| Age, mean±SD | 42.05±912.19 | 43.55±13.29 | 39.00±8.889 | 0.024 | 0.066 |
| Gender | |||||
| Male | 119 (78.3) | 80 (78.4) | 39 (78.0) | 1.004 | 0.307 |
| Female | 33 (21.7) | 22 (21.6) | 11 (22.0) | ||
| Practicing area | |||||
| Urban | 107 (70.3) | 75 (73.5) | 32 (64.0) | 1.462 | 0.221 |
| Rural | 45 (29.7) | 27 (26.5) | 18 (36.0) | ||
| Working sector | |||||
| Government | 101 (66.4) | 66 (64.4) | 35 (70.0) | 2.461 | 0.652 |
| Nongovernment | 51 (33.6) | 36 (35.3) | 15 (30.0) | ||
| Qualification | |||||
| MBBS | 52 (34.2) | 33 (32.4) | 19 (38.0) | 5.374 | 0.717 |
| PG | 96 (63.2) | 65 (63.7) | 31 (62.0) | ||
| Superspecialty | 4 (2.6) | 4 (3.9) | 0 (0.0) | ||
| Specialty | |||||
| Nonspecialist | 44 (28.9) | 28 (27.5) | 16 (32.0) | 2.753 | 0.198 |
| Medicine and allied | 58 (38.2) | 40 (39.2) | 18 (36.0) | ||
| Surgery and allied | 33 (21.7) | 20 (19.6) | 13 (26.0) | ||
| Preparaclinical, administrative | 17 (11.2) | 14 (13.7) | 3 (6.0) | ||
| Years of experience (years), mean±SD | 17.93±12.1 | 19.20±13.086 | 15.36±9.341 | 1.853 | 0.030* |
| Comorbidities | |||||
| Diabetes only (T2DM) | 2 (1.3) | 0 (0.0) | 2 (4.0) | 9.766 | 0.135 |
| HTN only | 16 (10.5) | 11 (10.8) | 5 (10.0) | ||
| COPD only | 19 (12.5) | 12 (11.8) | 7 (14.0) | ||
| None | 9 (5.9) | 5 (4.9) | 4 (8.0) | ||
| Diabetes + HTN + COPD | 87 (57.3) | 62 (60.8) | 25 (50) | ||
| Diabetes + HTN | 9 (5.9) | 6 (5.9) | 3 (6.0) | ||
| Diabetes + COPD | 8 (5.3) | 6 (5.9) | 2 (4.0) | ||
| HTN + COPD | 2 (1.3) | 0 (0.0) | 1 (2.0) | ||
| Number of patient seen by you daily | |||||
| <10 | 27 (17.8) | 18 (17.6) | 9 (18.0) | 0.751 | 0.584 |
| 11-30 | 10 (6.5) | 6 (5.9) | 4 (8.0) | ||
| 31-50 | 53 (34.9) | 45 (34.3) | 8 (16.0) | ||
| >50 | 62 (40.8) | 43 (42.2) | 19 (38.0) | ||
| Knowledge, attitude, and practice characteristics | |||||
| When have you heard about COVID-19 disease | |||||
| December 2019 | 60 (39.5) | 43 (42.2) | 17 (34.0) | 5.380 | 0.749 |
| January 2020 | 75 (49.3) | 45 (44.1) | 30 (60.0) | ||
| February 2020 | 11 (7.3) | 8 (7.8) | 3 (6.0) | ||
| March 2020 | 6 (3.9) | 6 (5.9) | 0 (0.0) | ||
| Are you doing duty? | |||||
| Yes | 119 (78.3) | 75 (73.5) | 44 (88.0) | 10.988 | 0.530 |
| No | 33 (21.7) | 27 (26.5) | 6 (12.0) | ||
| High-risk procedures | |||||
| Surgical | 36 (23) | 21 (20.6) | 15 (30.0) | 6.779 | 0.669 |
| Isolation ward | 7 (4.6) | 4 (3.9) | 3 (6.0) | ||
| CCU/ICU/ITU setup | 15 (9.9) | 7 (6.9) | 8 (16.0) | ||
| Fever clinic | 37 (24.3) | 27 (26.5) | 10 (20.0) | ||
| None | 57 (27.5) | 43 (42.2) | 14 (28.0) | ||
| The precautionary measures | |||||
| N 95 mask | 30 (19.7) | 20 (19.6) | 10 (20.0) | 0.769 | 0.538 |
| Surgical mask | 89 (58.6) | 58 (56.9) | 31 (62.0) | ||
| Triple-layered mask | 24 (15.8) | 17 (16.7) | 7 (14.0) | ||
| None of the above | 9 (5.9) | 7 (6.9) | 2 (4.0) | ||
| How frequently washing your hand? | |||||
| Every 15 min and when required | 5 (3.3) | 4 (3.9) | 1 (2.0) | 8.177 | 0.042* |
| Every 30 min and when required | 22 (14.5) | 9 (8.8) | 13 (26.0) | ||
| Every 1 h and when required | 60 (39.5) | 43 (42.2) | 17 (28.0) | ||
| As and when required | 65 (42.8) | 46 (45.1) | 19 (38.0) | ||
| Are you feeling proud? | |||||
| Yes | 132 (86.8) | 92 (90.2) | 40 (80.0) | 3.053 | 0.030* |
| No | 20 (13.2) | 10 (9.8) | 10 (20.0) | ||
| Have you been ostracized? | |||||
| Yes | 32 (21.5) | 11 (10.8) | 21 (42.0) | 23.197 | 0.001* |
| No | 120 (78.9) | 91 (89.2) | 29 (58.0) | ||
*P<.05 was considered significant. SD – Standard deviation, HTN – Hypertension, COPD – Chronic obstructive pulmonary disease, ICU – Intensive care unit, T2DM – Type 2 diabetes mellitus, CCU – Critical care unit, ITU – Intensive therapy unit
Regression data
Taking into considerations the significant predictors and running the logistic regression, the model was found fit with Nagelkerke R2 value of 37.6%. The results revealed that being involved in high-risk procedures such as surgery (adjusted odds ratio [AOR] 6.625; 95% confidence interval [CI]) and providing service in fever clinics (AOR 3.848; 95% CI) had higher odds of depression among the study participants. In addition, the feeling of ostracized had a significant association with depression when adjusted for all other factors (AOR: 0.005; 95% CI).
For anxiety among the study participants, the significant predictors on binary logistic regression were found to be being involved in high-risk procedures such as rendering service in isolation ward (AOR 6.660; 95% CI), use of 70% alcohol-based hand sanitizer (AOR 4.058; 95% CI), and being ostracized in workplace (AOR 5.631; CI 95%); the model was found fit with Nagelkerke R2 value of 35.2%.
Those study participants found having stress also felt ostracized while working as predicted by the regression model (AOR 5.770; 95% CI), with Nagelkerke R2 value of the model being 18.6%.
DISCUSSION
Our results revealed a 35% prevalence of depressive symptoms during the COVID-19 outbreak. The stress and anxiety symptoms were found to be present in 39.5% and 33% of doctors, respectively. Earlier studies addressing the prevalence of depression among doctors reported a rate of 26.6%. That study was from Korea, done during Middle East respiratory syndrome outbreak, and the sample was low, only among 64 doctors.[10] No such studies like ours have been done in India. Even if we exclude the mild subgroup of depression, anxiety, and stress symptoms, still around 10%–15% prevalence rate arises, which is surely alarming.[11]
Surprisingly, 42.8% of the doctors in this survey have one or more comorbidities. Among the frontline warriors, 5.9% have all the three major comorbidities that not only show their poor overall health but also it means that they are in high-risk category when being infected by novel coronavirus. Majority of them were giving duties for 6–12 h, which is a positive finding, but at the same time, we have to keep in mind that our study is done during an early phase of the epidemic. As more time will pass, more doctors will be in quarantine and that may result higher duty hours on the working doctors, which may further worsen their overall mental health.[14] Only 39.5% of the participants were aware of the COVID-19 in December, but majority of them came to know about this in January 2020. The 62.5% doctors are doing high-risk duties (fever clinic, isolation ward etc) and that was the key indicative factor for their higher psychiatric morbidity. In April, 2020, in a study on 500 health care workers from Singapore, 14.5%, 8.9% and 6.6% participants screened positive for anxiety, depression, and stress respectively, and also and 7.7% were positive for clinical concern of post traumatic stress disorder.[15] In a country like India more psychiatric morbidity is expected which is reflected in our study.
CONCLUSION
To conclude, as this study reveals, more awareness should be there among doctor community and further long-term study should be planned. Specific screening strategy should be applied for these frontline workers as adverse mental health condition will further affect their service delivery and subsequent patient service. Proper measures should be taken to reduce the longer duty hours so that it does not overburden the doctors.
As the COVID-19 epidemic continues to sweep, our findings will be pertinent for the planning and development of a inclusive psychological support strategy in a developing country like India.
Financial support and sponsorship
Nil.
Conflicts of interest
There are no conflicts of interest.
REFERENCES
- 1.Eurosurveillance Editorial Team. Note from the editors: World Health Organization declares novel coronavirus (2019-nCoV) sixth public health emergency of international concern. Eurosurveillance. 2020;25:200131e. doi: 10.2807/1560-7917.ES.2020.25.5.200131e. [DOI] [PMC free article] [PubMed] [Google Scholar]
- 2.World Health Organization. Coronavirus Disease 2019 (COVID-19) Situation Report-64. World Health Organization; 2020. [Last accessed on 2020 Apr 11]. Available from: https://wwwwhoint/docs/default-source/coronaviruse/situation-reports/20200324-sitrep-64-covid-19pdfsfvrsn=703b2c40_2 . [Google Scholar]
- 3.World Health Organization. WHO Director-General's Remarks at the Media Briefing on COVID-2019 Outbreak. World Health Organization; 2020. [Last accessed on 2020 Apr 11]. Available from: https://wwwwhoint/dg/speeches/detail/whodirector-general-s-remarks-at-the-media-briefing-on-covid2019-outbreak-on-14-february-2020 . [Google Scholar]
- 4.Khan S, Siddique R, Ali A, Bai Q, Li Z, Li H, et al. The spread of novel coronavirus has created an alarming situation worldwide. J Infect Public Health. 2020 doi: 10.1016/j.jiph.2020.03.005. pii: S1876-0341(20)30405-6. [DOI] [PMC free article] [PubMed] [Google Scholar]
- 5.Grech V. Unknown unknowns – COVID-19 and potential global mortality. Early Hum Dev. 2020;144:105026. doi: 10.1016/j.earlhumdev.2020.105026. [DOI] [PMC free article] [PubMed] [Google Scholar] [Retracted]
- 6.IJMR Research Articles on Coronavirus India & COVID-19. Special Issue on Coronavirus India & COVID-19. [Last accessed on 2020 Apr 11]. Available from: https://icmrnicin/content/covid-19 .
- 7.Misra A. Doctors and healthcare workers at frontline of COVID 19 epidemic: Admiration, a pat on the back, and need for extreme caution. Diabetes Metab Syndr. 2020;14:255–6. doi: 10.1016/j.dsx.2020.03.006. [DOI] [PMC free article] [PubMed] [Google Scholar]
- 8.Chatterjee SS, Malathesh BC, Mukherjee A. Impact of COVID-19 pandemic on pre-existing mental health problems. Asian J Psychiatry. 2020 Apr 18; doi: 10.1016/j.ajp.2020.102071. [DOI] [PMC free article] [PubMed] [Google Scholar]
- 9.Ferioli M, Cisternino C, Leo V, Pisani L, Palange P, Nava S. Protecting healthcare workers from SARS-CoV-2 infection: Practical indications. Eur Respir Rev. 2020:29. doi: 10.1183/16000617.0068-2020. pii: 200068. [DOI] [PMC free article] [PubMed] [Google Scholar]
- 10.Um DH, Kim JS, Lee HW, Lee SH. Psychological effects on medical doctors from the Middle East Respiratory Syndrome (MERS) outbreak: A comparison of whether they worked at the MERS occurred hospital or not, and whether they participated in MERS diagnosis and treatment. J Korean Neuropsychiat Assoc. 2017;56:28–34. [Google Scholar]
- 11.Lai J, Ma S, Wang Y, Cai Z, Hu J, Wei N, et al. Factors associated with mental health outcomes among health care workers exposed to Coronavirus disease 2019. JAMA Network Open. 2020;3:e203976. doi: 10.1001/jamanetworkopen.2020.3976. [DOI] [PMC free article] [PubMed] [Google Scholar]
- 12.Lovibond PF, Lovibond SH. The structure of negative emotional states: Comparison of the Depression Anxiety Stress Scales (DASS) with the Beck Depression and Anxiety Inventories. Behav Res Ther. 1995;33:335–43. doi: 10.1016/0005-7967(94)00075-u. [DOI] [PubMed] [Google Scholar]
- 13.Antony MM, Bieling PJ, Cox BJ, Enns MW, Swinson RP. Psychometric properties of the 42-item and 21-item versions of the depression anxiety stress scales in clinical groups and a community sample. Psychol Assess. 1998;10:176–81. [Google Scholar]
- 14.Ogawa R, Seo E, Maeno T, Ito M, Sanuki M, Maeno T. The relationship between long working hours and depression among first-year residents in Japan. BMC Med Educ. 2018;18:50. doi: 10.1186/s12909-018-1171-9. [DOI] [PMC free article] [PubMed] [Google Scholar]
- 15.Tan BY, Chew NW, Lee GK, Jing M, Goh Y, Yeo LL, et al. Psychological Impact of the COVID-19 Pandemic on Health Care Workers in Singapore. Ann Int Med. 2020 doi: 10.7326/M20-1083. [DOI] [PMC free article] [PubMed] [Google Scholar]