

Abstract
Cancer genomics studies have nominated thousands of putative cancer driver genes1; a major challenge is to develop high-throughput and accurate models to define their functions. Here we devised a scalable cancer spheroid model and performed genome-wide CRISPR screens in 2D-monolayers and 3D lung cancer spheroids. CRISPR phenotypes in 3D more accurately recapitulate those of in vivo tumors, and genes with differential sensitivities between 2D and 3D are strongly enriched for significant mutations in lung cancers. These analyses also revealed novel drivers essential for cancer growth in 3D and in vivo, but not in 2D. Notably, we discovered that CPD (Carboxypeptidase D) is responsible for removal of a c-terminal RKRR motif2 of IGF1R α-chain, critical for receptor activity. CPD expression correlates with patient outcomes in lung cancer, and loss of CPD reduced tumor growth. Our results reveal key differences between 2D and 3D cancer models, and establish a generalizable strategy to perform CRISPR screens in spheroids to uncover cancer vulnerabilities.
MAIN
Despite the vast increase in the catalog of mutations observed across diverse cancer types (the ‘long tail’)1, it is often unclear which mutations are functional cancer drivers. Therefore, a central challenge is to scalably investigate these genes in relevant cancer models to assign causality and identify cancer-specific vulnerabilities.
Existing in vitro and in vivo models are useful for defining the biological properties of cancer3–7, but each has limitations. Genetically-engineered mouse models recapitulate tumor growth and microenvironment, but are limited by scalability, time, and cost8. Xenograft-based models are limited in scale, and can be difficult to edit in vitro. Genome-scale investigation of cancer growth and drug sensitivity has largely relied on in vitro 2D cell culture9–12, which lacks many features of disease, such as hypoxia13, altered cell-cell contacts14 and re-wired metabolism15. In vitro organoid models alleviate some of these concerns3,16, but are much less scalable.
CRISPR has enabled dramatically improved genetic screens in in vitro and in vivo cancer models9,11,12,17–19. Extraordinary efforts such as DepMap have characterized cancer dependencies using genome-scale CRISPR screens in hundreds of cell lines, discovering novel cancer drivers10,20–22. Nonetheless, it has been difficult to evaluate how differences in culture systems affect the ability to accurately uncover cancer drivers in vivo.
Here we devised a scalable method to propagate lung adenocarcinoma spheroids, and performed genome-wide CRISPR screens both in 2D monolayers and 3D spheroids. Growth phenotypes in 3D more accurately resembled those observed in tumors. Furthermore, genes with differentially stronger effects in 3D were enriched for significant mutations in human lung cancers. Among these genes, we identified CPD, a poorly characterized carboxypeptidase, as an important enzyme for IGF1R maturation. Together, these results demonstrate a strategy for genome-scale CRISPR screens in 3D spheroids to identify actionable cancer vulnerabilities for cancers.
3D phenotypes better reflect cancer dependencies
While 2D monolayer CRISPR screens have produced a wealth of information9–12,23, they often fail to replicate key aspects of tumor biology24. A striking illustration of this comes from observing phenotypes measured across >500 screens from the DepMap project. Although this resource has revealed a host of valuable biological findings10,20–22, < 1% of the top 1000 hits show a positive growth effect (Fig. 1a). Indeed, even inactivation of known tumor suppressor genes often show negative phenotypes (Fig. 1b).
Figure 1. Genome-wide screens in 3D improve detection of cancer genes/pathways compared to 2D.

a. % positive hits in top 1000 hits in the DepMap dataset10. Each point represents a cell line.
b. Median CERES effects of oncogenes and tumor suppressors (TSG) (annotated in COSMIC30) among top 1000 hits of 517 DepMap cell lines; each data point represents a cell line.
c. Schematic for CRISPR screens in H23 cells.
d. Distributions of phenotypes. Y axis; absolute T-score, X axis; effect size of each gene (see Methods). Dot size represents absolute T-score.
e. Phenotypes for oncogenes and TSGs in top 1000 hits in each condition. P values calculated using two-sided t-test.
f. Enriched pathways among the top 1000 hits from each condition analyzed using PANTHER Overrepresentation Test (see Methods). Significance of enriched pathways were measured with Fisher’s Exact test and the Benjamini-Hochberg False Discovery Rate (FDR) were subsequently computed (x-axis). # genes in enriched pathways marked at right.
In all boxplots, box limits mark upper/lower quartiles; whiskers, 1.5x interquartile range; points, outliers.
We sought to develop a scalable 3D spheroid system to enable high-throughput screens that more closely approximate in vivo cancers. We optimized seeding density and methylcellulose concentrations (Extended Data Fig. 1a, Supplementary Video 1, see Methods) to allow propagation of ~200 million cells in 3D spheroids in low attachment plates. This enabled us to perform genome-wide CRISPR screens in H23 lung adenocarcinoma cells grown in either 2D monolayers or 3D spheroids (Fig. 1c) using our custom sgRNA library25. Since H23 cells contain a KRAS G12C mutation, we also screened with ARS-85326–28, a cysteine-reactive KRAS inhibitor which often has stronger effect in 3D29.
3D spheroid models improve detection of TSG/oncogenes
Reproducibility and quality of 3D screening data was comparable to 2D (Extended Data Fig. 1b-d, Supplementary Table 1), and it was immediately clear that CRISPR screens in 3D uncovered many more positive growth phenotypes, whereas in 2D most hits have negative phenotypes (Fig. 1d). This became more apparent when we examined genes with differential effects in 3D by normalizing 3D phenotypes using the corresponding 2D phenotypes (3D/2D) (see Methods). We next analyzed phenotypes for oncogenes and tumor suppressor genes (TSGs) annotated in the COSMIC database30 within the top 1000 hits in 2D or in 3D conditions. Both groups were similar in 2D, showing negative median growth phenotypes (Fig. 1e). Remarkably, in 3D spheroids oncogenes and TSGs have significantly different behaviors, with knockout of TSGs showing more positive growth phenotypes; this was more clear when the 3D/2D phenotype was considered (Fig. 1e, Extended Data Fig. 1e).
Pathway enrichment analysis revealed a distinct set of cancer-specific pathways such as p53 and Ras (known drivers in H23 cells) were enriched among hits in 3D and 3D/2D phenotypes, whereas in 2D hits were generally related to common essential cellular functions such as DNA replication (Fig. 1f). Together, these data suggest that screens in 3D more accurately capture features of cancer genes/pathways (Extended Data Fig. 1f).
Genes with differential 3D phenotypes are frequently mutated in cancer
We further investigated the phenotypes for genes frequently mutated in lung adenocarcinoma and squamous cell carcinoma31 (hereafter, ‘Pan-lung’). When genes were sorted by the absolute value of their phenotypic strength, inactivation of the 10 most frequently mutated genes in the Pan-lung cancer cohort31 showed weaker and more widely distributed effects in 2D (Extended Data Fig. 1g, Supplementary Table 2). In contrast, in 3D spheroids, many of these frequently mutated genes showed stronger phenotypes. Strikingly, the 3D/2D phenotypes showed a further improved ability to detect strong phenotypes for frequently mutated lung cancer genes. This is consistent with the pathway enrichment analysis above, and suggests that analysis of genes with differentially strong effects in 3D may increase the power to identify cancer drivers.
To systematically confirm this, we compared absolute CRISPR phenotypes (sorted by phenotypic strength) against the cumulative sum of significance of Pan-lung cancer mutations31 (Fig. 2a, Supplementary Table 3). Again, genes with stronger phenotypes in 3D, and even more so in 3D/2D, were enriched for significant lung cancer mutations. We reasoned that two factors likely contribute to this improvement. First, normalizing 3D with 2D phenotypes may unmask cancer-specific genes by minimizing the otherwise dominating effects of core-essential genes (e.g. ribosomes), likely critical for both 2D and 3D growth (Extended Data Fig. 1g). Second, as previously suggested32, 3D spheroids are more likely to mimic in vivo tumors.
Figure 2. Genes with differential 3D/2D phenotypes are enriched for significantly mutated lung cancer genes.

a. Cumulative sum of the significance of 11,249 Pan-lung cancer genes from 1,144 lung cancer patients31,51 measured by MutSig2CV31 displayed on y-axis. X-axis; phenotypes sorted by strength in 2D, 3D, or 3D/2D. Top 3,000 genes shown.
b. Schematic for batch-retest CRISPR screens.
c. Comparisons between in vitro and in vivo phenotypes in the H23 batch-retest screens. Data fit by linear regression (blue line); 95% confidence intervals marked (shaded bands).
d. Significance of 744 Pan-lung cancer genes measured by MutSig2CV31 displayed as cumulative sum plots against genes sorted by absolute values of 3D/2D phenotypes in H23 cells, average 3D/2D phenotypes across 10 lung cancer lines, and H23 in vivo/2D phenotypes in batch-retest screens.
Importantly, additional genome-wide screens in H1975 and H2009 lung cancer lines confirmed key advantages of 3D spheroids, including improved detection of cancer pathways and identification of the known drivers for each of these lines (EGFR/PI3K, and p53/KRAS, respectively, Extended Data Fig. 2,3, Supplementary Discussion).
3D spheroids more closely match tumor xenograft models
To systematically compare CRISPR screens in 2D monolayers, 3D spheroids, and tumor xenografts, we generated a small batch-retest sgRNA library targeting 911 top hits with differential 3D growth effects in our genome-wide screens (Fig. 2b, Supplementary Table 4). We transduced this library into H23 cells and compared growth in subcutaneous xenograft tumors to 2D and 3D cultures. We optimized a protocol (see Methods) for in vivo CRISPR screening, and obtained highly reproducible data from tumor xenografts (Extended Data Fig. 4a,b, Supplementary Table 5). Strikingly, phenotypes of genes in 3D were much better correlated with those in mouse xenograft compared to 2D screens (Fig. 2c, Supplementary Discussion).
To search for common 3D-selective vulnerabilities in lung adenocarcinoma, we used the same batch-retest library to perform 2D and 3D screens across multiple cancer lines. We again observed marked differences between 2D and 3D in all lines (Supplementary Table 5). Averaging 3D/2D phenotypes across 10 cell lines further increased detection of significant mutations observed in lung cancer patients compared to phenotypes from H23 cell line alone (Fig. 2d). Interestingly, comparison of in vivo phenotypes to those in 2D (in vivo/2D) in H23 cells also increased detection of significant mutations compared to the in vitro 3D/2D phenotypes. Notably, top sensitizing hits from the averaged 3D/2D phenotypes include several known regulators of RAS-MAPK pathways33 such as GRB2, SHOC2, PTPN11/SHP2, GAB1, and MAPK1.
CPD module shows selective 3D growth effects
Given that genes with strong 3D/2D phenotypes are enriched for frequent lung cancer mutations, we reasoned these could include novel therapeutic targets. To identify such targets, we defined functional gene moduled based on their correlated phenotypes in DepMap22 and examined their phenotypes. Simultaneous disenrichment of multiple genes from the same functional group should help define vulnerabilities within pathways/complexes; indeed we identified a number of differentially enriched modules from expected genes, including KRAS, mTOR, and Hippo pathways (Supplementary Discussion).
Notably, a module comprised of genes correlated with CPD was the most strongly disenriched in the 3D/2D phenotype (Fig. 3a, Extended Data Fig. 4c), and showed strong synthetic lethality with the KRAS G12C inhibitor specifically in 3D. This suggested that CPD and its functional interactors could be promising therapeutic targets. CPD is a poorly characterized member of the metallocarboxypeptidase family that cleaves C-terminal arginines and lysines from polypeptides34; it is localized in the trans-Golgi network (TGN)35. CPD is correlated with FURIN, ATP2C1, IGF1R, MET, and GAB1 in a functional module (Fig. 3b,c, Extended Data Fig. 4d-f), but not with an olfactory receptor control gene. Given that FURIN and ATP2C1 are critical for processing of IGF1R and MET in the TGN36–38, we hypothesized that CPD might play a related role.
Figure 3. CPD module is critical for 3D spheroid growth and IGF1R function.
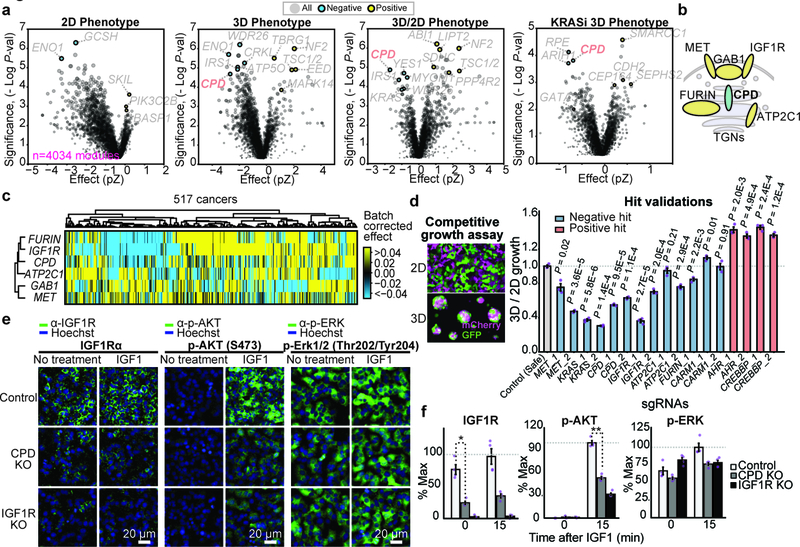
a. Top negative modules (blue). Top protective modules (yellow). Y axis; significance of enrichment for co-essential modules (P values, two-sided Mann-Whitney U test). X axis; average gene effects of CERES modules (see Methods).
b. Genes in the CPD co-essential module
c. Cluster map showing batch-corrected CERES gene effects for CPD module.
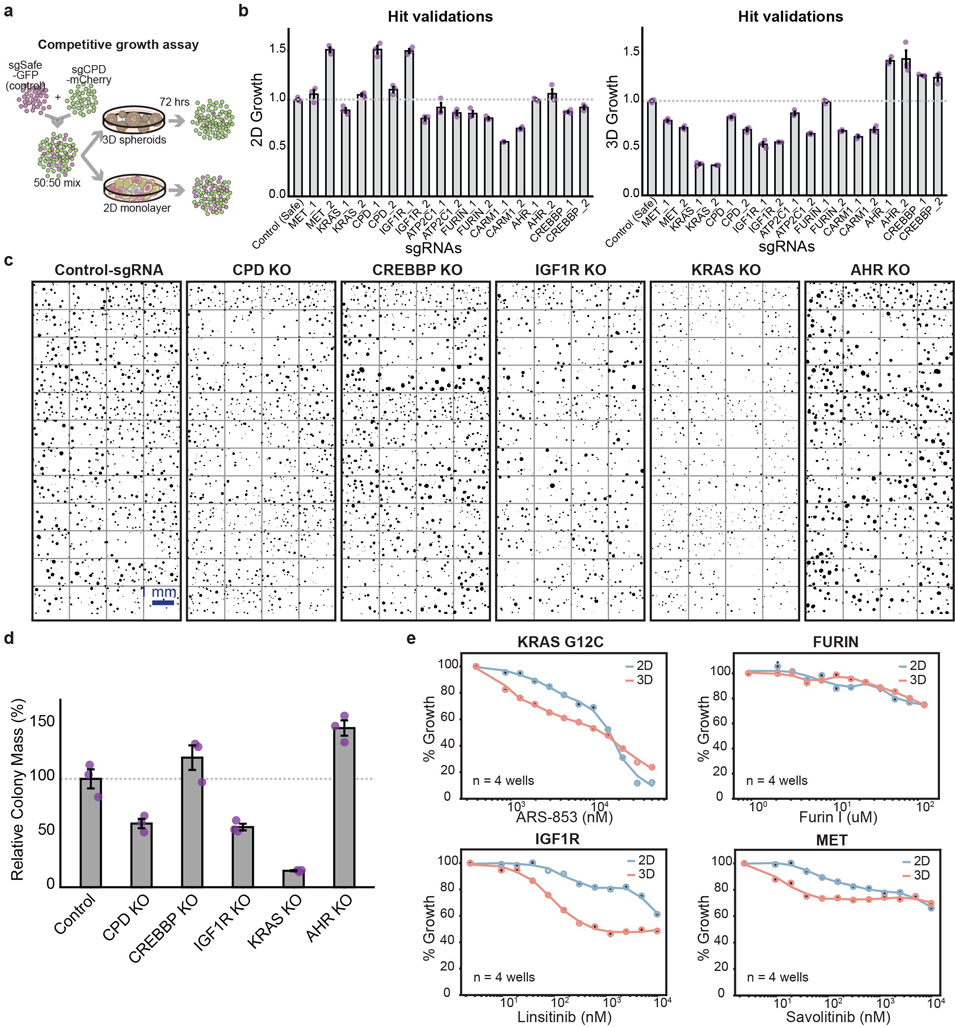
d. CPD module and selected top 3D/2D hits were validated with individual sgRNAs in competitive growth assays (see Methods). (n=3, P values, two-sided t-test between the control and gene-targeting sgRNAs, mean±s.e.m.).
e. Control, CPD KO, and IGF1R KO H23 cells grown in 2D were stimulated with IGF1 (100 ng/ml) for 15 min and levels of IGF1R and activities of downstream effectors measured by IF.
f. Quantitation of IF in e. *P=6.4E-4, **P=1.24E-5 (n=4, two-sided t-test, mean±s.e.m.)
To interrogate interactions within the CPD module in H23 cells, we measured all pairwise genetic interactions of 145 selected genes with strong 3D/2D phenotypes using CRISPR Double Knockout (CDKO) screening39 (Extended Data Fig. 5, Supplementary Table 6, 7). Similar to their behavior in DepMap, genetic interaction patterns of FURIN and IGF1R showed strong correlation with those of CPD.
Given the strong 3D/2D phenotypes of genes within the CPD module, we validated individual genes within the CPD module along with additional strong hits using competitive growth assays and small molecule inhibitors (Fig. 3d, Extended Data Fig. 6). We also observed that inducible knock-down of CPD in vitro in established H23 3D spheroids utilizing tet-on dCas9-KRAB17 markedly reduced growth of spheroids (Extended Data Fig. 7), suggesting that targeting CPD can have an impact on further growth of established spheroids.
IGF1R signaling is inhibited by CPD deletion
Since our data suggested CPD functionally interacts with IGF1R, we examined how CPD deletion affected IGF1R signaling pathways. We first measured protein levels of IGF1R and phosphorylation of its downstream effectors, AKT and ERK1/2 following IGF1 ligand treatment (Fig. 3e,f) in H23 cells grown in 2D. Strikingly, we observed significant reduction of IGF1R protein levels and phospho-AKT in CPD deleted H23 cells compared to control cells. In contrast, phospho-ERK½ levels were high and unchanged, likely due to constitutively active KRAS in H23 cells. Levels of IGF1R were also significantly reduced in CPD deleted H23 spheroids (Fig. 3g,h). In addition, CPD deletion reduced IGF1R and phospho-AKT upon IGF1 addition in H322, A549, and H358 cells (Extended Data Fig. 8). Lastly, we found that the effect of CPD deletion can be rescued by treating H23 cells with excess IGF1, but not by EGF or HGF (Extended Data Fig. 9a,b), suggesting much of the 3D-selective CPD knockout phenotype can be attributed to its regulation of IGF1R.
CPD removes c-terminal RKRR motif of IGF1R α-chain
Since CPD is a carboxypeptidase, we considered whether IGF1R might be a substrate. IGF1R is translated as a single polypeptide (pro-IGF1R), cleaved by FURIN into α- and β-chains2 (Fig. 4a). pro-IGF1R does not end in lysine or arginine, and thus should not be a substrate for CPD. Interestingly, FURIN cleaves pro-IGF1R immediately after a central RKRR motif2,40, which would leave these four positively charged amino acids at the C-terminus of α-chain, creating a potential CPD substrate.
Figure 4. CPD is a carboxypeptidase for IGF1R α-chain and loss of CPD inhibits in vivo tumor growth.
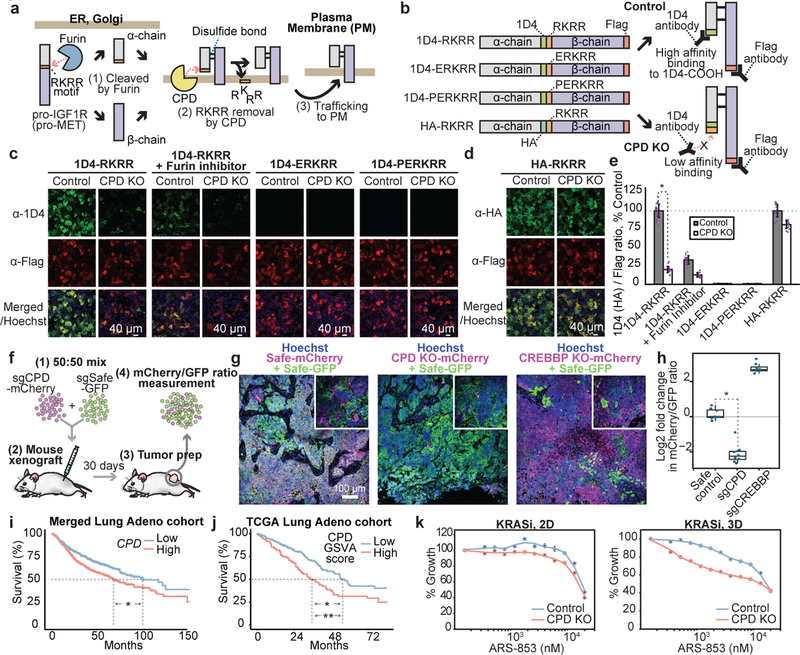
a. Proposed model of CPD-IGF1R interaction.
b. 1D4 reporters to test model in a (see Methods).
c. 1D4 and Flag IF levels from the 1D4 reporters measured in control or CPD KO 2D H23 cells, untreated or treated with FURIN inhibitor.
d. IF of HA-RKRR reporter in control or CPD KO H23 cells
e. Ratios of ID4 to Flag signals relative to the control 1D4-RKRR or to the control HA-RKRR for conditions in c and d. *P=1.38E-39 using two-sided t-test (n=19,30,18,12,20,21,18,18,18,18 from left to right, mean±s.d.)
f. Schematic for the competitive tumor growth assay (see Methods).
g. IF images of mCherry and GFP signal in Day30 tumor sections. 10x (larger images), 20x, inset. IF experiments repeated on two tumors/condition.
h. Changes of mCherry/GFP ratios between Day0 and Day30 (see Methods). *P=4.3E-39, (n=8 tumors/group, two-sided t-test). Center lines, median; box limits, upper and lower quartiles; whiskers, 1.5x interquartile range; points, outliers.
i. A Kaplan Meier (KM) plot of lung adenocarcinoma patients with high or low CPD expression. A median split was used and curve separation assessed by two-sided log-rank test (see Methods). n=1106, *P<0.0001
j. Variation of the set of genes downregulated by CPD deletion in H23 spheroids were scored by Gene Set Variation Analysis (CPD GSVA score, see Methods). KM plot for survival in 479 lung adenocarcinoma patients,divided into two groups with high or low CPD GSVA scores. Curve separation assessed by two-sided log-rank test (*P=9E-5) and Cox Proportional Hazard test (**P=7.68E-4).
k. CPD deletion sensitizes H23 cells to ARS-853, a KRAS G12C inhibitor. H23 cells with control sgRNA or CPD sgRNA treated with indicated doses of ARS-853 for 72 hours in 2D or 3D. Live cells quantified using alamar blue (n=4, mean±s.e.m.).
To test whether the RKRR motif is removed by CPD, we developed an assay to measure appearance of the 1D4 epitope41. Utilizing the Rho1D4 antibody, which requires a free carboxylate group for binding, we could detect the presence of the 1D4 epitope specifically at the C-terminus of a protein. We thus created an IGF1R reporter with an 1D4 epitope inserted immediately upstream of the RKRR motif (Fig. 4b). A flag epitope on the β-chain measured total protein levels.
When we transduced control H23 cells with the reporter, we observed strong 1D4 and flag signals, suggesting that RKRR is removed and the 1D4 epitope is exposed at the C-terminus of α-chain (Fig. 4c,e). Remarkably, deletion of CPD dramatically reduced 1D4 staining whereas total flag-IGF1R remained unchanged, suggesting that CPD removes the RKRR motif. Consistent with this, a FURIN inhibitor reduces 1D4 signal in both control and CPD deleted cells; this should prevent cleavage of pro-IGF1R and exposure of the RKRR motif. Insertion of even a single amino acid between the 1D4 and RKRR motif diminished the 1D4 signal, demonstrating the precise requirement for the removal of RKRR. A IGF1R reporter with a control HA epitope upstream of RKRR showed strong HA signal in both control and CPD deleted cells (Fig. 4d,e). Similarly, CPD-mediated removal of the RKRR motif was observed in H322 and A549 cells (Extended Data Fig. 9c,d). Together, these data demonstrate that CPD is a carboxypeptidase required for IGF1R maturation. Notably, pro-MET is also cleaved by FURIN after a KRKKR motif. Although we observed toxicity upon expression of a 1D4 MET reporter in H23 cells, we found that it could be expressed in H322 cells, and that deletion of CPD prevented removal of the KRKKR motif (Extended Data Fig. 9e). Therefore, MET is likely another substrate of CPD.
CPD as a potential therapeutic target for lung cancers
Given the known role of IGF1R signaling in cancers42, we further assessed whether CPD deletion affects in vivo tumor growth. We performed competitive growth assays by subcutaneous injection of a mixed pool of H23 cells expressing either an sgRNA targeting CPD (labeled with mCherry) or control sgRNA (GFP) into mice (Fig. 4f). Immunofluorescence images of tumor sections clearly showed that tumors were dominated by GFP-expressing cells, indicating that CPD-deleted cells form tumors poorly (Fig. 4g). In contrast, deletion of CREBBP, one of the strongly positive hits in the 3D spheroids, promoted tumor growth as reflected by dominant mCherry signal in the tumors. Flow cytometry measurement of mCherry to GFP ratios confirmed these results (Fig. 4h).
We next asked whether expression levels of CPD were prognostic for patient survival. In a meta-analysis of expression signatures from ~18,000 human tumors with survival outcomes using PRECOG43, high expression of CPD is a strong indicator for poor prognosis of lung adenocarcinoma patients (Extended Data Fig. 10a,b). A Kaplan-Meier plot generated from the merged data confirmed this result (Fig. 4i). We also showed high expression of genes downregulated in a CPD knockout (identified by RNA-seq) is an indicator of poor prognosis in patients (see Methods, Supplementary Table 8, Fig. 4j, Extended Data Fig. 10c)
KRAS mutations occur in ~17% of lung cancers44, and there is recent excitement around the development of inhibitors26–29,45 for a KRAS G12C mutant, the most common KRAS mutation in lung adenocarcinomas31,45. Since inhibition of IGF1R can inhibit growth of KRAS mutant lung cancer46 and CPD was a top synthetic lethal hit with ARS-853 in our screens (Fig. 3a), we examined how CPD deletion affects the response of H23 cells to ARS-853. CPD deletion greatly sensitized H23 cells to the drug, particularly in 3D (Fig. 4k). Consistent with this, expression of genes downregulated in CPD knockout spheroids more strongly predict the survival of lung adenocarcinoma patients with KRAS mutations than with wild type KRAS (Extended Data Fig. 10d,e).
We further investigated potential synergy between ARS-853 and loss of CPD in additional KRAS G12C mutant lung cancer cell lines (Extended Data Fig. 10f,g). We observed even greater synergy in H358 cells, whereas no synergy was detected in H1792 cells. Interestingly H1792 cells do not have a phenotype for loss of CPD (Supplementary Table 5), and show negligible IGF1R expression (Extended Data Fig. 10h). This suggests that IGF1R expression/dependency and KRAS mutation may serve as biomarkers for combinatorial therapies targeting CPD and KRAS G12C in lung cancers.
Conclusions
Here we have demonstrated a robust strategy to conduct genome-scale CRISPR screens in 3D spheroids; phenotypes in 3D more closely match expectations for oncogenes and TSGs, and are better aligned with those in tumor xenografts. Accurate in vitro modeling of loss-of-function phenotypes in tumors is likely important for personalization of therapeutic strategies (Supplementary Discussion). For example, while CREBBP inhibitors have been used for various cancers47, in certain lung cancer lines tested here, CREBBP knockout had a negative effect on 2D growth, but a profoundly positive effect on growth in 3D spheroids and mouse xenografts (Fig. 3d, Fig. 4g,h, Supplementary Table 5); arguing against the use of CREBBP inhibitors in these cases.
Interestingly, genes with differentially strong effects in 3D culture are enriched for frequent lung cancer mutations. Possibly, this is because these genes govern the transition to more aggressive 3D growth, a hallmark of tumorigenesis24. This likely includes genes involved in cell adhesion, or that enable response to ‘tumor-like’ stresses in the spheroids (hypoxia, cell crowding, etc).
Ongoing efforts to explore the roles of matrix composition48, nutrient conditions49, cancer-associated fibroblasts (CAFs)50 and tumor-infiltrating immune cells16 have enabled marked improvements to in vitro and patient-derived organoid models of cancer. The ability to systematically and scalably determine which genes are required for growth and survival in response to such distinct environmental cues should facilitate both improved models for drug target identification and a better understanding of cancer growth.
METHODS
Cell lines
10 Non-small-cell lung carcinoma (NSCLC) cell lines were purchased from ATCC: NCI-H1437, NCI-H1568, NCI-1650, NCI-1975, NCI-H322, NCI-H1792, NCI-H2009, NCI-H23, NCI-H358, and A549. All cell lines were authenticated by Human 9-Marker STR Profile test provided by IDEXX BioResearch and tested for micoplasma contamination. Cells were cultured in RPMI 1640 (Gibco) supplemented with 10% FBS (HyClone), penicillin/streptomycin (Genesee), and GlutaMAX (Gibco). These 10 cell lines were transduced with an spCas9 lentiviral vector with a Blasticidin selection marker (addgene # 52962), and selected with Blasticidin (10 ug/ml). Single-cell clones of these selected cell lines were individually tested for their Cas9 cutting efficiency by lentiviral infection with pMCB30639, a self-GFP cutting reporter that has both GFP and an sgRNA against GFP on the same backbone. Single clones with high Cas9 cutting efficiency were established and used in the CRISPR screens and other biological assays.
Large scale 3D spheroid cultures
To culture lung cancer cells as 3D spheroids at genome-scale, we used either pre-treated ultra-low attachment plates (Corning, #3261) or polyhema (Sigma, #P3932) coated tissue culture plates. 0.75% methylcellulose (Fisher, #M-352) was added in RPMI 1640 growth media to prevent excessive aggregation of cells during spheroid cultures and to maintain even size of spheroids. To determine an appropriate cell density for CRISPR screens, we tested multiple seeding densities of H23 cells ranging from 20,000 cells / cm2 to 150,000 cells / cm2 with 500 ul of growth media per cm2. H23 cells were seeded at multiple densities and their growth and death rates were monitored in an automated fluorescent microscope optimized for live-cell imaging (IncuCyte S3 or IncuCyte ZOOM, Essen Bioscience). Cell growth rates were monitored by mCherry expressed in the cell line and death rates were monitored by Sytox Green signal which was added at 100 nM final concentration at the beginning of the experiment. Here, the number of live cells in spheroids was estimated by dividing total integrated mCherry intensities of spheroids by the average integrated mCherry intensity of single live cells measured at the initial cell seeding phase. The number of dead cells were estimated similarly by dividing total integrated Sytox Green intensities of spheroids by the average integrated Sytox Green intensity of single dead cell. We chose a cell density (50,000 cells / cm2) which showed about 30% peak cell death rate within 24 hours after initial seeding. For all subsequent experiments, cells were initially seeded at 50,000 cells / cm2 density in 500 ul of RPMI 1640 media containing 0.75% methylcellulose. 3D spheroids were then split every 3~4 days. To passage cells, cancer spheroids were collected with methylcellulose media and diluted with PBS (~3 volume of the media) to reduce viscosity of media before centrifugation. Spheroids were then centrifuged at 800g for 15 min and media/PBS was removed from the spheroid pellets. Accutase (Innovative Cell Technologies, #AT104) was added to the pellets to dissociate the spheroids into single cells. We used 10 ml of accutase per 100 million cells in spheroids and incubated them for about 30 min until spheroids were fully dissociated into single cells. The single cells were then reseeded at the starting density (50,000 cells / cm2, 500 ul growth media / cm2).
Genome-wide and batch-retest CRISPR screens
The genome-wide CRISPR library and the batch-retest library were synthesized by Agilent and cloned as previously described25. The genome-wide CRISPR library was designed to have ~210,000 sgRNAs targeting 21,000 coding genes (10 sgRNAs per gene), with 13,500 negative control sgRNAs that are either scrambled, non-targeting sgRNAs or Safe-sgRNAs targeting nonfunctional regions of human genomes. To design the batch-retest library, genes with 3D/2D phenotypes with T-score cutoff (<−2.5, >3) were first selected from the H23 genome-wide screens. We also included hits obtained in the 2D and 3D screens in the presence of the KRAS inhibitor, with phenotypes having a T-score cutoff (<−2.5, >2.5). In addition, we included genes with known clinical drugs or druggable genes (ex. kinase, phosphatase, and other enzymes) and manually curated RAS-pathway genes that were hits in both 2D and 3D. The batch-retest library had 5,466 sgRNAs targeting these 911 hit genes (6 sgRNAs per gene) and 273 Safe-sgRNAs. Briefly, oligo pools for the libraries were synthesized (Agilent), PCR-amplified, digested with BstXI and BlpI restriction enzymes, and ligated into pMCB320 vector containing an mU6 promoter to drive sgRNA expression and a EF1a promoter to drive expression of mCherry fused to puromycin with a T2A linker. The plasmid libraries were then transfected into HEK239T cells to produce lentiviral pools, which were subsequently transduced into H23 cells and other indicated lung cancer cell lines. Cells were infected with the libraries at MOI of 0.3~0.5, and after 48 hours were selected with puromycin (2 ug / ml) for 3~5 days until the library-infected cell population was at least 90% mCherry positive (indicating presence of lentivirus). Cells were expanded for another 2~3 days and aliquots were saved as T0 stocks in liquid nitrogen. At the same time, the remaining cells were plated as 2D-monolayer cultures or as 3D spheroids using the protocol described above. To maintain library complexity, the screens were performed at ~1,000x cell number coverage per sgRNA for the genome-wide screens (~200 million cells) and at ~2000x cell number coverage for the batch-retest screens (~10 million cells). All screens were performed in biological replicates. In the genome-wide screens, we included an arm in which H23 cells were treated with ARS-853 at 5 uM throughout the screens. Both 2D and 3D cultures were split every 3~4 days to keep cells in log growth phase throughout the screens. At Day 21, cells were harvested and stored in multiple cryovials (# cells in each cryovial for at least ~1000x library coverage) in liquid nitrogen for further processing. Genomic DNA was extracted from the samples with Qiagen Blood Maxi Kit (Qiagen, #51194). sgRNA cassettes were PCR-amplified from genomic DNA using Herculase II Fusion polymerase (Agilent, #600679) and deep-sequencing adapters and sample barcodes were added during the PCR25. Finally, sgRNA compositions in the samples were measured with deep-sequencing on NextSeq 550 system (Illumina). Enrichments/disenrichments of sgRNAs either between T0 and end time point samples or between drug untreated and treated samples were then used to calculate growth or drug resistance phenotypes.
Construction of CDKO library and CDKO screen
The 145 by 145 CDKO library was constructed as previously described39. Briefly, 145 genes that have most negative 3D/2D phenotypes were chosen for the CDKO library. The 3 sgRNAs that showed the strongest effects in the genome-wide screens were chosen for each gene. A total of 463 sgRNAs (435 gene-targeting sgRNAs and 28 Safe-sgRNAs) were PCR-amplified from pooled oligo chips (Agilent) and cloned into pMCB320 and pKHH030, which are lentiviral vectors with mU6 or hU6 promoters, respectively. hU6-sgRNA-tracrRNA cassettes were then digested from the single knockout CRISPR library based on pKHH030 and ligated into the single knockout CRISPR library based on pMCB320 downstream of the mU6-sgRNA-tracrRNA cassettes. This generated the 145 by 145 CDKO library, which had 214,368 double-sgRNAs corresponding to 10,440 gene pairs. The CDKO screen was performed as other CRISPR screens at ~1000x cell number coverage per sgRNA pair for 21 days in 2D monolayer H23 cells (~200 million cells). The screens were carried out in two experimental replicates starting from the same T0 population. Genomic DNA from both T0 and Day 21 samples were isolated and frequencies of double-sgRNAs were quantified by deep sequencing using a modified paired-end, single index protocol on NextSeq 550 as previously described39.
Calculation of growth and drug resistance phenotypes
Effect sizes for sgRNAs were calculated as previously described17,39. Briefly, log2 fold enrichments of sgRNAs were first measured between two samples: T0 and Day21 samples for 2D and 3D phenotypes, T0 and Day30 samples for in vivo phenotypes, 2D Day21 and 3D Day21 samples for 3D/2D phenotypes, 2D Day21 and ARS-853 treated 2D Day21 samples for KRASi 2D phenotypes, and finally 3D Day21 and ARS-853 treated 3D Day21 samples for KRASi 3D phenotypes. 3D/2D phenotypes were obtained by calculating enrichment of sgRNAs (read counts of sgRNAs) by comparing 2D Day 21 samples with 3D Day 21 samples directly. For any given phenotype, a median log2 fold enrichment of all negative control sgRNAs (none-targeting and Safe-sgRNAs) was measured and this median value was subtracted from log2 fold enrichments of all sgRNAs to account for systematic bias in screens. Lastly, log2 fold enrichments of all sgRNAs were divided by the standard deviation of negative control sgRNAs to yield phenotype Z scores (pZ) of sgRNAs which we used as effect size of sgRNAs. Effect size of a gene is the median value of all sgRNAs that target the gene. We used modified t-value scores as our phenotype scores for genes, which account for both consistency and strength of all sgRNA effects for given genes. Our phenotype scores based on t-value scores were computed as:
Phenotype score (T-score) = ( Ugene - Uctrl ) / sqrt ( Svar / Nexp + Svar / Nctrl)
where:
Ugene = the median effect of all sgRNAs (pZ) for a given gene
Uctrl = the median effect of all negative control sgRNAs (pZ)
Svar = Vargene x (Nexp − 1) + Varctrl x (Nctrl - 1)
Vargene = the variance of sgRNA effects (pZ) for a given gene
Nexp = the number of sgRNAS for a given gene
Nctrl = the average number of sgRNAs per gene in a given screen
To combine data from two experimental replicates, normalized pZ scores of sgRNAs from two replicates were pooled together and gene effects and phenotype scores were calculated from the pooled sgRNAs as described above.
Calculation of GI scores
Genetic interactions of gene pairs in the CDKO library were computed as previously described39. Briefly, the single knockout phenotype of an sgRNA was calculated from phenotype Z scores of all double-sgRNAs that have that sgRNA paired with control (Safe)-sgRNAs. The expected double knockout phenotype of a double-sgRNA pair was computed by summing single knockout phenotypes of two sgRNAs in the pair. The difference between the expected double knockout phenotype and the observed double knockout phenotype of a given double-sgRNA was then defined as the raw genetic interaction score (Raw-GI) of the double-sgRNA. The Raw-GI of the double-sgRNA was then normalized by the standard deviation of 200 double-sgRNAs that have the most similar expected double knockout phenotypes to account for systematic bias of genetic interactions along increasing phenotype strength of double-sgRNAs. These normalized genetic interactions (Norm-GIs) of double-sgRNAs were then used to calculate genetic interactions at the level of gene pairs. Three sgRNAs were assigned for each gene in the library, which gave a total of 9 combinations (3 by 3) for the gene pair in one orientation. Since there are two possible orientations for a gene pair (ex. A-B and B-A), there are at most 18 double-sgRNAs that target a gene pair. The Norm-GI of a gene pair is simply the median value of all double-sgRNAs against the gene pair. We used GITscore and GIMscore as statistical scores to measure genetic interactions of gene pairs39 in the CDKO library. Briefly, the GITscore for a given gene pair was calculated based on the modified t-value score and GIMscore is signed log10 p value measured from Mann-Whitney U (MWU) test. Both scores take into account the strength and consistency of Norm-GIs of double-sgRNAs, adjusted by observed noise levels reflected in non-interacting double-sgRNA controls that have at least one Safe-sgRNA in each pairs. MWU p values were multiple-test corrected to compute adjusted false discovery rates using Benjamini-Hochberg procedure. In the 145 by 145 matrix of GITscores, genes were hierarchically clustered with correlation distance calculated by Pearson correlation coefficients to generate the GI map. These correlation distances were also used to rank genes by their similarities to CPD in terms of their GI patterns. To combine data from two experimental replicates, Norm-GIs of double-sgRNAs from two replicates were pooled together and Norm-GIs of genes and GI scores were then computed as described above.
Annotation of cancer genes - TSGs, Oncogenes
COSMIC30 (v86), the Catalogue Of Somatic Mutations In Cancer, was used to annotate genes as tumor suppressors or oncogenes. COSMIC is an expert-curated database of 719 somatic mutations for which roles in cancer are manually annotated by experts in the field. There are seven defined roles of the mutations in the database: oncogene, oncogene-fusion, TSG, TSG-fusion, fusion, oncogene-TSG, and oncogene-TSG-fusion. For analysis of gene phenotypes and comparison toroles in cancer, we pooled genes in oncogene and oncogene-fusion categories and defined them as Oncogenes. Genes in TSG and TSG-fusion were defined as TSGs.
Analysis of lung cancer mutations
Comparisons between CRISPR phenotypes of genes and their significance as lung cancer mutations were performed using previously published data for lung cancers31. In the dataset, exome sequences and copy number profiles of 660 lung adenocarcinoma (ADC) and 484 lung squamouse cell carcinoma (SqCC) tumor-normal pairs were analyzed. This generated a list of 11,249 genes that were reported to be mutated at least once in the lung cancer samples. Their mutational significances were computed with MutSig2CV51 and also provided in the dataset. Sign flipped Log10 MutSig2CV q-values were then summed and displayed as cumulative sum plots along genes sorted by different screening phenotypes.
Analysis of DepMap CRISPR datasets
The Avana dataset (version 18Q4) with CERES effects of ~18,000 genes across 517 cell lines was downloaded from the DepMap website (https://depmap.org/portal/download/). To measure the percentage of positive hits in the CERES cell lines, absolute CERES effects were used to sort genes in descending order in each cell line. The first 1000 genes were selected and the percent of genes with positive CERES effects were measured in the 1000 genes for each cell line. Cell lines were then grouped by their tissues of origin and the percentage of positive hits in each cancer were plotted as box plots (Fig. 1a). To define 50 core essential genes, we averaged CERES effects across the 517 cell lines. Genes were then sorted by average CERES effect in ascending order and the 50 genes with the most negative/toxic average CERES effects were defined as “core” essential genes. To measure correlation of genes in terms of their cancer dependencies, CERES effects were first subject to a PCA‐based correction method for genome‐wide screening data21. This bias-correction was shown to bolster the sensitivity and specificity of detecting true co-essentiality of gene pairs. Pearson correlation coefficients of genes were measured in the matrix of batch-corrected CERES effects.
Identification of enriched co-essential functional modules
We used generalized least squares (GLS) to map co-essential interactions across all pairs of genes in the Avana dataset (version 18Q3) while automatically accounting for relatedness between cell lines22; unlike conventional approaches to co-essentiality mapping based on Pearson correlation, this approach yields non-inflated p-values. We applied GLS to the matrix of CERES effects corrected with the PCA-based correction method described above21. We then applied the ClusterONE clustering algorithm52, originally developed to discover protein complexes de novo from protein-protein interaction data, to cluster genes into “co-essential modules” in an unbiased fashion, based on their co-essentiality profiles across all other genes. Specifically, we ran ClusterONE on the gene-by-gene matrix of GLS p-values after row-wise false discovery rate correction, with edge weights set to one minus the false discovery rate q-value53. To see which co-essential modules were enriched in the different screening phenotypes, the probability that the distribution of members in a given module in terms of their phenotypes scores was significantly different from that of all genes was measured using MWU test. Sign flipped log10 MWU p values and median effects of members in co-essential modules were plotted in volcano plots as Y-axis and X-axis, respectively (Fig. 3a, Extended Data Fig. 4c). The most enriched co-essential modules from different screen phenotypes were then analyzed. While we used GLS to define co-essential modules, we used batch-corrected CERES effects for visualizing co-essentiality of gene pairs in all scatter plots and clustermap (Fig. 3c, Extended Data Fig. 4e,f).
PANTHER Pathway enrichment analysis
To see which pathways were enriched among the top hits from the different screen phenotypes, we uploaded the top 1000 hits from each screen phenotype into The Gene Ontology knowledgebase website (http://geneontology.org/). We then performed PANTHER Overrepresentation Test with PANTHER pathways54 as the annotation data set. Significance of enriched pathways were measured with Fisher’s Exact test and pathways that passed 5% FDR cutoff were displayed as significantly enriched pathways for each phenotype with the indicated Log10 FDR.
Subcutaneous transplantation and analysis of subcutaneous tumors
10- to 12-week old, female NSG mice of similar weights were used for cell transplantation experiments. To determine the number of H23-derived cell lines to inject, several dilutions of cells (2 × 10⁵, 1 × 10⁶, 2 × 10⁶, and 4 × 10⁶) were injected into both flanks and both shoulders of one NSG recipient mouse per dilution (n=4 mice; 16 tumors total). After ten days, 4/4 palpable tumors formed from the 4 × 10⁶ cell injections, compared to 0/4 for 2 × 10⁵ cell injections, ¼ for the 1 × 10⁶ cell injections, and ¼ for the 2 × 10⁶ cell injections, therefore 4 × 10⁶ or more cells were used for all subsequent injections. For the batch re-test CRISPR screens, H23 cells were transduced with the library as described above. After selecting the cells with puromycin, 8 × 10⁶ library transduced cells in 100uL PBS were injected into both flanks of NSG recipient mice. (n=10 mice; 20 tumors total). Ideally, this would represent ~13,000x cell number coverage for the library, although the actual cell number coverage per sgRNA was likely much lower since a large portion of injected cells would not contribute to tumor development after subcutaneous transplantation. 4 weeks after transplantation, tumors were removed and homogenized using a tissue blender (Omni International, #TH115-PCR), which was cleaned between each sample. 10 tumors from left flanks were pooled together as one experimental replicate and the other 10 tumors from right flanks were pooled together as the second experimental replicate. Genomic DNA was then extracted from these two pools using QIAamp DNA Blood Maxi Kit (Qiagen, #51194) with the protocol the manufacturer provided. To PCR-amplify sgRNA cassettes from genomic DNA for deep-sequencing, we used ~15x more genomic DNA than what we would use for samples from in vitro CRISPR screens25,39. Briefly, we scaled a reaction based on ~10 ug of genomic DNA in 100 ul of PCR reaction per each ~300 sgRNAs in the library. This was to account for genomic DNA that came from tumor infiltrating mouse cells. Amplified PCR samples were sequenced on NextSeq 550 as described above. For the competitive growth assays in tumors, total 4 × 10⁶ H23-derived cells with roughly equal numbers of mCherry (gene-targeting sgRNAs) and GFP (Safe-sgRNAs) expressing cells in 100uL PBS were injected into both flanks of four NSG recipient mice per genotype (n=12 mice total across three groups; 24 tumors total). 30 days after transplantation, subcutaneous tumors were individually dissected, roughly chopped using dissecting scissors, and further dissociated into a single-cell suspension using collagenase IV, dispase, and trypsin at 37 degrees for 30 minutes with rotation. After digestion, samples were passed through a 40uM filter and maintained in PBS with 2% FBS, 2mM EDTA, and 1 U/mL DNase before FACS analysis. For FACS analysis, mCherry/GFP ratio was determined at Day0 before subcutaneous injection and at Day30 from dissociated tumors. Log fold change of mCherry/GFP ratio between these two time points was calculated and normalized to the control mix (Safe-mCherry/Safe-GFP) (Fig. 3h). The Stanford Institute of Medicine Animal Care and Use Committee approved all animal studies and procedures.
Histologic preparation and immunohistochemistry
Tumors from the in vivo competition assay were fixed with 4% formalin in PBS overnight and transferred to 70% ethanol before paraffin-embedding. Paraffin-embedded tumors were sectioned into 4 um-thick slices, deparaffinized with xylene and ethanol, and antigen-retrieved in citrate buffer. Immunohistochemical staining for GFP (Abcam, ab13970, 1:250) and mCherry (Abcam, ab167453, 1:250) was performed on these 4 um-thick sections. Alexa Fluor 488 secondary antibody (ThermoFisher Scientific, A-11039) and Alexa Fluor 594 secondary antibody (ThermoFisher Scientific, A-11012) were added along with Hoechst to visualize GFP, mCherry and nuclei signals in the subsequent immunofluorescence imaging. Images were taken on an inverted epifluorescence microscope (Eclipse Ti, Nikon) using 10x and 20x objectives.
1D4 reporter system
A 1D4 epitope41 was placed just upstream of the RKRR motif in the IGF1R α-chain whereas a Flag epitope was placed at the C-terminus of IGF1R β-chain (1D4-RKRR) (Fig. 4b). One or two additional amino acids are inserted between the 1D4 epitope and the RKRR motif in the control reporters (1D4-ERKRR, 1D4-PERKRR). An additional control reporter has an HA epitope instead of 1D4 (bottom, HA-RKRR reporter).
Immunofluorescence imaging
For immunofluorescence imaging, cells were either fixed with 4% paraformaldehyde in PBS for 15 min at room temperature, or fixed with ice cold methanol at 4°C for 15 min; for the CPD antibody (A305–514A-M, ThermoFisher), we used methanol fixation and used paraformaldehyde fixation for all other antibodies. Cells were washed twice with PBS and subsequently permeabilized with 0.2% Triton X-100 in PBS for 15 min at 4°C for paraformaldehyde fixed samples. Cells were blocked with 3% bovine serum albumin (BSA) in PBS for 1 hr at room temperature. Primary and secondary antibodies were diluted in PBS containing 3% BSA. Cells were first incubated with the primary antibodies overnight at 4°C. Cells were then washed three times with PBS, and incubated with the secondary antibodies and Hoechst for 2 hours before a triple wash in PBS. For quantifying IGF1R signaling activities in 2D monolayer cells, cells were processed in a 96-well multi-well plates and imaged either on inverted epifluorescence microscope (ImageXpress Micro, Molecular Devices) using a 10x objective, or on a spinning-disk confocal microscope (Eclipse Ti - Nikon, CSU-W1 - Yokogawa) using 20x objective. More than four sites were acquired from each well and fluorescence signals were quantified across multiple image sites per condition. For the 1D4 assays, CPD staining, and IGF1R staining in 3D spheroids, cells were processed in glass-bottom 24 well plates and imaged using the spinning-disk confocal microscope with a 10x or 20x objective. Primary antibodies were obtained from the following sources : IGF1R-α and CPD antibody from ThermoFisher (AHR0321, A305–514A-M); antibodies to MET, phospho-AKT (Ser437), phospho-ERK½ (Thr202/Tyr204), and Flag from Cell Signaling Technology (cat. nos. 8198, 4060, 4370, and 14793); Rho1D4 antibody from Millipore (MAB5356).
Individual sgRNA validations using automated microscopy
H23 cell lines expressing the indicated sgRNAs were seeded either in tissue-culture treated (2D monolayers) or ultra-low attachment (3D spheroids) 24 well plates and loaded into an inverted epifluorescence microscope (IncuCyte S3 or IncuCyte ZOOM, Essenbioscience) compatible with live-cell imaging. For the competition assays, ~50,000 cells expressing gene-targeting sgRNA (mCherry) were mixed with ~50,000 cells expressing Safe-sgRNA (GFP) and seeded into a well in 24 well plates. Images were taken every 4 hours for the next 72 hours. mCherry to GFP ratios were then compared between 0 hr and 72 hr time points to track fold changes in the ratio. Fold changes in the ratios of samples were then normalized by the fold change in the ratio of Safe-mCherry and Safe-GFP mix to estimate relative 2D and 3D growth phenotypes of sgRNAs to the control. In addition, the normalized 3D fold changes were divided by the normalized 2D fold changes to estimate 3D/2D growth phenotypes of sgRNAs. For imaging colony size from H23 knockout cell lines, ~100,000 cells expressing gene-targeting sgRNAs (mCherry) were seeded into ultra-low attachment 24 well plates in presence of 100 nM Sytox Green. Size and cell death of 3D spheroids from each knockout line was then monitored for the next 72 hours. All experiments were performed in triplicate and sequences of sgRNAs used for the validation are listed in Supplementary Table 10.
Rescue experiment with growth factors
The competitive growth assays between CPD null H23 cells and control H23 cells were performed in presence of 50 ng/ml of IGF1 (PHG0071, ThermoFisher), EGF (E9644, Sigma-Aldrich), or HGF (294-HG-005, R&D Systems). The competitive growth assay was performed as described in the sgRNA validation experiments, but in this case the indicated growth factor was added at the beginning of the experiment to measure its ability to rescue gene loss phenotypes.
Drug titration experiments
For the drug titration experiments, ~16,000 cells were seeded into tissue-culture treated 96-well plates in RPMI 1640 growth media (2D monolayers) or ultra-low attachment 96-well plates in RPMI 1640 growth median with 0.75% methylcellulose. Cells were then grown for the next 72 hours in presence of titrated inhibitors. At the 72 hr point, 1/10th volume of alamarBlue reagent (ThermoFisher, DAL1100) was added to cells and incubated ~2 hours for 2D monolayer cells and ~10 hours for 3D spheroids at 37°C. Fluorescence signals were then measured in a fluorescence plate reader (TECAN, #30016056, excitation at 560 nm, emission at 590 nm) to estimate relative number of live cells at different dosages of the inhibitors. Wild type H23 cells were used in the experiments where efficacies of small molecule inhibitors were compared between 2D and 3D. To test whether CPD deletion sensitizes cells against ARS-853, H23 cells with Safe-sgRNA and with CPD-sgRNA (no fluorescent marker) were used. Small inhibitors were obtained from the following sources : Savolitinib from Selleckchem (S7674), Linsitinib from VWR (# 10189–468), FURIN inhibitor I from Sigma Aldrich (# 344930), and ARS-853 from Cayman chemical (# 1629268–00-3).
Immunoblotting
Cells were lysed in RIPA buffer containing phosphatase and protease inhibitor cocktails (Roche, #11697498001). Then lysates were incubated on ice for 15 min, then clarified at 16,000 g, 4 °C, for 10 min. Protein was quantified using the Bradford method and lysates were made with NuPage Sample Buffer (4×). Then membranes were probed with the following primary antibodies (1:1000 dilution). Antibodies to KRAS and GAPDH from ThermoFisher (415700, AM4300). The following secondary antibodies were used at a 1:5000 dilution. Anti-rabbit or anti-mouse IRDye conjugated secondary antibodies from Fisher Scientific (cat. nos. NC9401841, NC9401842, NC0110517, and NC9030091). Finally, membranes probed with the IRDye conjugated antibodies were imaged on an infrared imaging system (Li-Cor, Odyssey CLx). Uncropped western blots are shown in Supplementary Fig. 1.
Knocking down genes in established spheroids
To knockdown genes in established spheroids, we transduced rtTA and inducible KRAB-dCas9-T2A-mCherry 17 under control of tet-on promoter into H23 cells. These cells were treated with doxycycline for two days and were sorted for mCherry signal on a FACS sorter to select cells that can reliably induce dCas9 expression upon doxycycline treatment. Doxycycline was withdrawn from the sorted cells and cells were sorted again for loss of mCherry signal to establish an inducible CRISPRi cell line that can turn off dCas9 upon doxycycline withdrawal. This cell line was transduced with CRISPRi sgRNAs against CPD and KRAS. These cells were then seeded to form spheroids for 48 hours, after which doxycycline was added at 0.2 ug/ml concentration to induce knockdown target genes in the established spheroids. Growth of spheroids were then monitored for the next 5 days in an automated microscope (IncuCyte S3, Essen Bioscience).
PRECOG analysis
PRECOG analysis was performed as previously described43. Briefly, lung adenocarcinoma datasets were merged by normalizing CPD expression within each cohort so that its mean and standard deviation were 1 across stage 1 patients. The merged set of 1,321 patients was split into high vs low CPD based on the median expression of CPD across the entire dataset. Kaplan-Meier analysis was used to assess association with overall survival, with p-value calculated by log-rank test. PRECOG Meta-Z scores for genes in the CPD module across different cancer types were obtained from the PRECOG website (https://precog.stanford.edu/).
RNA-seq experiment and analysis
H23 cells expressing control (Safe)-sgRNA or CPD-sgRNA were cultured as 2D monolayers or 3D spheroids in 100 mm tissue culture plates. RNA was extracted with TRIzol (ThermoFisher, 15596026) and processed with a RNA seq library preparation kit (Illumina, RS-122–2101) to produce libraries for deep sequencing on NextSeq 550. Library preparation and sequencing were performed according to manufacturer’s protocol. Sequencing reads were mapped to the combined indices of cDNAs and non-coding RNA transcripts from GRCh38 genome reference using Kallisto55. Differentially regulated genes between the two different conditions were analyzed using Sleuth56. Here, Sleuth computed FDRs for differential regulation of transcripts. If a gene has multiple transcripts, the best FDR value from all the transcripts was chosen to represent the FDR for differential regulation of the gene. We then defined a set of differentially regulated genes using 5% FDR cutoff. Genes significantly down-regulated in CPD deleted 3D spheroids compared to control 3D spheroids were further analyzed for their predictive power for survival rates of lung cancer patients.
TCGA outcome analysis in downregulated genes upon CPD deletion
TCGA lung adenocarcinoma gene expression data (FPKM-UQ) and outcome/clinical data was downloaded from qdc.cancer.gov. We used GSVA (Gene Set Variation Analysis)57 to study the association with outcome of the genes associated with CPD deleted phenotype. RNA-seq counts were normalized using Limma voom58. Outcome data was censored to 7 years. Kaplan-Meier plots were generated using the survminer package from Bioconductor. High vs low CPD GSVA score was defined using the 1/3 upper vs 1/3 lower quantiles. Log-rank test p values are reported. Additionally, we built a Cox Proportional Hazard model to account for key clinical covariates including age, stage, gender, and TP53 and KRAS status. We also study the interaction between CPD GSVA score and KRAS mutation status using a Cox Proportional Hazards model with the same covariates.
Statistical analysis
The statistical significance used to compare the averages of two different experimental groups in all box plots and bar graphs in this study was computed using unpaired, two-tailed Student’s t-test.
Extended Data
Extended Data Figure 1. High quality/reproducibility of 2D and 3D genome-wide CRISPR screens and hits with differential effects in the two conditions.

a. H23 cells expressing mCherry were seeded at different densities in ultra-low attachment plates in the presence of 0.75% MC. Sytox Green was added at 100 nM concentration. Average mCherry signal and Sytox Green signal measured across single cells were used to estimate the total numbers of live cells and dead cells at each seeding density. Cell growth and death rates were then monitored simultaneously on a live-cell microscope for 60 hrs. We aimed for a ~30% cell death rate during the initial growth phase of spheroids and 0.1 million cells per well (1.9 cm2) was the chosen cell seeding density for our genome-wide screens in 3D spheroids
b. 2D growth phenotypes of 20,463 genes were highly reproducible between experimental replicates (top panel). Sequencing counts of 208,687 sgRNAs in a T0 sample and a Day 21 sample from the 2D genome-wide screens (bottom panel) show that most negative control sgRNAs (red dots) do not enriched or disenriched between T0 and Day 21 (black dots). This indicates the complexity of the genome-wide library was maintained throughout the 2D screen. In the top plot, the data are fit by a linear regression line (blue dotted line). The gray line marks a 1:1 diagonal. Pearson corr, Pearson correlation coefficients.
c. The quality and reproducibility of the 3D screens were comparable to those of the 2D screens, suggesting that the scalable 3D spheroid culture system is on a par with traditional 2D culture methods for its performance in genome-scale CRISPR screens. n=20,463 genes for the top plot. n=208,687 sgRNAs for the bottom plot. In the top plot, the data are fit by a linear regression line (blue dotted line). The gray line marks a 1:1 diagonal. Pearson corr, Pearson correlation coefficients.
d. Cumulative distribution of sequencing reads for sgRNAs in the genome-wide CRISPR library. Read counts were normalized by total reads for each sample and the cumulative sums of sgRNAs were plotted as relative percentages of the number of expected sgRNAs.
e. Cumulative sums of TSGs counts (left plot) or oncogenes counts (right plot) are plotted against genes sorted by their 2D, 3D, or 3D/2D phenotypes (T-score) from the genome-wide screens in H23 cells. TSGs are expected to have positive growth phenotypes when deleted. Therefore, genes are sorted in descending order from the most positive to the most negative phenotypes in the left plot for TSGs. On the other hand, oncogenes are expected to have negative/toxic growth phenotypes and genes are sorted in ascending order in the right plot for oncogenes. Black dotted line, randomly sorted genes. The first 4,000 genes are displayed.
f. Summary of hits with differential 3D/2D phenotypes. Top positive (red filled circles) and negative (blue filled circles) hits from the differential 3D/2D phenotypes reveal many cancer relevant genes associated with transcriptional regulation, cell motility, cell adhesion, and energy metabolism. Cancer signaling pathways such as RAS-MAPK, TGFβ, MET, Rho, β-catenin, and hippo signaling are strongly represented. Sizes of circles are proportional to 3D/2D phenotype scores.
g. The 10 most significant Pan-lung cancer genes31 and 50 top core-essential genes are marked. Genes sorted by absolute phenotype (T-score) in 2D, 3D, and 3D/2D (see Methods).
Extended Data Figure 2. Genome-wide 2D and 3D CRISPR screens in NCI-H1975, a lung adenocarcinoma line with EGFR L858R mutation.

a. Distributions of 2D and 3D phenotypes are shown as volcano plots. The Y axis represents absolute T-score for each gene, and the X axis represents effect size of each gene. Size of dots represents absolute T-score of genes.
b. Prediction of TSGs or oncogenes with 2D, 3D, 3D/2D phenotypes in NCI-H1975. Cumulative sums of TSGs counts (top panel) or oncogenes counts (bottom panel) are plotted against genes sorted by their 2D, 3D, or 3D/2D phenotypes (T-score) from the genome-wide screens in H1975 cells. These data indicate 3D or differential 3D/2D phenotypes show marked improvement for prediction of TSGs when compared to the 2D phenotypes, with marginal improvement for predicting oncogenes. In the boxplots, center lines mark median; box limits mark upper and lower quartiles; whiskers, 1.5x interquartile range; points, outliers.
c. Enriched pathways among the top 1000 hits from each culture condition were analyzed using PANTHER Overrepresentation Test. Significance of enriched pathways were measured with Fisher’s Exact test and the Benjamini-Hochberg False Discovery Rate (FDR) were subsequently computed (x-axis). The EGFR signaling pathway, a known driver for NCI-H1975, is enriched in only 3D or 3D/2D phenotypes. Number of genes for enriched pathways are marked at the right side of bars.
d. The cumulative sum of the significance of 11,249 Pan-lung cancer mutations from 1,144 lung cancer patients as measured by MutSig2CV is displayed on the y-axis, while the x-axis shows phenotypes for genes sorted by their strength in 2D (solid red line), 3D (solid blue line), or 3D/2D (solid yellow line). Black dotted line, randomly sorted genes. Top 3,000 genes are shown.
Extended Data Figure 3. Genome-wide 2D and 3D CRISPR screens in NCI-H2009, a lung adenocarcinoma line with KRAS G12A mutation.

a. Distributions of 2D and 3D phenotypes are shown as volcano plots. The Y axis represents absolute T-score for each gene, and the X axis represents effect size of each gene. Size of dots represents absolute T-score of genes.
b. Prediction of TSGs or oncogenes with 2D, 3D, 3D/2D phenotypes in NCI-H2009. Cumulative sums of TSGs counts (top panel) or oncogenes counts (bottom panel) are plotted against genes sorted by their 2D, 3D, or 3D/2D phenotypes (T-score) from the genome-wide screens in H2009 cells. These data indicate that 3D, and in particular the differential 3D/2D phenotypes show improved prediction of both TSGs and oncogenes when compared to 2D phenotypes. In the boxplots, center lines mark median; box limits mark upper and lower quartiles; whiskers, 1.5x interquartile range; points, outliers.
c. Enriched pathways among the top 1000 hits from each culture condition were analyzed using PANTHER Overrepresentation Test. Significance of enriched pathways were measured with Fisher’s Exact test and the Benjamini-Hochberg False Discovery Rate (FDR) were subsequently computed (x-axis). RAS pathway, a known driver for NCI-H2009, is enriched in 3D/2D phenotypes. Number of genes for enriched pathways are marked at the right side of bars.
d. The cumulative sum of the significance of 11,249 Pan-lung cancer mutations from 1,144 lung cancer patients as measured by MutSig2CV is displayed on the y-axis, while the x-axis shows phenotypes for genes sorted by their strength in 2D (solid red line), 3D (solid blue line), or 3D/2D (solid yellow line). Black dotted line, randomly sorted genes. Top 3,000 genes are shown.
Extended Data Figure 4. High quality/reproducibility of optimized in vivo CRISPR screens and analysis of the CPD co-essential module.

a. A CRISPR sgRNA library targeting 911 hits with differential growth effects in 3D versus 2D (Supplementary Table 4) was introduced into H23 cells, and introduced by subcutaneous injection into NSG mice. After 30 days, tumors were harvested and sgRNAs were amplified. In vivo growth phenotypes of 911 genes were highly reproducible between experimental replicates (left panel). Sequencing counts of T0 samples and Day 30 samples from the in vivo batch-retest screens (right panel). In the left plot, the data are fit by a linear regression line (blue dotted line). Pearson corr, Pearson correlation coefficients.
b. Cumulative distribution of sequencing reads for sgRNAs in the batch-retest library in H23 cells. Read counts were normalized by total reads for each sample and the cumulative sums of sgRNAs were plotted as relative percentages of the number of expected sgRNAs.
c. 4,034 co-essential gene modules based on the DepMap CRISPR dataset are plotted as volcano plots for KRASi 2D phenotype scores. Y axis, significance of enrichments of co-essential modules as measured in log p values from the two-sided Mann-Whitney U test (see Methods). X axis, average gene effects of members in CERES modules.
d. Genes in the CPD module are marked along 17,634 genes sorted by their correlations to CPD. Pearson correlation coefficients between CPD and other genes are measured in batch-corrected CERES effects in the DepMap CRISPR dataset.
e. CERES effects of CPD, FURIN, and IGF1R are shown as correlation plots. CERES effects are batch-corrected before plotting21. Blue lines, regression lines. Blue shaded translucent bands, 95% confidence intervals. Pearson corr, Pearson correlation coefficients.
f. Lack of correlation between CPD and OR2A25, an olfactory receptor, in their CERES effects across 517 cancer lines.
Extended Data Figure 5. Analysis of CPD co-essential module with a 145 by 145 gene genetic interaction map.

a. Cloning of CRISPR double knockout (CDKO) library. 463 sgRNAs targeting 145 hits from the 3D/2D phenotypes were PCR-amplified from a oligo array. These 145 hits include members of CPD co-essential module. sgRNAs were separately cloned into two lentiviral vectors with either a mU6 or a hU6 promoter to generate two CRISPR single-knockout libraries. hU6-sgRNA cassettes were then cut out from one library and ligated into the other library containing the mU6 promoter. This generated a CRISPR double-knockout (CDKO) library with all possible pairwise combinations of 463 sgRNAs (214,369 double-sgRNAs). This CDKO library was used to measure genetic interactions (GIs) of 10,440 gene pairs (145 by 145 combinations).
b. 145 by 145 genetic interaction map. 145 by 145 matrix of genetic interaction scores are shown as a heatmap. 145 genes are clustered by their GI similarities (pearson correlation coefficients of GIs) in the map. Members of the CPD co-essential module form a cluster (marked with red box) in this GI map, consistent with their correlations in the DepMap CRISPR dataset.
c. A genetic interaction map validates the CPD co-essential module in H23. Correlations of GIs are used to sort 145 genes based on their similarities to GIs of CPD. Genes in the CPD module are marked with red dots along the sorted genes.
Extended Data Figure 6. Validation of individual sgRNAs targeting top hits with differential 3D/2D growth effects.
a. A schematic showing the competitive growth assay used to validate individual sgRNAs in 2D and 3D conditions. Cells expressing a gene-targeting sgRNA (mCherry) are mixed with cells expressing a control-sgRNA (Safe-sgRNA, GFP). Relative changes of mCherry to GFP ratios are monitored to compute growth phenotypes of gene-targeting sgRNAs.
b. Genes within the CPD module and selected top hits with differential effects in 3D vs. 2D growth were targeted with individual sgRNAs and subjected to competitive growth assays in both 2D and 3D culture. Relative 2D and 3D growth phenotypes of individual sgRNAs were measured by tracking changes in ratios of mCherry (gene-targeting sgRNAs) to GFP (control-sgRNA) in the assays by automated fluorescence microscopy. (n=3 wells in a 24 well plate, mean±s.e.m.).
c. Binary masks of H23 spheroids with the indicated gene knockouts. H23 knockout cell lines expressing sgRNAs against top hits from the 3D/2D phenotypes were seeded at equal density on ultra-low attachment plates. 3D spheroids generated from the knockout lines were imaged in a fluorescent microscope 72 hours after seeding. For each knockout line, 48 images were taken from three wells in a 24-well plate using a 10x objective. Binary masks were then generated from mCherry signals of 3D spheroids. 48 images were then stitched together to be shown as one large image for each knockout.
d. Relative colony masses of H23 spheroids with gene knockouts are quantified and displayed in bar graphs. (n=3 wells in a 24 well plate, mean±s.e.m.)
e. Genes in the CPD module and KRAS were targeted with corresponding small molecule inhibitors. Cells were seeded in 96 well plates in 2D (blue line) and 3D (red line) conditions, and grown in the presence of titrating doses of inhibitors for 72 hrs. Live cells were quantified with alamar blue assays. Relative growth of treated cells compared to the untreated samples are plotted in the drug titration curves. (n=3 wells in a 96 well plate for Linsitinib and n=4 for all other drugs, mean±s.e.m.)
Extended Data Figure 7. Induced CPD knockdown in established H23 spheroids slows growth.

a. 0.2 ug/ml of doxycycline was added to established spheroids at 48 hours post initial seeding. Spheroids were expressing both mCherry and KRAB-dCas9 separated by a T2A sequence under the same doxycycline-inducible promoter. Addition of doxycycline rapidly induced KRAB-dCas9-T2A-mCherrymCherry-T2A-dCas9-KRAB expression in spheroids. (n=3 wells in a 24-well plate, mean±s.e.m.).
b. Immunofluorescence staining of CPD (green) showed that CPD sgRNA 1 and 3 robustly reduced CPD levels in H23 cells expressing the inducible KRAB-dCas9 upon doxycycline addition. On the other hand, CPD sgRNA 2 was less effective. Mean intensities of CPD IF signals of 2 biological replicates were measured in the bottom bar plot..
c. Immunostaining of KRAS (green) by western blot showed that KRAS sgRNA 1 and 3 robustly reduced KRAS levels in H23 cells expressing the inducible KRAB-dCas9 upon doxycycline addition. On the other hand, KRAS sgRNA 2 was less effective. These experiments were repeated twice to confirm the result.
d. Relative spheroid growth 5 days post doxycycline addition comparing doxycycline-treated and untreated samples was measured in control, CPD, and KRAS sgRNA expressing cells. H23 cells with inducible KRAB-dCas9-T2A-mCherry were first transduced with gene targeting sgRNAs using a lentivirus that also expressed a GFP marker. Cells were seeded and allowed to form spheroids for 48 hours. Doxycycline was then added and growth of spheroids in doxycycline treated or untreated samples was monitored by GFP signal for another 5 days. Spheroids expressing CPD sgRNA 1 or 3 and spheroids expressing KRAS sgRNA 1 or 3 showed markedly reduced growth upon doxycycline addition whereas spheroids expressing control sgRNA did not show difference between doxycycline treated and untreated samples. (n=3 wells in a 24 well plate. mean±s.e.m.).
e. Growth of spheroids expressing control, CPD sgRNA 3, or KRAS sgRNA 3 were monitored after doxycycline addition. Cells were seeded to form spheroids in the first 48 hours and growth of spheroids were monitored by GFP for the next 5 days. (n=3 wells in a 24-well plate, mean±s.e.m.)
Extended Data Figure 8. CPD deletion inhibits the IGF1R pathway in H322, A549, and H358 Cells.

a. Representative IF images of IGF1Rα (green) in control and CPD KO H23 spheroids.
b. Quantitation of IF in a. IGF1Rα intensities averaged across 9 spheroids per condition. *P=2.2E-3 (n=9, two-sided t-test, mean±s.e.m.)
c-e. IGF1R and phosphorylated AKT levels were quantified from immunofluorecence (IF) images in c for NCI-H322, in d for A549, and in e for NCI-H358. The dotted gray line marks a 100% level (P values calculated using two-sided t-test, mean±s.e.m.)
Extended Data Figure 9. CPD deletion acts through IGF1R pathway to inhibit 3D growth in H23 cells and CPD removes the FURIN-recognition motif from the C-terminus of IGF1R and MET α-chain.
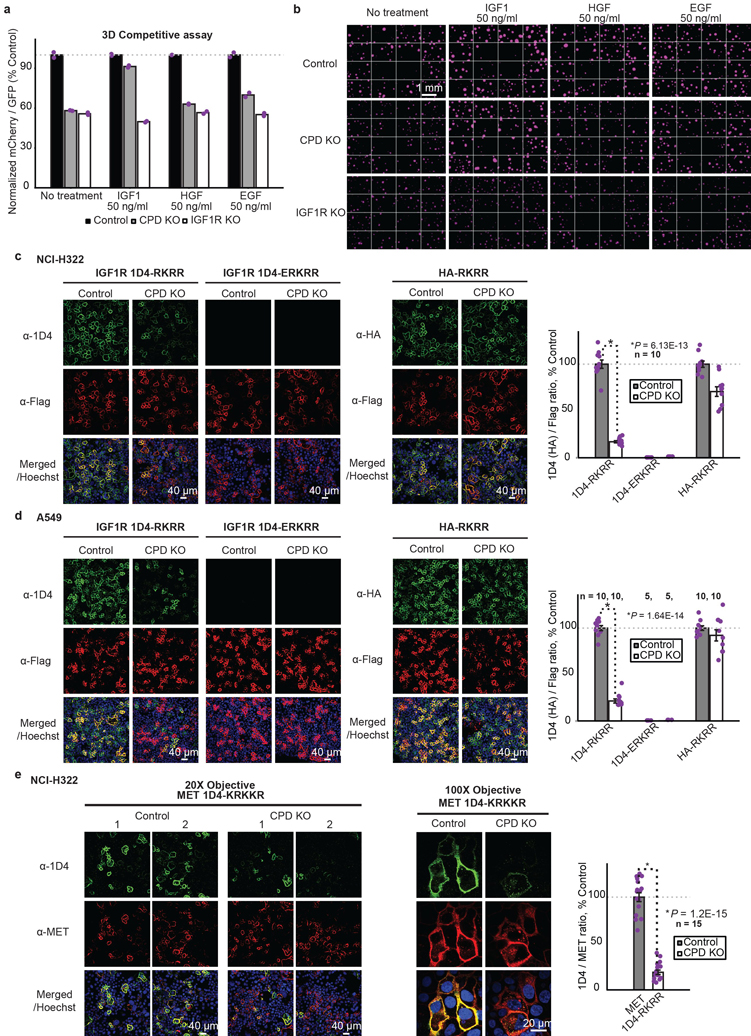
a. The growth phenotype observed upon CPD deletion in H23 cells is rescued by addition of excess IGF1 (50 ng/ml) to the growth medium. A CPD or IGF1R targeting sgRNA with mCherry and a Safe-sgRNA with GFP were infected into H23 cells separately, mixed in 50:50 ratio, and cultured in 3D spheroids for 72 hrs. Ratios of mCherry to GFP at 72 hr normalized to T0 ratios were plotted in the bar graphs. Both CPD and IGF1R deletion reduced 3D growth of spheroids as reflected in the reduced mCherry to GFP ratios compared to control. Treating cells with excess IGF1 ligand (50 ng/ml) rescued CPD deletion phenotypes, whereas EGF or HGF addition did not. This suggests that partial inhibition of IGF1R pathway by CPD deletion can be compensated by over-activation of the pathway with the excess IGF1 ligand. On the other hand, IGF1 could not rescue IGF1R deletion phenotype. (n=2 wells in a 24 well plate. mean±s.e.m.)
b. Control, CPD KO, and IGF1R KO spheroids were treated with the indicated growth factors. 16 mCherry fluorescent images of spheroids expressing a gene-targeting sgRNA vector with mCherry marker were stitched together to create the images shown.
c-d. IGF1R 1D4-reporters (see Fig.4b) showed that removal of the FURIN recognition site RKRR from the C-terminus of IGF1R α-chain after FURIN cleavage is severely impaired by CPD deletion in NCI-H322 (c) and A549 (d). (P values calculated using two-sided t-test, mean±s.e.m.).
e. A MET 1D4-KRKKR reporter (with 1D4 epitope inserted upstream of the FURIN recognition site KRKKR in MET, as with IGF1R in Fig.4b) showed that removal of KRKKR from the C-terminus of MET α-chain is severely impaired by CPD deletion in NCI-H322. Total MET reporter levels were measured using an antibody against Met and ratios of 1D4 signal to MET staining signal were used to assess the degree of the KRKKR processing in control and CPD null background. Error bars, s.e. of biological replicates in a 96-well plate. (P values calculated using two-sided t-test, mean±s.e.m.)
Extended Data Figure 10. Targeting CPD may have therapeutic effects in lung cancer patients.

a. Meta-Z scores of genes in CPD module across different cancer types from PRECOG analysis43. Positive Z score predicts high expression of a given gene is associated with poor prognosis of disease. Pink bar (CPD) shows that high CPD expression predicts poor prognosis of lung adenocarcinoma (Z score=5.59, PRECOG meta-FDR=3.23E-06)
b. A forest plot showing hazard ratios (HR) of CPD measured from different datasets (authors and PubMed IDs for the datasets are indicated on the y axis). The HR is the increase in risk of death for each unit increase in expression of CPD (see Methods). Blue error bars mark 95% confidence intervals. Number of patient samples used for each study is listed at the right side of the plot.
c. A forest plot showing the hazard ratios from an adjusted two-sided Cox proportional hazard model, using the CPD GSVA score as a continuous variable adjusted by age, TP53, KRAS, stage and gender.
d. Kaplan Meier (KM) plots of lung cancer patients with wild type KRAS (left panel) or mutant KRAS (right panel). Variation of a gene set downregulated by CPD deletion in H23 spheroids were first scored by GSVA (CPD GSVA score) in lung cancer patients. Differences in survival among lung cancer patients with high versus low CPD GSVA score are illustrated in KM plots. High CPD GSVA scores are significantly associated with poor prognosis in both KRAS wild type and mutant patient groups. However, the separation between high and low CPD GSVA groups is larger in KRAS mutant patients than wild type patients, suggesting an interaction between CPD and KRAS mutation in lung cancer patients. (P values calculated using a two-sided log-rank test)
e. Hazard plots illustrating the two-sided Cox proportional log relative hazard by expression levels of CPD in KRAS mutant versus KRAS wild type samples. Gray shading corresponds to 95% confidence intervals.
f. CPD deletion sensitizes NCI-H358 cells against ARS-853, a KRAS inhibitor. NCI-H358 cells with control Safe sgRNA (blue line) or CPD sgRNA (red line) were treated with escalating doses of ARS-853 for 72 hours in both 2D (top plot) and 3D (bottom plot). Live cells were then quantified using alamar blue assay. Relative growth of treated cells compared to the untreated cells are plotted in the titration plots. (n=4 wells in a 96 well plate. mean±s.e.m.)
g. CPD deletion does not show synergy with ARS-853 in NCI-H1792 cells. The same plots as in f were generated for NCI-H1792. (n=4 wells in a 96 well plate. mean±s.e.m.)
h. IGF1R were quantified from immunofluorescence images of IGF1R staining across 6 lung cancer cell lines. NCI-H1792 cells show very low IGF1R expression compared to other 5 cell lines. (n=4 for H1437, and n=5 for all other cell lines, mean±s.e.m.)
Supplementary Material
ACKNOWLEDGEMENTS
We thank J. Sage and members of the Bassik Lab for helpful discussions and critical reading of the manuscript. This work was supported by the NIH Director’s New Innovator Award Program (1DP2HD084069), NIH/NCI 1U01CA199261 to M.C.B., P.J., and A.S.C. This work was also partly supported by the Stanford SPARK Translational Research Grant. We also thank Drs. Daria Mochly-Rosen and Kevin Grimes at Stanford University for their support of this work. K.H. is supported by the Walter V. and Idun Berry award. S.E.P. is supported by National Science Foundation.
Footnotes
DATA AVAILABILITY
Sequencing data from all CRISPR screens and RNA-seq experiments are available under BioProject accession number PRJNA535417.
CODE AVAILABILITY
All screening data were analyzed with custom Python scripts (v2.7). They are available at https://github.com/biohank/CRISPR_screen_analysis. Custom Matlab scripts (v2015b) were used to quantify signals from all IF images and to analyze FACS data: request for the scripts can be made to K.H.
ETHICS DECLARATIONS
Competing interests
Authors through the Office of Technology Licensing at Stanford University have filed patent applications on methods for inhibiting tumor growth by inhibiting CPD as well as systems and methods for identifying CPD inhibitors and other tumor suppressors and/or oncogenes.
SUPPLEMENTARY INFORMATION
Supplementary Information includes Supplementary Discussion, ten Supplementary Tables, and one Supplementary Video.
REFERENCES
- 1.Garraway LA & Lander ES Lessons from the cancer genome. Cell 153, 17–37 (2013). [DOI] [PubMed] [Google Scholar]
- 2.Khatib A-M et al. Inhibition of proprotein convertases is associated with loss of growth and tumorigenicity of HT-29 human colon carcinoma cells importance of insulin-like growth factor-1 (IGF-1) receptor processing in IGF-1-mediated functions. J. Biol. Chem 276, 30686–30693 (2001). [DOI] [PubMed] [Google Scholar]
- 3.Unger C et al. Modeling human carcinomas: physiologically relevant 3D models to improve anti-cancer drug development. Adv. Drug Deliv. Rev 79–80, 50–67 (2014). [DOI] [PubMed] [Google Scholar]
- 4.Siolas D & Hannon GJ Patient-derived tumor xenografts: transforming clinical samples into mouse models. Cancer Res. 73, 5315–5319 (2013). [DOI] [PMC free article] [PubMed] [Google Scholar]
- 5.Sharpless NE & Depinho RA The mighty mouse: genetically engineered mouse models in cancer drug development. Nat. Rev. Drug Discov. 5, 741–754 (2006). [DOI] [PubMed] [Google Scholar]
- 6.Boj SF et al. Organoid models of human and mouse ductal pancreatic cancer. Cell 160, 324–338 (2015). [DOI] [PMC free article] [PubMed] [Google Scholar]
- 7.Debnath J & Brugge JS Modelling glandular epithelial cancers in three-dimensional cultures. Nat. Rev. Cancer 5, 675–688 (2005). [DOI] [PubMed] [Google Scholar]
- 8.Winters IP, Murray CW & Winslow MM Towards quantitative and multiplexed in vivo functional cancer genomics. Nat. Rev. Genet. 19, 741–755 (2018). [DOI] [PubMed] [Google Scholar]
- 9.Shalem O et al. Genome-scale CRISPR-Cas9 knockout screening in human cells. Science 343, 84–87 (2014). [DOI] [PMC free article] [PubMed] [Google Scholar]
- 10.Meyers RM et al. Computational correction of copy number effect improves specificity of CRISPR-Cas9 essentiality screens in cancer cells. Nat. Genet. 49, 1779–1784 (2017). [DOI] [PMC free article] [PubMed] [Google Scholar]
- 11.Wang T, Wei JJ, Sabatini DM & Lander ES Genetic screens in human cells using the CRISPR-Cas9 system. Science 343, 80–84 (2014). [DOI] [PMC free article] [PubMed] [Google Scholar]
- 12.Behan FM et al. Prioritization of cancer therapeutic targets using CRISPR–Cas9 screens. Nature 568, 511–516 (2019). [DOI] [PubMed] [Google Scholar]
- 13.Kim JW, Ho WJ & Wu BM The role of the 3D environment in hypoxia-induced drug and apoptosis resistance. Anticancer Res. 31, 3237–3245 (2011). [PubMed] [Google Scholar]
- 14.Loessner D et al. Bioengineered 3D platform to explore cell–ECM interactions and drug resistance of epithelial ovarian cancer cells. Biomaterials 31, 8494–8506 (2010). [DOI] [PubMed] [Google Scholar]
- 15.Dang CV & Semenza GL Oncogenic alterations of metabolism. Trends Biochem. Sci. 24, 68–72 (1999). [DOI] [PubMed] [Google Scholar]
- 16.Neal JT et al. Organoid Modeling of the Tumor Immune Microenvironment. Cell 175, 1972–1988.e16 (2018). [DOI] [PMC free article] [PubMed] [Google Scholar]
- 17.Gilbert LA et al. Genome-Scale CRISPR-Mediated Control of Gene Repression and Activation. Cell 159, 647–661 (2014). [DOI] [PMC free article] [PubMed] [Google Scholar]
- 18.Wang T et al. Gene Essentiality Profiling Reveals Gene Networks and Synthetic Lethal Interactions with Oncogenic Ras. Cell 168, 890–903.e15 (2017). [DOI] [PMC free article] [PubMed] [Google Scholar]
- 19.Chen S et al. Genome-wide CRISPR Screen in a Mouse Model of Tumor Growth and Metastasis. Cell vol. 160 1246–1260 (2015). [DOI] [PMC free article] [PubMed] [Google Scholar]
- 20.Pan J et al. Interrogation of Mammalian Protein Complex Structure, Function, and Membership Using Genome-Scale Fitness Screens. Cell Syst 6, 555–568.e7 (2018). [DOI] [PMC free article] [PubMed] [Google Scholar]
- 21.Boyle EA, Pritchard JK & Greenleaf WJ High‐resolution mapping of cancer cell networks using co‐functional interactions. Mol. Syst. Biol 14, e8594 (2018). [DOI] [PMC free article] [PubMed] [Google Scholar]
- 22.Wainberg M et al. A genome-wide almanac of co-essential modules assigns function to uncharacterized genes. bioRxiv 827071 (2019) doi: 10.1101/827071. [DOI] [PMC free article] [PubMed] [Google Scholar]
- 23.Tsherniak A et al. Defining a Cancer Dependency Map. Cell 170, 564–576.e16 (2017). [DOI] [PMC free article] [PubMed] [Google Scholar]
- 24.Hanahan D & Weinberg RA Hallmarks of cancer: the next generation. Cell 144, 646–674 (2011). [DOI] [PubMed] [Google Scholar]
- 25.Morgens DW et al. Genome-scale measurement of off-target activity using Cas9 toxicity in high-throughput screens. Nat. Commun. 8, 15178 (2017). [DOI] [PMC free article] [PubMed] [Google Scholar]
- 26.Ostrem JM, Peters U, Sos ML, Wells JA & Shokat KM K-Ras(G12C) inhibitors allosterically control GTP affinity and effector interactions. Nature 503, 548–551 (2013). [DOI] [PMC free article] [PubMed] [Google Scholar]
- 27.Patricelli MP et al. Selective Inhibition of Oncogenic KRAS Output with Small Molecules Targeting the Inactive State. Cancer Discov. 6, 316–329 (2016). [DOI] [PubMed] [Google Scholar]
- 28.Lito P, Solomon M, Li L-S, Hansen R & Rosen N. Allele-specific inhibitors inactivate mutant KRAS G12C by a trapping mechanism. Science 351, 604–608 (2016). [DOI] [PMC free article] [PubMed] [Google Scholar]
- 29.Janes MR et al. Targeting KRAS Mutant Cancers with a Covalent G12C-Specific Inhibitor. Cell 172, 578–589.e17 (2018). [DOI] [PubMed] [Google Scholar]
- 30.Forbes SA et al. COSMIC: somatic cancer genetics at high-resolution. Nucleic Acids Res. 45, D777–D783 (2017). [DOI] [PMC free article] [PubMed] [Google Scholar]
- 31.Campbell JD et al. Distinct patterns of somatic genome alterations in lung adenocarcinomas and squamous cell carcinomas. Nat. Genet. 48, 607–616 (2016). [DOI] [PMC free article] [PubMed] [Google Scholar]
- 32.Pampaloni F, Reynaud EG & Stelzer EHK The third dimension bridges the gap between cell culture and live tissue. Nat. Rev. Mol. Cell Biol 8, 839–845 (2007). [DOI] [PubMed] [Google Scholar]
- 33.Tidyman WE & Rauen KA The RASopathies: developmental syndromes of Ras/MAPK pathway dysregulation. Curr. Opin. Genet. Dev 19, 230–236 (2009). [DOI] [PMC free article] [PubMed] [Google Scholar]
- 34.Song L & Fricker LD Purification and characterization of carboxypeptidase D, a novel carboxypeptidase E-like enzyme, from bovine pituitary. J. Biol. Chem 270, 25007–25013 (1995). [DOI] [PubMed] [Google Scholar]
- 35.Varlamov O & Fricker LD Intracellular trafficking of metallocarboxypeptidase D in AtT-20 cells: localization to the trans-Golgi network and recycling from the cell surface. J. Cell Sci. 111 ( Pt 7), 877–885 (1998). [DOI] [PubMed] [Google Scholar]
- 36.Alarcón C et al. A Kex2-related endopeptidase activity present in rat liver specifically processes the insulin proreceptor. Biochem. J 301 ( Pt 1), 257–265 (1994). [DOI] [PMC free article] [PubMed] [Google Scholar]
- 37.Komada M et al. Proteolytic processing of the hepatocyte growth factor/scatter factor receptor by furin. FEBS Lett. 328, 25–29 (1993). [DOI] [PubMed] [Google Scholar]
- 38.Grice DM et al. Golgi calcium pump secretory pathway calcium ATPase 1 (SPCA1) is a key regulator of insulin-like growth factor receptor (IGF1R) processing in the basal-like breast cancer cell line MDA-MB-231. J. Biol. Chem. 285, 37458–37466 (2010). [DOI] [PMC free article] [PubMed] [Google Scholar]
- 39.Han K et al. Synergistic drug combinations for cancer identified in a CRISPR screen for pairwise genetic interactions. Nat. Biotechnol. 35, 463–474 (2017). [DOI] [PMC free article] [PubMed] [Google Scholar]
- 40.Bassi DE, Fu J, de Cicco RL & Klein-Szanto AJP Proprotein convertases: ‘Master switches’ in the regulation of tumor growth and progression. Molecular Carcinogenesis vol. 44 151–161 (2005). [DOI] [PubMed] [Google Scholar]
- 41.Hodges RS, Heaton RJ, Parker JM, Molday L & Molday RS Antigen-antibody interaction. Synthetic peptides define linear antigenic determinants recognized by monoclonal antibodies directed to the cytoplasmic carboxyl terminus of rhodopsin. J. Biol. Chem 263, 11768–11775 (1988). [PubMed] [Google Scholar]
- 42.King H, Aleksic T, Haluska P & Macaulay VM Can we unlock the potential of IGF-1R inhibition in cancer therapy? Cancer Treat. Rev. 40, 1096–1105 (2014). [DOI] [PMC free article] [PubMed] [Google Scholar]
- 43.Gentles AJ et al. The prognostic landscape of genes and infiltrating immune cells across human cancers. Nat. Med. 21, 938–945 (2015). [DOI] [PMC free article] [PubMed] [Google Scholar]
- 44.Pylayeva-Gupta Y, Grabocka E & Bar-Sagi D. RAS oncogenes: weaving a tumorigenic web. Nat. Rev. Cancer 11, 761–774 (2011). [DOI] [PMC free article] [PubMed] [Google Scholar]
- 45.Lindsay CR & Blackhall FH Direct Ras G12C inhibitors: crossing the rubicon. Br. J. Cancer 121, 197–198 (2019). [DOI] [PMC free article] [PubMed] [Google Scholar]
- 46.Molina-Arcas M, Hancock DC, Sheridan C, Kumar MS & Downward J. Coordinate direct input of both KRAS and IGF1 receptor to activation of PI3 kinase in KRAS-mutant lung cancer. Cancer Discov. 3, 548–563 (2013). [DOI] [PMC free article] [PubMed] [Google Scholar]
- 47.Lasko LM et al. Discovery of a selective catalytic p300/CBP inhibitor that targets lineage-specific tumours. Nature 550, 128–132 (2017). [DOI] [PMC free article] [PubMed] [Google Scholar]
- 48.Gjorevski N et al. Designer matrices for intestinal stem cell and organoid culture. Nature 539, 560–564 (2016). [DOI] [PubMed] [Google Scholar]
- 49.Huch M & Koo B-K Modeling mouse and human development using organoid cultures. Development 142, 3113–3125 (2015). [DOI] [PubMed] [Google Scholar]
- 50.Thoma CR, Zimmermann M & Agarkova I. 3D cell culture systems modeling tumor growth determinants in cancer target discovery. Adv. Drug Deliv. Rev. (2014). [DOI] [PubMed] [Google Scholar]
REFERENCES FOR METHODS
- 51.Lawrence MS et al. Discovery and saturation analysis of cancer genes across 21 tumour types. Nature 505, 495–501 (2014). [DOI] [PMC free article] [PubMed] [Google Scholar]
- 52.Nepusz T, Yu H & Paccanaro A. Detecting overlapping protein complexes in protein-protein interaction networks. Nat. Methods 9, 471–472 (2012). [DOI] [PMC free article] [PubMed] [Google Scholar]
- 53.Storey JD & Tibshirani R. Statistical significance for genomewide studies. Proc. Natl. Acad. Sci. U. S. A. 100, 9440–9445 (2003). [DOI] [PMC free article] [PubMed] [Google Scholar]
- 54.Mi H, Muruganujan A & Thomas PD PANTHER in 2013: modeling the evolution of gene function, and other gene attributes, in the context of phylogenetic trees. Nucleic Acids Res. 41, D377–86 (2013). [DOI] [PMC free article] [PubMed] [Google Scholar]
- 55.Bray NL, Pimentel H, Melsted P & Pachter L. Erratum: Near-optimal probabilistic RNA-seq quantification. Nat. Biotechnol. 34, 888 (2016). [DOI] [PubMed] [Google Scholar]
- 56.Pimentel HJ, Bray N, Puente S, Melsted P & Pachter L Differential analysis of RNA-Seq incorporating quantification uncertainty. doi: 10.1101/058164. [DOI] [PubMed] [Google Scholar]
- 57.Hänzelmann S, Castelo R & Guinney J. GSVA: gene set variation analysis for microarray and RNA-seq data. BMC Bioinformatics 14, 7 (2013). [DOI] [PMC free article] [PubMed] [Google Scholar]
- 58.Law CW, Chen Y, Shi W & Smyth GK voom: Precision weights unlock linear model analysis tools for RNA-seq read counts. Genome Biol. 15, R29 (2014). [DOI] [PMC free article] [PubMed] [Google Scholar]
Associated Data
This section collects any data citations, data availability statements, or supplementary materials included in this article.