Abstract
Objective
To develop a fully automated AI system to quantitatively assess the disease severity and disease progression of COVID-19 using thick-section chest CT images.
Methods
In this retrospective study, an AI system was developed to automatically segment and quantify the COVID-19-infected lung regions on thick-section chest CT images. Five hundred thirty-one CT scans from 204 COVID-19 patients were collected from one appointed COVID-19 hospital. The automatically segmented lung abnormalities were compared with manual segmentation of two experienced radiologists using the Dice coefficient on a randomly selected subset (30 CT scans). Two imaging biomarkers were automatically computed, i.e., the portion of infection (POI) and the average infection HU (iHU), to assess disease severity and disease progression. The assessments were compared with patient status of diagnosis reports and key phrases extracted from radiology reports using the area under the receiver operating characteristic curve (AUC) and Cohen’s kappa, respectively.
Results
The dice coefficient between the segmentation of the AI system and two experienced radiologists for the COVID-19-infected lung abnormalities was 0.74 ± 0.28 and 0.76 ± 0.29, respectively, which were close to the inter-observer agreement (0.79 ± 0.25). The computed two imaging biomarkers can distinguish between the severe and non-severe stages with an AUC of 0.97 (p value < 0.001). Very good agreement (κ = 0.8220) between the AI system and the radiologists was achieved on evaluating the changes in infection volumes.
Conclusions
A deep learning–based AI system built on the thick-section CT imaging can accurately quantify the COVID-19-associated lung abnormalities and assess the disease severity and its progressions.
Key Points
• A deep learning–based AI system was able to accurately segment the infected lung regions by COVID-19 using the thick-section CT scans (Dice coefficient ≥ 0.74).
• The computed imaging biomarkers were able to distinguish between the non-severe and severe COVID-19 stages (area under the receiver operating characteristic curve 0.97).
• The infection volume changes computed by the AI system were able to assess the COVID-19 progression (Cohen’s kappa 0.8220).
Electronic supplementary material
The online version of this article (10.1007/s00330-020-07042-x) contains supplementary material, which is available to authorized users.
Keywords: COVID-19, Deep learning, Disease progression, Artificial intelligence
Introduction
Coronavirus disease 2019 (COVID-19) has rapidly spread all over the world since the end of 2019, and 1,436,198 cases have been confirmed as COVID-19 to date (9 April 2020) [1]. Reverse-transcription polymerase chain reaction (RT-PCR) is used as the standard diagnostic method. However, it suffers from low sensitivities as reported in [2, 3]. Computed tomography (CT) imaging is often adopted to confirm the COVID-19 in China and some European countries, e.g., Netherlands. CT plays a key role in the diagnosis and treatment assessment of COVID-19 due to its high sensitivity [2, 4].
The explosive growing number of COVID-19 patients requires the automated AI-based computer-aided diagnosis (CAD) systems that can accurately and objectively detect the disease-infected lung regions and assess the severity and the progressions. Recently, several deep learning–based AI systems were developed to differentiate the COVID-19 and community-acquired pneumonia (CAP) [5] or other viral pneumonia [6, 7], and to quantify the infection regions [8–11]. However, all these previous AI systems built upon the high-resolution thin-section CT images, which have high radiation doses and require higher costs. In contrast, the thick-section CT images from affordable CT scanners have relatively low radiation doses and are popularly used in hospitals worldwide, especially in primary care. Hence, it is worthwhile to develop an AI-based CAD system using thick-section CT images.
In this study, we developed a fully automated AI system to quantify COVID-19-associated lung abnormalities and assess the disease severity and the disease progressions using thick-section chest CT images. To the best of our knowledge, this is the first AI-based study to quantitatively assess the COVID-19 severity and disease progression using the thick-section CT images.
Materials and methods
Patients
This study was approved by the Ethics of Committees of the First Hospital of Changsha, Hunan, China. Informed consent for this retrospective study was waived. Five hundred forty-eight CT scans from 204 patients diagnosed with COVID-19 (RT-PCR test positive) were retrospectively reviewed for the period from 23 January 2020 to 12 February 2020 in the First Hospital of Changsha, which is the only appointed hospital healing COVID-19 patients in Changsha city, Hunan province, China. Eight patients under 18 years old were excluded from this study. The characteristics of the rest 196 adult patients were summarized in Table 1. According to the guideline of 2019-nCoV (trial version 7) issued by the China National Health Commission [12], the severity of COVID-19 includes mild, common, severe, and critical types. Since there were few mild and critical cases, we categorized all the CT scans into the severe group (including severe and critical) and non-severe group (mild and common). In total, we had 79 severe CT scans from 32 patients, and 452 general CT scans from 164 patients. It should be noticed that some patients were in the non-severe phase when they entered the hospital, but may develop into a severe phase during treatment. All the COVID-19 patients were used to test the AI system performance.
Table 1.
Characteristics of COVID-19 patients in this study
| All patients | Severe patients | Non-severe patients | p value | |
|---|---|---|---|---|
| No. | 196 | 32 | 164 | - |
| Age (year) | 47 ± 15 | 56 ± 14 | 45 ± 14 | < 0.001 |
| Male | 96 (49%) | 14 (44%) | 82 (50%) | 0.52 |
| Exams | 531 | 95 | 436 | - |
| Patients with multiple exams | 162 (83%) | 31 (97%) | 131 (80%) | - |
Note: Values in parentheses are the percentage. Ages are reported as mean ± standard deviation. COVID-19, coronavirus disease 2019
To train the lung abnormalities’ segmentation deep learning model, another multi-center pneumonia dataset was collected consisting of 531 CT scans with manual annotations. The informed consent waiver of the training data was approved by the Ethics of Committees of multiple institutes.
CT protocol
All COVID-19 patients underwent CT scanning using the GE Brivo CT325 scanner (General Electric). The scanning protocol was as follows: 120 kV; adaptive tube current (30–70 mAs); pitch = 0.99–1.22 mm; slice thickness = 10 mm; field of view, 350 mm2; matrix, 512 × 512; and breath-hold at full inspiration. CT images were reconstructed with 5-mm slice thickness and the soft reconstruction kernel. The effective dose for all CT scans used in the study was 0.62 msv. Note that the radiation dose (CTDI = 3.43 mGy) from the thick-section CT imaging is reasonably lower than the conventional high-resolution chest CT imaging (Siemens SOMATOM go. Top, CTDI = 6.03 mGy, effective dose = 2.94msv). For the multi-center pneumonia dataset, the 538 CT scans were from Siemens, Hitachi, GE, Philips, and United Imaging scanners. Slice thickness ranged from 1.0 to 5.0 mm. (Details of the CT imaging protocols for this multi-center pneumonia dataset are presented in the Table of the supplemental material.)
Deep learning model for lung abnormality segmentation
We developed a 2.5D-based deep learning model to segment the pneumonia infection regions using the UNet [13] structure equipped with the Resnet 34 backbone [14]. It is able to integrate the high-resolution information into the axial view with the coarse continuity information along the vertical view. We also trained a standard 2D UNet to segment the lung fields in thick-section CT scans. The model was trained on another multi-center annotated CAP CT dataset knowing that COVID-19 shares similar abnormal lung patterns to other pneumonia such as ground glass opacity (GGO), consolidation, and bilateral infiltration. (Details of deep learning model learning are presented in the supplemental material.)
To quantitatively evaluate the accuracy of segmentation on our test dataset, two radiologists with 20 and 15 years experience (Z. Z. and Y. X.), who were blind to each other, manually delineated the infection regions of interests (ROIs) to serve as the reference standard. We randomly selected 30 CT scans of 30 patients (3 severe and 27 non-severe) and quantitatively evaluated the accuracy of the infection region segmentation on this subset.
Imaging biomarker computation
Based on the lung field and infection region segmentation masks, we computed the quantitative imaging biomarkers for COVID-19, i.e., the portion of infection (POI) and the average infection HU (iHU). Specifically, we computed the POI as the infection volume divided by the total lung volume in physical unit, and the iHU as the average HU values in the infection regions.
The computed POI and iHU are consistent with the latest version (the seventh) of COVID-19 diagnostic guidelines released by the National Health Commission of China [12]. The guideline states that the POI is one of the principles to differentiate the severe and non-severe patients. It also reports that lung findings in chest CT may start from small subpleural GGO to crazy paving pattern and consolidation when patients conditions getting worse, which corresponds to the increase in iHU changes.
The POI and iHU were applied to distinguish the COVID-19 severity. Moreover, the changes in POI and iHU in patient’s longitudinal CT scans were calculated to evaluate the COVID-19 progression. We calculated the changes in the POI and iHU for each consecutive CT scan pair of the patients. The key phrases extracted from patients’ radiology reports were used as a ground-truth reference. The correspondence of the computed biomarker changes with radiologists’ assessment was described in Table 2. To measure the agreement between the AI-computed imaging biomarker changes and the radiologists’ assessment, we first binarize the biomarker changes. The value 1 (or 0) represented the increasing (or decreasing) of biomarkers and its corresponded phrases of radiology reports. The AI-based assessment of disease severity and progression was compared with patients’ diagnosis status extracted from clinical and radiology reports on 184 and 82 cases, respectively.
Table 2.
Correspondence between the imaging biomarker changes and radiology reports
| Phrase from radiology reports | Imaging biomarker changes | No. of phrase occurrences |
|---|---|---|
| “Infection region has (partially) expanded” | Increasing of POI | 86 |
| “Infection region has (partially) contracted” | Decreasing of POI | 98 |
| “Density of infection region has (partially) increased” | Increasing of iHU | 43 |
| “Density of infection region has (partially) decreased” | Decreasing of iHU | 39 |
Note: Opposite phrase (partially expanded and partially contracted) that exits in six patients were excluded in this table. POI, portion of infection; iHU, average infection Hounsfield unit
Statistical analysis and evaluation metrics
Statistical analysis was performed by SAS (version 9.4) and Matlab (version 2018b). Sensitivity and specificity were calculated using specific cutoffs by using the Youden index generated from the receiver operating characteristic curve (ROC). Cohen’s kappa statistic was used to measure the agreement between the disease progress assessment from AI and radiologists. χ2 test was used to compare the differences among different groups. A two-sided p value less than 0.05 was considered to be statistically significant. The Dice coefficient was computed to evaluate the agreement between the automatic infection region segmentation and the manual infection delineations by radiologists.
Results
Segmentation of lung infection region
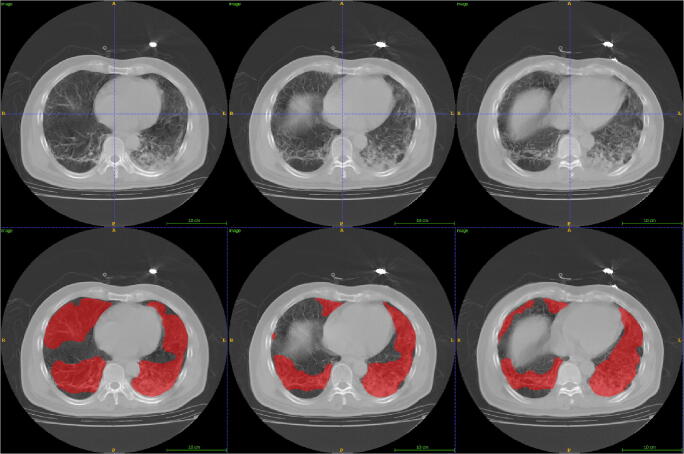
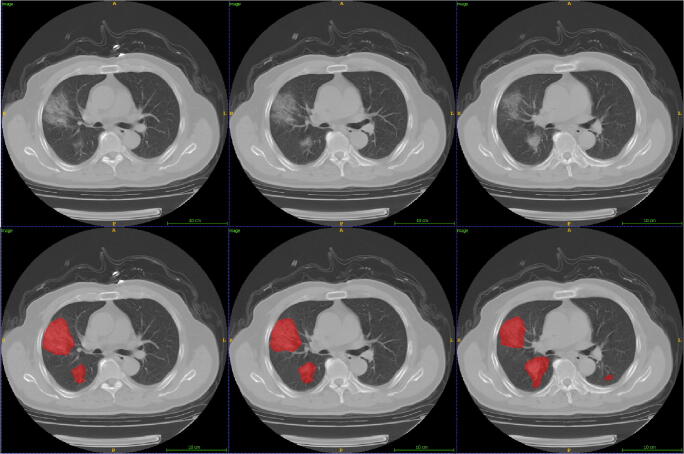
Examples of the infection region segmentation for severe and non-severe patients in CT were shown in Figs. 1 and 2. The average Dice coefficient between our method and two radiologists was 0.74 ± 0.28 (median = 0.79, ZZ) and 0.76 ± 0.29 (median = 0.84, YX), respectively. The inter-observer variability between the two radiologists was also assessed using the Dice coefficient, which is 0.79 ± 0.25 (media = 0.85).
Fig. 1.
Lesion segmentation for three consecutive axial CTs from a severe patient. First row: original image; second row: lesion segmentation image
Fig. 2.
Lesion segmentation for three consecutive axial CTs from a non-severe patient. First row: original image; second row: lesion segmentation image
Assessment of severe and non-severe COVID-19
Based on the clinical diagnosis reports, 79 CT scans had been identified to belong to the severe group, while 452 scans were in the non-severe group. Figure 3 shows the box-plot of the computed POI and iHU for severe and non-severe groups. Note that both the POI and iHU show a significant difference between severe and non-severe groups with a p value of < 0.001.
Fig. 3.

Box-plot of POI (a) and iHU (b) for the severe and non-severe patients. POI, portion of infection; iHU, average infection Hounsfield unit
Predictive probabilities were generated using the logistic regression model. Comparisons of different imaging biomarkers for assessment of severe and non-severe exams are shown in Table 3. Using the POI as input, the sensitivity and specificity for identifying the severe group are 92.4% and 90.5%, respectively. Using the iHU as input, the sensitivity and specificity for identifying the severe group are 91.1% and 41.6%, respectively. When combining the POI with iHU, the sensitivity and specificity for identifying the severe group are 93.7% and 88.1%, respectively. The ROC curves are shown in Fig. 4. The corresponding AUC values for using the iHU, POI, and POI + iHU are 0.69, 0.97, and 0.97, respectively. The odds of severity at 1sd increase of POI was 18.762 (95% CI, 10.056, 35.000) (p < 0.001) times higher than the baseline POI; the odds of severity at 1sd increase of iHU was 1.824 (95% CI, 1.430, 2.326) (p < 0.001) times higher than the odds of severity at baseline iHU. The Akaike information criterion (AIC) for POI, iHU, and POI + iHU is 174.877, 426.160, and 173.767, respectively.
Table 3.
The performance of deep learning framework
| Sensitivity % | Specificity % | AUC | p value | |
|---|---|---|---|---|
| POI | 92.41 (73 of 79) [84.85, 97.50] | 90.49 (409 of 452) [87.60, 92.79] | 0.97 [0.95, 0.98] | < 0.001 |
| iHU | 91.14 (72 of 79) [82.44, 96.15] | 41.59 (188 of 452) [36.95, 46.26] | 0.69 [0.63, 0.74] | < 0.001 |
| POI + iHU | 93.67 (74 of 79) [86.60, 97.73] | 88.05 (398 of 452) [85.07, 90.81] | 0.97 [0.94, 0.98] | < 0.001 |
Note: Values in parentheses are the numbers for the percentage calculation. Values in brackets are 95% confidence intervals [95%CI, %]. AUC, area under the receiver operating characteristic curve; POI, portion of infection; iHU, average infection Hounsfield unit
Fig. 4.
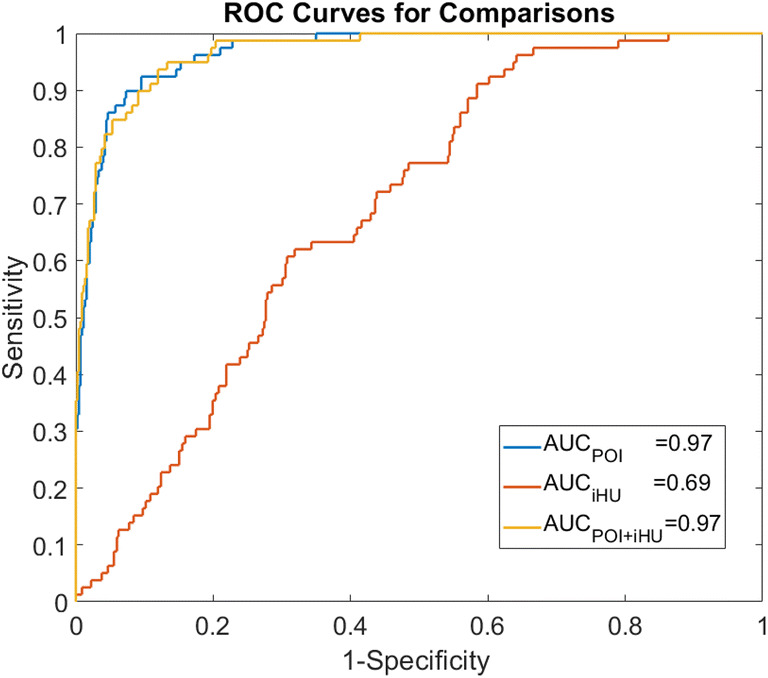
Receiver operating characteristic (ROC) curves of the model. AUC, area under the receiver operating characteristic curve; POI, portion of infection; iHU, average infection Hounsfield unit
Assessment of disease progression
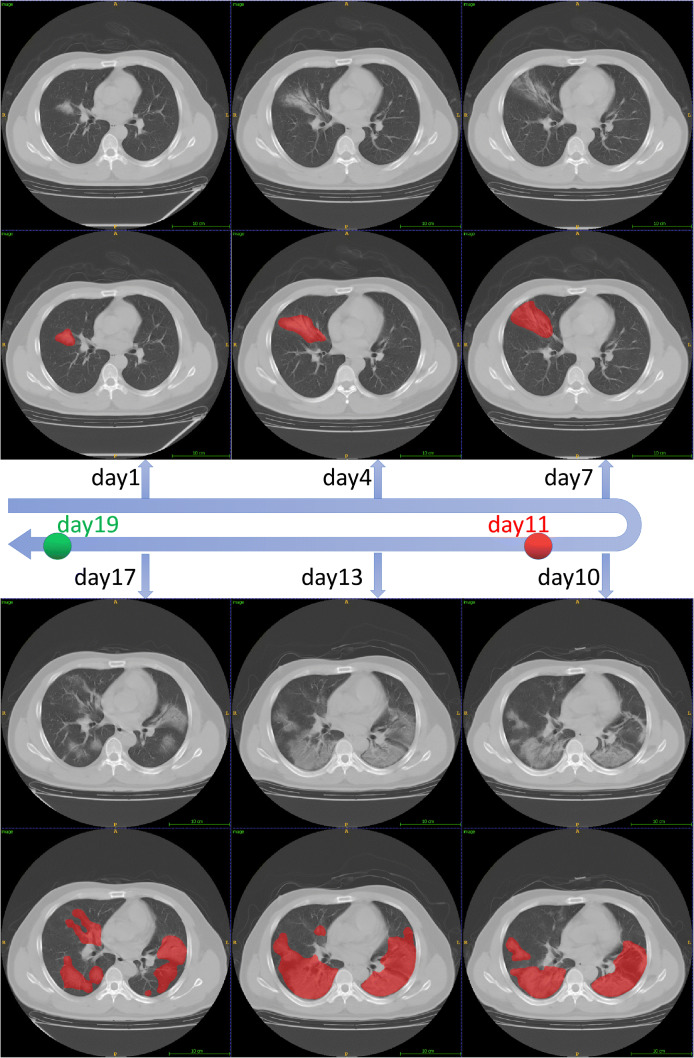
Figure 5 shows a qualitative example of the automatically segmented infection regions of a severe patient’s longitudinal CT scans. Cohen’s kappa statistic is shown in Table 4. The very good and moderate agreements were achieved between two AI imaging biomarkers and radiologists’ assessment if we only consider the changes on whole lung level (ignoring the cases with a phrase of “partially changes”). The change in POI showed overall better agreement (very good and good) with radiologists’ assessment than iHU (moderate and fair).
Fig. 5.
The lesion segmentation of six adjacent CT scans that taken from Jan. 27 to Feb. 12 for a severe patient. The red dot corresponds to the time given for the “severe” diagnosis and the green point corresponds to the time given for the “non-severe” diagnosis
Table 4.
Correspondence between the imaging biomarker changes and radiology reports
| No. of cases | Observed agreement | Cohen’s kappa | Kappa error | Strength of agreement | |
|---|---|---|---|---|---|
| Infection region changes | 142 | 0.9155 | 0.8220 | 0.0492 | Very good |
| Infection region changes (including partially changes) | 184 | 0.8533 | 0.7044 | 0.0525 | Good |
| Intensity changes | 54 | 0.7321 | 0.4643 | 0.1184 | Moderate |
| Intensity changes (including partially changes) | 82 | 0.6829 | 0.3718 | 0.1018 | Fair |
Note: Strength of agreement: 0–0.20, poor; 0.21–0.40, fair; 0.41–0.60, moderate; 0.61–0.80, good; 0.81–1.00, very good
Discussion
In this study, we developed and evaluated an AI system for quantitative analysis of coronavirus disease 2019 (COVID-19) from thick-section chest CT scans. Our findings can be summarized as follows: (1) The deep learning model that trained on a multi-center CAP CT dataset could be directly applied for segmenting the lung abnormalities in COVID-19 patients; (2) the portion of infection (POI) and the average infection HU (iHU), with the area under the receiver operating characteristic curve (AUC) of 0.97 (95% CI 0.95, 0.98) and 0.69 (95% CI 0.63, 0.74), showed significant difference (p value < 0.001) in severe and non-severe COVID-19 states; (3) POI showed very good agreement (κ = 0.8220) with the radiologist reports on evaluating the changes in infection volumes on the whole lung level.
Though high-resolution CT is shown to have high sensitivity in the detection of COVID-19, both cost and radiation doses are relatively high. In contrast, our study for the first time shows that an AI system can efficiently segment and quantify the COVID-19 lung infections in thick-section CT images (with relatively low radiation doses). This would benefit the developing or low-income countries, where the quantification of COVID-19 severity and the triage can be determined effectively using thick-section CT volumes of affordable CT scanners.
Our diagnosis system is a multi-stage AI system. The key step is to extract infection region. It is interesting that these processing modules are trained using CAP cases while the detection and segmentation accuracy is still closed to the radiologist level. The Dice coefficients between the COVID-19-infected region segmentation of the AI system and two experienced radiologists were 0.74 ± 0.28 and 0.76 ± 0.29, respectively, which were close to the inter-observer agreement, i.e., 0.79 ± 0.25.
Among our computed imaging biomarkers, only the POI shows high sensitivity and specificity for differentiating the severe from non-severe COVID-19 groups. This indicates the POI is an effective imaging biomarker to assess the severity of COVID-19 patients. Although iHU value is also able to reflect infection progress, however, it is affected by several other disease irrelevant factors, such as the reconstruction slice thickness and the respiration status [15, 16]. For instance, consolidation on HRCT images might be displayed as GGO on thick-section CT images.
The changes in volume and density of infected region are two key indicators that used by radiologists for COVID-19 progression assessment. However, it is time-consuming (or even impractical) for radiologists to produce quantitative measurements for this longitudinal analysis. Our AI system provided a quantitative and objective measurement, i.e., the POI, which shows strong agreement with radiologists’ qualitative judgments. More importantly, the AI-based longitudinal disease quantification is precise, reproducible, and fast, which can reduce the reading time of radiologists for COVID-19 in each patient and improve the quality of the disease progression assessment [10].
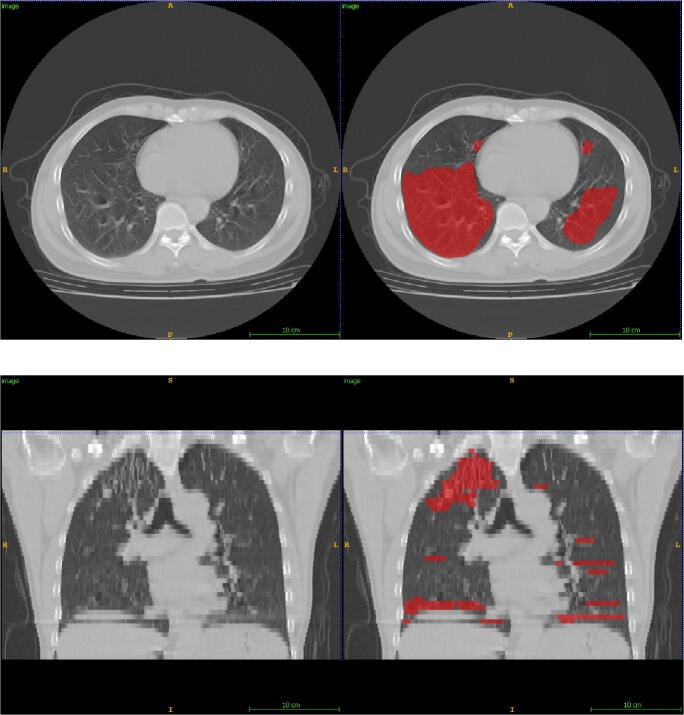
This study has several limitations. Firstly, we only evaluated changes in imaging biomarkers at the whole lung level in certain phrase. Although our model can compute the biomarkers at the lobe level, the standard phrases from the radiology reports were mostly at the whole lung level. Furthermore, some phrases in the reports like “lesion absorption” might respond to either infection region decreasing or HU value reduction. Thus, it needs more sophisticated and precise analysis evaluating our model in the future. Secondly, motion artifacts due to respiration and heart motion may cause false-positive segmentation in the AI system. We noticed that some false-positive segmentation affected the longitudinal infection evaluations (Fig. 6). One possible solution is to identify the motion artifacts before applying the infection segmenting. Finally, our model only tested COVID-19-positive patients. A recent study has shown that a deep learning–based AI classification model can detect the COVID-19 and distinguish it from the community-acquired pneumonia and other non-pneumonic lung diseases using thin-section HRCT [5]. As the next step, it would be interesting to see if our model can also differentiate pneumonia caused by COVID-19 and other factors using the thick-section CT imaging.
Fig. 6.
The false-positive segmentation from an exam with motion artifacts
In conclusion, a deep learning–based AI system is developed to quantify COVID-19 abnormal lung patterns and assess the disease severity and the progression using thick-section chest CT images. The imaging biomakers computed from the AI system could be used for reproducing several findings of infection change from the reports by radiologists. These results demonstrate that the deep learning–based tool has the ability to help radiologists on diagnosing and follow-up treatment for COVID-19 patients based on CT scans.
Electronic supplementary material
(DOCX 521 kb)
Abbreviations
- AUC
Area under the receiver operating characteristic curve
- CI
Confidence interval
- COVID-19
Coronavirus disease 2019
- iHU
Average infection Hounsfield unit
- POI
Portion of infection
Funding information
This work was partially supported by the National Natural Science Funding of China (No. 61801491), Natural Science Funding of Hunan Province (No. 2019JJ50728), the Research Program of the Hunan Health and Family Planning Commission (No. B20180393), and the Foundation from Changsha Scientific and Technical Bureau, China (No. kq2001001).
Compliance with ethical standards
Guarantor
The scientific guarantor of this publication is Prof. Tang Yuling (Department of Respiratory Medicine, The First Hospital of Changsha City, Changsha, China. Email: tyl71523@qq.com).
Conflict of interest
The authors of this manuscript declare no relationships with any companies, whose products or services may be related to the subject matter of the article.
Statistics and biometry
No complex statistical methods were necessary for this paper.
Informed consent
Written informed consent was waived by the Institutional Review Board.
Ethical approval
Institutional Review Board approval was obtained.
Methodology
• retrospective
• diagnostic or prognostic study
• performed at one institution
Footnotes
Publisher’s note
Springer Nature remains neutral with regard to jurisdictional claims in published maps and institutional affiliations.
Zhang Li and Zheng Zhong contributed equally to this work.
Contributor Information
Lingyun Huang, Email: huanglingyun691@pingan.com.cn.
Yuling Tang, Email: tyl71523@qq.com.
References
- 1.Coronavirus disease 2019 (covid-19) situation report-80. World Health Organization Web site. https://www.who.int/docs/default-source/coronaviruse/situation-reports/20200409-sitrep80-covid-19.pdf?sfvrsn=1b685d64. Published April 9, 2020. Accessed 9 Apr 2020
- 2.Ai T, Yang Z, Hou H et al (2020) Correlation of chest CT and RT-PCR testing in coronavirus disease 2019 (COVID-19) in China: a report of 1014 cases. Radiology. 200642. 10.1148/radiol.2020200642 [DOI] [PMC free article] [PubMed]
- 3.Fang Y, Zhang H, Xie J et al (2020) Sensitivity of chest CT for COVID-19: comparison to RT-PCR. Radiology. 200432. 10.1148/radiol.2020200432 [DOI] [PMC free article] [PubMed]
- 4.Xie X, Zhong Z, Zhao W, Zheng C, Wang F, Liu J (2020) Chest CT for typical 2019-nCoV pneumonia: relationship to negative RT-PCR testing. Radiology. 200343. 10.1148/radiol.2020200343 [DOI] [PMC free article] [PubMed]
- 5.Li L, Qin L, Xu Z et al (2020) Artificial intelligence distinguishes covid-19 from community acquired pneumonia on chest ct. Radiology. 200905. 10.1148/radiol.2020200905
- 6.Chen J, Wu L, Zhang J et al (2020) Deep learning-based model for detecting 2019 novel coronavirus pneumonia on high-resolution computed tomography: a prospective study. medRxiv. 10.1101/2020.02.25.20021568 [DOI] [PMC free article] [PubMed]
- 7.Wang S, Kang B, Ma J et al (2020) A deep learning algorithm using CT images to screen for corona virus disease (COVID-19). medRxiv. 10.1101/2020.02.14.20023028 [DOI] [PMC free article] [PubMed]
- 8.Shan F, Gao Y, Wang J et al (2020) Lung infection quantification of COVID-19 in CT images with deep learning. arXiv preprint arXiv:200304655
- 9.Tang L, Zhang X, Wang Y, Zeng X. Severe COVID-19 pneumonia: assessing inflammation burden with volume-rendered chest CT. Radiology: Cardiothoracic Imaging. 2020;2(2):e200044. doi: 10.1148/ryct.2020200044. [DOI] [PMC free article] [PubMed] [Google Scholar]
- 10.Huang L, Han R, Ai T et al (2020) Serial quantitative chest CT assessment of COVID-19: deep-learning approach. Radiology: Cardiothoracic Imaging 2(2):e200075. 10.1148/ryct.2020200075 [DOI] [PMC free article] [PubMed]
- 11.Cao Y, Xu Z, Feng J et al (2020) Longitudinal assessment of COVID-19 using a deep learning–based quantitative CT pipeline: illustration of two cases. Radiology: Cardiothoracic Imaging 2(2):e200082. 10.1148/ryct.2020200082 [DOI] [PMC free article] [PubMed]
- 12.Diagnosis and treatment protocol for novel coronavirus pneumonia (trial version 7). National Health Commission of People's Republic of China Web site. http://en.nhc.gov.cn/2020-03/29/c78469.htm. Published March 3, 2020. Updated March 29, 2020. Accessed 9 Apr 2020
- 13.He K, Zhang X, Ren S, Sun J (eds) (2016) Deep residual learning for image recognition. Proceedings of the IEEE conference on computer vision and pattern recognition
- 14.Ronneberger O, Fischer P, Brox T (eds) (2015) U-net: Convolutional networks for biomedical image segmentation. International Conference on Medical image computing and computer-assisted intervention. Springer. 10.1007/978-3-319-24574-4_28
- 15.Achenbach S, Boehmer K, Pflederer T et al (2010) Influence of slice thickness and reconstruction kernel on the computed tomographic attenuation of coronary atherosclerotic plaque. J Cardiovasc Comput Tomogr 4(2):110–115. 10.1016/j.jcct.2010.01.013 [DOI] [PubMed]
- 16.Rosenblum LJ, Mauceri RA, Wellenstein DE et al (1980) Density patterns in the normal lung as determined by computed tomography. Radiology. 137(2):409–416. 10.1148/radiology.137.2.7433674 [DOI] [PubMed]
Associated Data
This section collects any data citations, data availability statements, or supplementary materials included in this article.
Supplementary Materials
(DOCX 521 kb)


