

Abstract
Youth metabolic equivalents (METy) are sometimes operationally defined as multiples of predicted basal metabolic rate (METyBMR), and other times as multiples of measured resting metabolic rate (METyRMR).
PURPOSE:
To examine the comparability of METyBMR and METyRMR.
METHODS:
Indirect calorimetry data (Cosmed K4b2) were analyzed from two studies, with a total sample of 245 youth (125 males, 6–18 years old, 37.4% overweight or obese). Schofield’s equations were used to predict BMR, and K4b2 data from 30 min of supine rest were used to assess RMR. Participants performed structured physical activities (PA) of various intensities, and steady state oxygen consumption was divided by predicted BMR and measured RMR to calculate METyBMR and METyRMR, respectively. Two-way (Activity × METy calculation) analysis of variance was used to compare METyBMR and METyRMR (α = 0.05), with Bonferroni-corrected post hoc tests. Intensity classifications were also compared after encoding METyBMR and METyRMR as SB (≤1.50 METy), light PA (1.51–2.99 METy), moderate PA (3.00–5.99 METy), or vigorous PA (≥6.00 METy).
RESULTS:
There was a significant interaction (F(30) = 3.6, p < 0.001), and METyBMR was significantly higher than METyRMR for 28 of 31 activities (p < 0.04), by 15.6% (watching television) to 23.1% (basketball). Intensity classifications were the same for both METy calculations in 69.0% of cases.
CONCLUSION:
METyBMR and METyRMR differ considerably. Greater consensus is needed regarding how metabolic equivalents should be operationally defined in youth, and in the meantime careful distinction is necessary between METyBMR and METyRMR.
Keywords: Basal metabolism, Sedentary behavior, Physical activity, Measurement, Normalization
Introduction
In youth, growth and development complicate the relationship between body size and energy expenditure (EE) (1, 2). Consequently, there is not a single, straightforward metric that normalizes youth EE values. Instead, there are a variety of metrics, each having unique advantages and disadvantages (2–4). One of the most commonly used metrics is the youth metabolic equivalent (METy), which is defined as a multiple of resting EE. For example, an individual working at 4.0 METy is expending energy at four times their resting EE. The interpretability of METy is a key advantage compared to other metrics, and METy has demonstrated empirical merit in previous studies (2, 3, 5, 6). However, a limitation of METy is its dependence on how resting EE is operationally defined (2, 7).
Different operational definitions could entail small differences in resting EE, which could in turn cause larger changes in METy. Thus, operational definitions could potentially confound research that relies on METy. The consequences would be far-reaching, given the widespread use of METy as a mainstay for assessments of sedentary behavior (SB) and physical activity (PA). Prominent examples of affected research would include both the calibration and deployment of METy-based assessment methods (e.g. questionnaires and accelerometer models) and any research involving the youth compendium of physical activities (8). Thus, it is necessary to examine operational definitions closely.
In previous youth studies, predicted basal metabolic rate (BMR) and measured resting metabolic rate (RMR) have both been commonly used as operational definitions for resting EE (6), with the typical prediction method being Schofield’s equations (9). Prediction and measurement are inherently distinct, and BMR and RMR are distinct constructs that differ by about 10% (2). Thus, there may be considerable differences between METy defined as multiples of predicted BMR (METyBMR), versus multiples of measured RMR (METyRMR). Alongside those potential differences, it is important to consider the somewhat counterbalanced strengths and weaknesses of each metric. METyBMR can be calculated without performing a resting EE assessment (reducing burden on both researchers and participants), but Schofield’s equations are known to have disparate validity depending on participant demographics (10–12). On the other hand, METyRMR affords much greater standardization across demographic lines, but the measurements are time consuming and susceptible to many sources of error (13).
To date, there has not been a focused comparison of METyBMR and METyRMR. Thus, there is no evidence to suggest how much they differ and what the implications may be of using them interchangeably. That information is essential for researchers and practitioners to have, so they can adequately assess and interpret youth EE values. Therefore, the purpose of this study was to perform a thorough comparison of METyBMR and METyRMR across a range of activity intensities.
Methods
Metabolic data from two previous studies were used for this investigation. Both of the studies were focused on developing new techniques for objective physical activity (PA) monitoring, and full descriptions can be found in the original papers (14–16). Both studies were approved by the appropriate Institutional Review Boards, and parental consent and youth assent were given in writing prior to data collection.
Participants and Protocol
Table 1 shows sample characteristics for both studies, along with a summary of the activities performed. In both studies, participants completed a protocol that spanned 2–3 visits and included an RMR assessment (during 30-min of supine rest) and various structured or semi-structured activities. Throughout the visits, oxygen consumption (VO2) was assessed using a Cosmed K4b2 portable metabolic unit. Below, resting EE data are described separately from the activity data, followed by a description of the analyses for the present study.
Table 1.
Participant and protocol information for the data sets of Crouter et al. (14,15) and LaMunion et al. (16). Numeric values are mean ± SD, except where otherwise noted. Weight status was determined from CDC body mass index percentile cutoffs. Underlined activities were performed in both studies.
| Crouter et al. (n = 159) | LaMunion et al. (n = 86) | |
|---|---|---|
| Males (n, %) | 84 (52.8%) | 41 (47.7%) |
| Age (yrs) | 11.9 ± 1.4 | 12.6 ± 3.4 |
| Height (cm) | 152.1 ± 14.5 | 153.2 ± 17.6 |
| Weight (kg) | 52.2 ± 18.4 | 47.3 ± 18.5 |
| Weight Status (n, %) | ||
| Underweight | 1 (0.6%) | 3 (3.5%) |
| Normal Weight | 86 (54.1%) | 69 (80.2%) |
| Overweight | 32 (20.1%) | 8 (9.3%) |
| Obese | 40 (25.2%) | 6 (7.0%) |
| BMR (ml·kg−1·min−1) | 4.3 ± 0.8 | 4.5 ± 0.9 |
| RMR (ml·kg−1·min−1) | 5.1 ± 1.4 | 5.5 ± 1.4 |
| Activities Performed | ||
| Sedentary Behaviors | Board games, television, reading, computer use, computer gaming | Supine rest, reclining, reading, computer use, computer gaming |
| Household Chores | Vacuuming, sweeping, light cleaning | Sweeping, light cleaning |
| Ambulatory Activities | Walking course, running course, walking with backpack, slow track walk, brisk track walk, track running | Ascending/descending stairs, slow track walk, brisk track walk, track running |
| Active Games/Sports | Dance Dance Revolution, floor light space, wall light space, Jackie Chan exergame, sport wall, wall ball, workout video, Wii exergames, Trazer exergame, soccer | Basketball, soccer |
| Other | Catch | Cycling, jumping jacks, catch |
BMR- Basal metabolic rate, predicted with Schofield’s equations (body mass and height as predictors); RMR- Resting metabolic rate, measured via indirect calorimetry.
Metabolic Data Processing: Resting Data
The R function `PAutilities::get_bmr` (17) was used to calculate BMR predictions (MJ·day−1) from Schofield’s sex- and age-stratified equations (9) with body mass and height as predictors. The values were converted to oxygen consumption (VO2; L·min−1) by first converting to kilocalories (kcal; 239.006 MJ·kcal−1), and then converting to VO2 (4.86 kcal·L−1).
RMR values were obtained by analyzing breath-by-breath VO2 data from the K4b2. Prior to analysis, data were cleaned by discarding invalid values based on the default criteria in the K4b2 software, i.e., if values were outside pre-defined ranges for respiratory frequency (5–80 breaths·min−1), ventilation (0.2–10 L·min−1), expired oxygen fraction (10%−20%), or expired carbon dioxide fraction (1%−10%). Data were also excluded from the first 10 minutes and last minute of the assessment, and the remaining data were used for the analysis. A sliding window was used to calculate average VO2 during all possible continuous five-minute spans, and the lowest value was taken as RMR. The method was similar to the R function `PAutilities::rmr_sliding` (17), except that the average VO2 for each window was calculated using procedures specified by the K4b2 manufacturer (personal communication), instead of simply calculating mean VO2 as the R function does. The manufacturer-specified procedures involved averaging certain fundamental variables (e.g. tidal volume) and then using those averages to calculate derivative variables (e.g. VO2).
Notably, the sliding window approach differed from other methods for calculating RMR, e.g. averaging the last five minutes of data. The decision to use the sliding window was made after observing that VO2 frequently began to increase in the later stages of the assessment, possibly due to equipment-related discomfort. By using the sliding window, it was possible to ensure that the period of lowest metabolic rate was used for each participant. On average, the measurement period began after 16.4 min (SD: 4.7 min), and the values were 11.6% lower than those obtained from averaging the last five min (SD: 10.6%).
Outliers were removed separately for both studies by excluding participants whose RMR differed by more than two standard deviations from the mean for their age group (i.e., ≤ 12 years or > 12 years). The age group cutoff was 12 years because that represented the middle of the pooled age range, i.e., 6–18 years old. No further outlier screening was performed for BMR predictions.
Metabolic Data Processing: Activity Data
In the study of Crouter et al. (14, 15), there were 25 activities, which were divided into four routines. Each participant performed up to seven activities, resulting in 23–51 participants performing each activity. The duration of each activity was eight minutes beginning and ending on an exact minute. VO2 data were averaged over each minute in the Cosmed K4b2 software, and the values from the fourth through seventh minutes were averaged and used as a steady-state value for each participant and activity.
In the study by LaMunion et al. (16), there were 16 activities, which were performed by all participants. The goal of the study was to simulate realistic transitions between activities, and thus the ordering and duration of the activities were irregular. Each activity was performed twice (once for ≤90 s and once for longer) in a pseudo-random order that was jointly determined by the researchers and the participants. For the present study, activity bouts lasting at least three minutes and 40 seconds were included for analysis. Steady state VO2 was calculated from breath-by-breath data in the following manner for each activity: First, 10-s of data were discarded at the end of the activity, and then the preceding 60-s of data were averaged in R using the manufacturer-specified calculations.
There was some overlap in the activities performed for the two studies. Similar activities (e.g. light cleaning versus dusting) were given a common label, and altogether there were 31 unique activities between the studies (see Table 1). BMR and RMR were divided by body mass to obtain values in ml·kg−1·min−1. Steady-state VO2 was also divided by body mass, plus two kg for weight-bearing activities, to account for the additional mass of all devices. METyBMR and METyRMR were then calculated by dividing the steady-state VO2 values by BMR and RMR, respectively. The activity data were cleaned separately for both studies, prior to merging. Specifically, activity values were removed if the METyRMR value differed by more than two standard deviations from the mean for that activity and age group. No further outlier screening was performed for METyBMR values. After cleaning and merging the data from both studies, there were 245 participants included in analysis, and data were available for a total of 2,056 activity bouts.
Statistical Analysis
Summary statistics are presented as mean ± SD. To compare METyBMR and METyRMR for each activity, the analyses followed a two-factor repeated measures design, with the first variable being the activity (of 31 possible activities) and the second variable being the METy calculation (i.e., METyBMR or METyRMR). It was not possible to perform a standard repeated measures ANOVA because no participants performed all 31 activities. Instead, a linear mixed effects model was developed and tested via the `lmerTest` R package (18). The model had three crossed random intercept effects, i.e., individuals crossed with activities and METy calculation. Full maximum likelihood estimation was used, and type three sum of squares with Satterthwaite degrees of freedom were used to evaluate significance. Bonferroni corrections were used for post-hoc tests (α = 0.05), wherein METyBMR and METyRMR were compared for individual activities. A Bland-Altman plot was used to evaluate the presence of systematic differences between METyBMR and METyRMR across the intensity spectrum.
To assess differences in intensity classification based on METyBMR versus METyRMR, both metrics were encoded as SB (≤ 1.50 METy), light PA (1.51 – 2.99 METy), moderate PA (3.00 – 5.99 METy), or vigorous PA (≥ 6.00 METy). The latter cutoffs are commonly used in PA research (19, 20). Classifications were then compared using a confusion matrix, tests of overall agreement (i.e., kappa and percent agreement), and diagnostic tests (i.e., sensitivity, specificity, positive predictive value (PPV) and negative predictive value (NPV)). All tests of classification agreement used METyRMR as an arbitrary reference, which had no effect on the outcomes except to define their labels. That is, using METyBMR as a reference would only lead to value reversals of PPV (reversed with sensitivity) and NPV (reversed with specificity).
Results
There was a significant interaction (F(30) = 3.6, p < 0.001) between activity and METy calculation. Pairwise tests showed significant differences between METyBMR and METyRMR for 28 of 31 activities, by 0.1 METy (15.6%) for watching television to 1.2 METy (19.3%) for track running (all p < 0.04). As shown in Figure 1, the mean for METyBMR was always higher than the mean for METyRMR, by between 13.6% (Dance Dance Revolution, p = 0.08) and 23.1% (basketball, p < 0.0001). Substantial bias was evident in the Bland-Altman plot (Figure 2), wherein values differed by progressively greater amounts as intensity increased.
Figure 1.
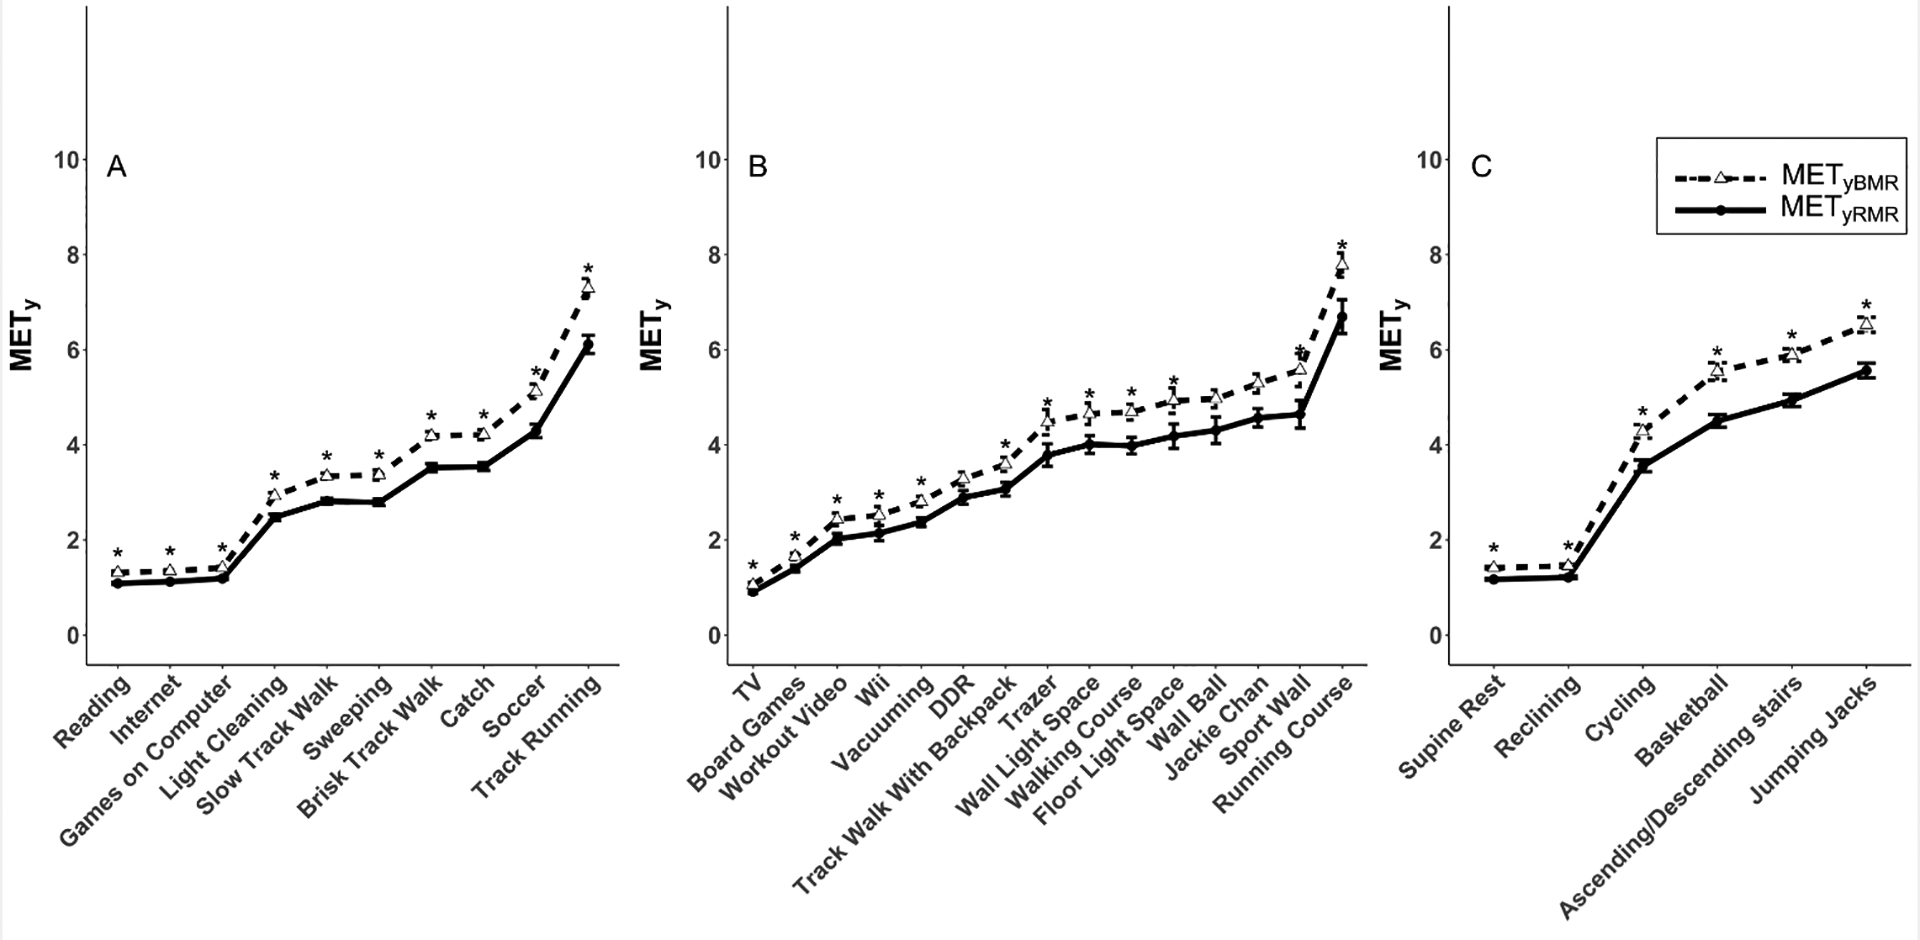
Comparison of youth metabolic equivalents (METy) defined as multiples of predicted basal metabolic rate (METyBMR) or measured resting metabolic rate (METyRMR). Values (mean ± standard error) are shown for individual activities that were performed in (A) both studies, (B) the Crouter study only, or (C) the LaMunion study only. Asterisks indicate significant differences (Bonferroni-corrected p < 0.05) between METyBMR and METyRMR for specific activities.
Figure 2.
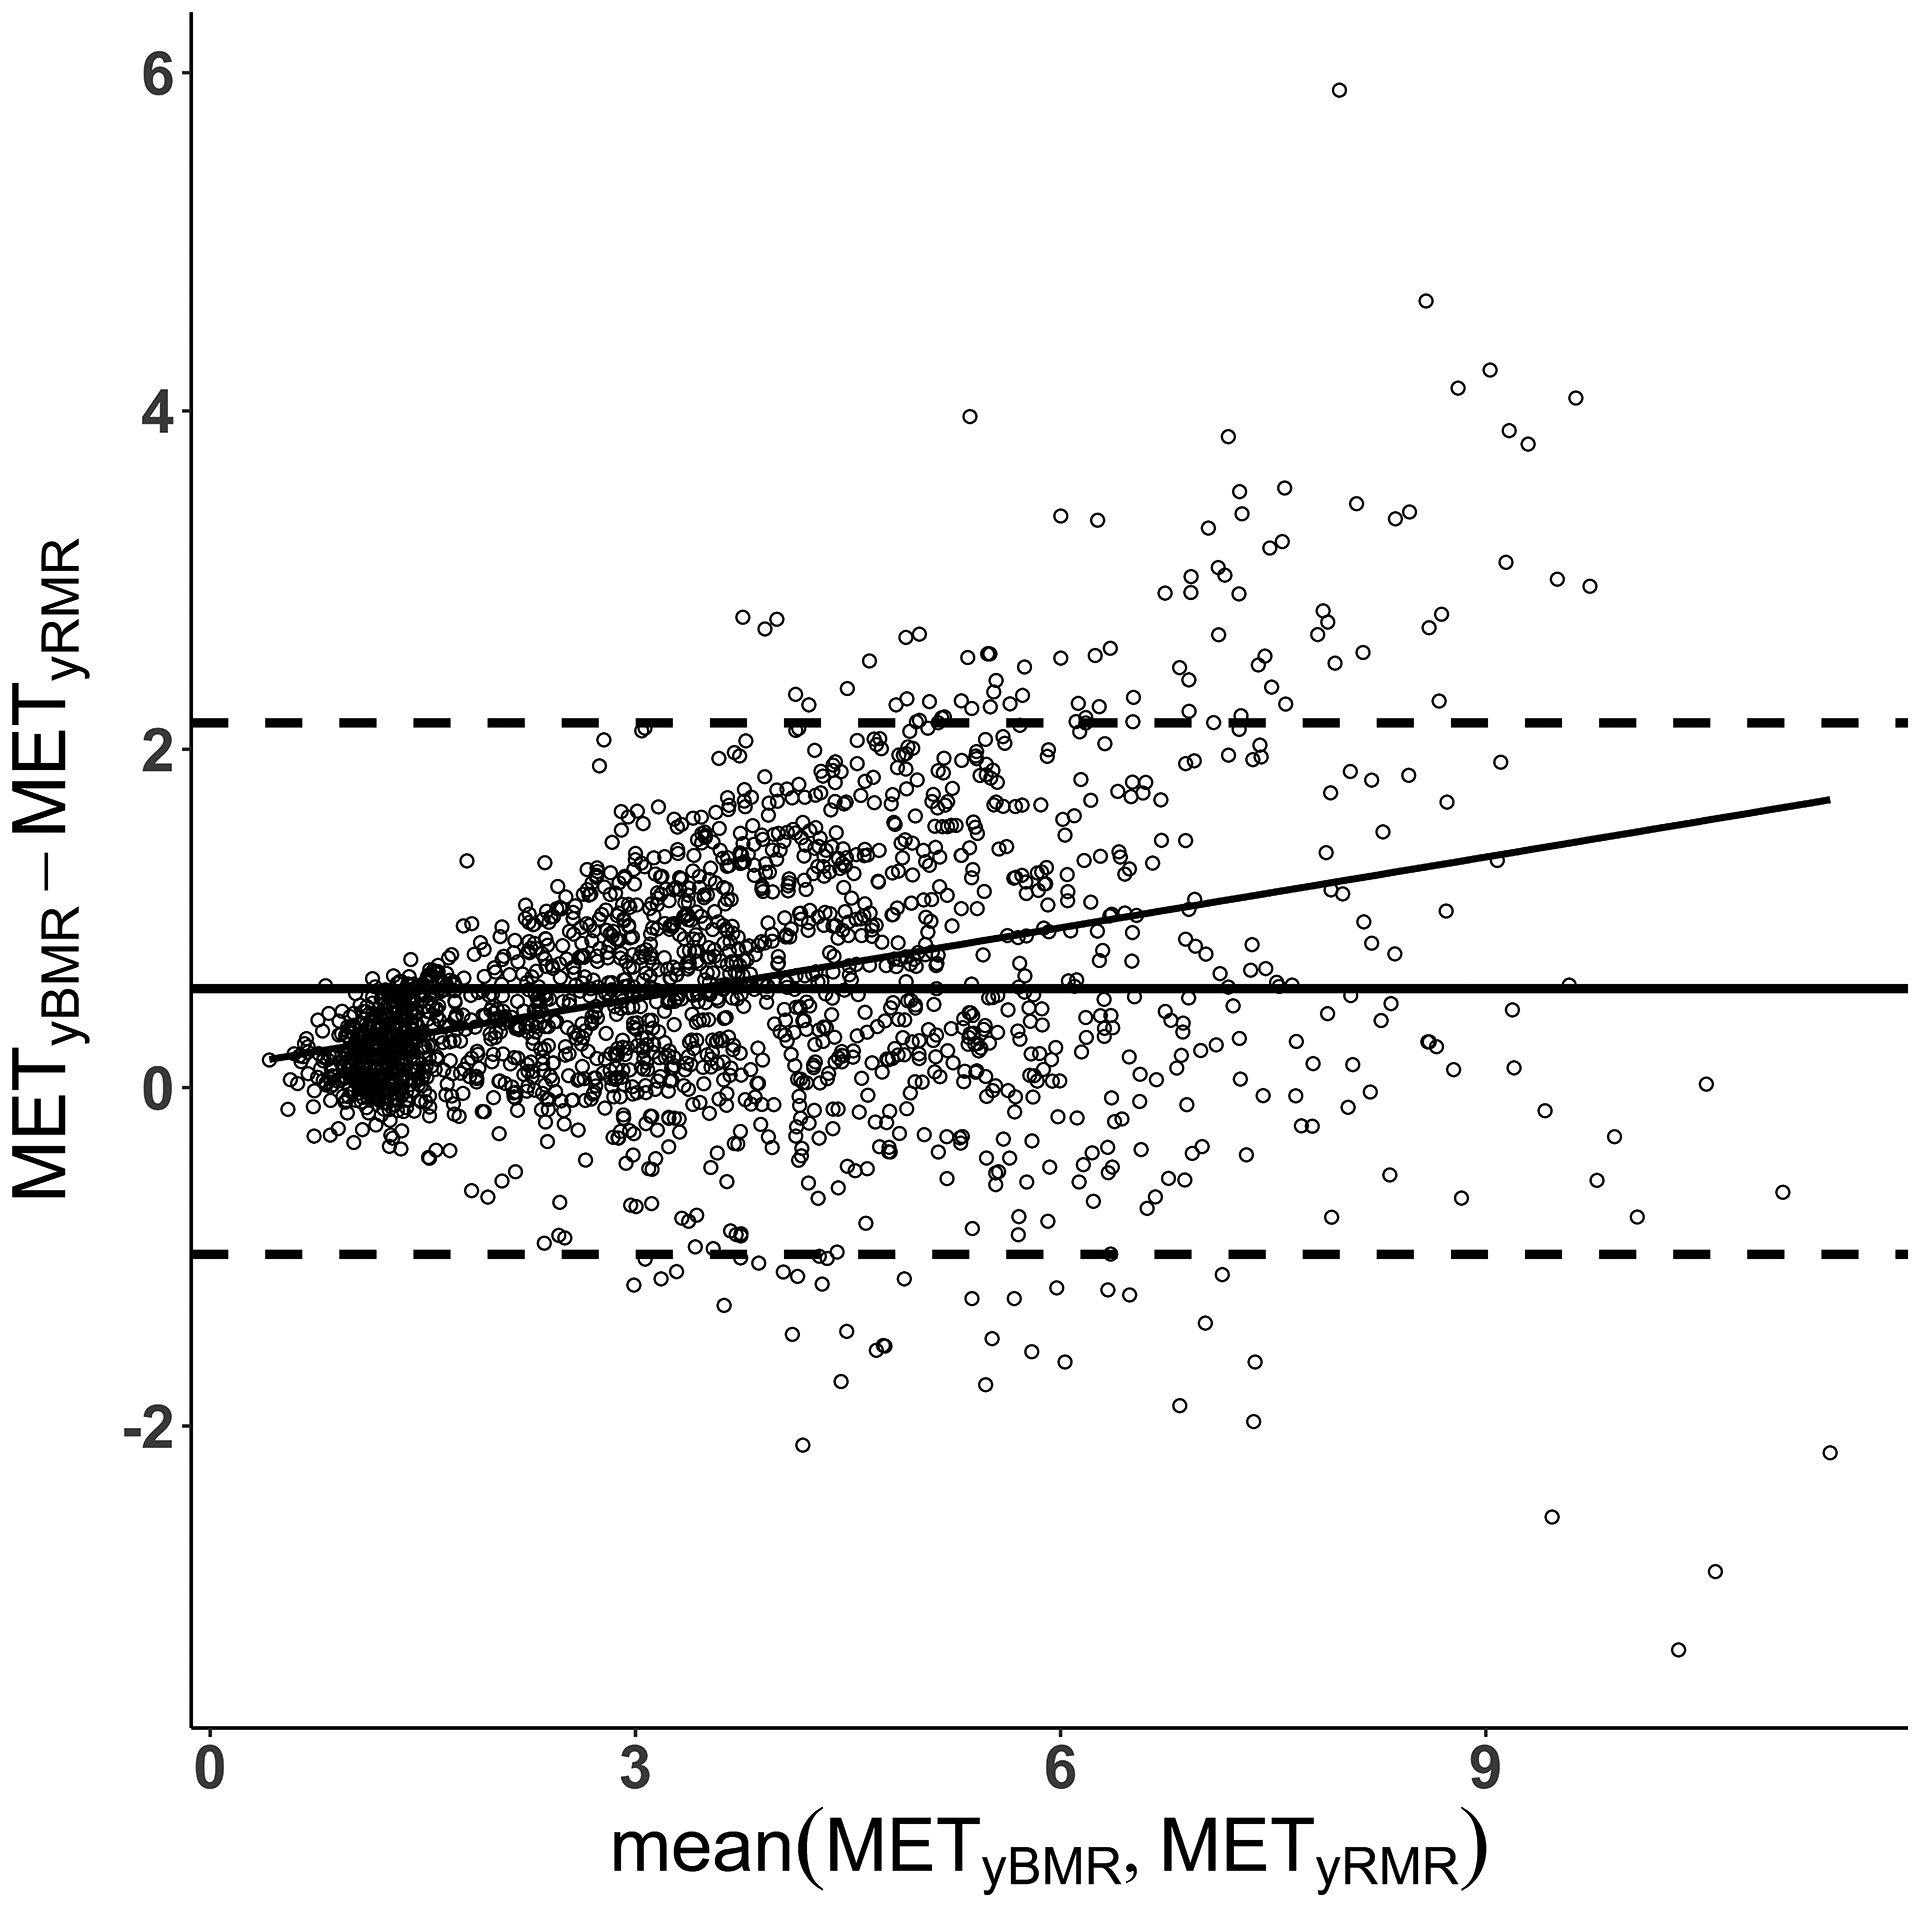
Bland-Altman plots comparing youth metabolic equivalent (METy) values across a range of intensities, where METy are defined as multiples of predicted basal metabolic rate (METyBMR) or measured resting metabolic rate (METyRMR).
For the classification analyses, METyBMR and METyRMR gave the same classification in 69.0% of cases (95% confidence interval: 67.0% - 71.0%), with a kappa of 0.56. Table 2 shows the confusion matrix and diagnostic tests, and Figure 3 shows the classifications overlaid on raw values of METyBMR and METyRMR. For all intensities, specificity and NPV were fairly similar, with values ranging from 77.6% (specificity for moderate PA) to 99.3% (specificity for SB). In contrast, sensitivity and PPV were more disparate, especially for the intensities on either end of the spectrum (SB and vigorous PA). For SB, there were far fewer classifications by METyBMR than METyRMR, resulting in sensitivity and PPV of 69.9% and 97.5%, respectively. The opposite was true for vigorous PA, with far more classifications by METyBMR than METyRMR, resulting in sensitivity and PPV of 88.2% and 47.5%, respectively. For the middle intensities (light and moderate PA), sensitivity and PPV ranged from 50.3% to 77.3%.
Table 2.
Agreement of activity intensity classifications based on youth metabolic equivalents (METy) defined as multiples of predicted basal metabolic rate (METyBMR) versus measured resting metabolic rate (METyRMR). Diagnostic calculations (sensitivity, specificity, positive and negative predictive values) were made using METyRMR as an arbitrary reference.
| METyRMR | ||||||
|---|---|---|---|---|---|---|
| METyBMR | SB | LPA | MPA | VPA | ||
| SB | 384 | 10 | 0 | 0 | 97.5% | 90.1% |
| LPA | 165 | 275 | 24 | 0 | 59.3% | 82.9% |
| MPA | 0 | 262 | 618 | 19 | 68.7% | 84.4% |
| VPA | 0 | 0 | 157 | 142 | 47.5% | 98.9% |
| Sensitivity | 69.9% | 50.3% | 77.3% | 88.2% | ||
| Specificity | 99.3% | 87.5% | 77.6% | 91.7% | ||
SB- sedentary behavior (≤ 1.50 METy); LPA- light physical activity (1.51 – 2.99 METy); MPA- moderate physical activity (3.00 – 5.99 METy); VPA- vigorous physical activity (≥ 6.00 METy).
Figure 3.
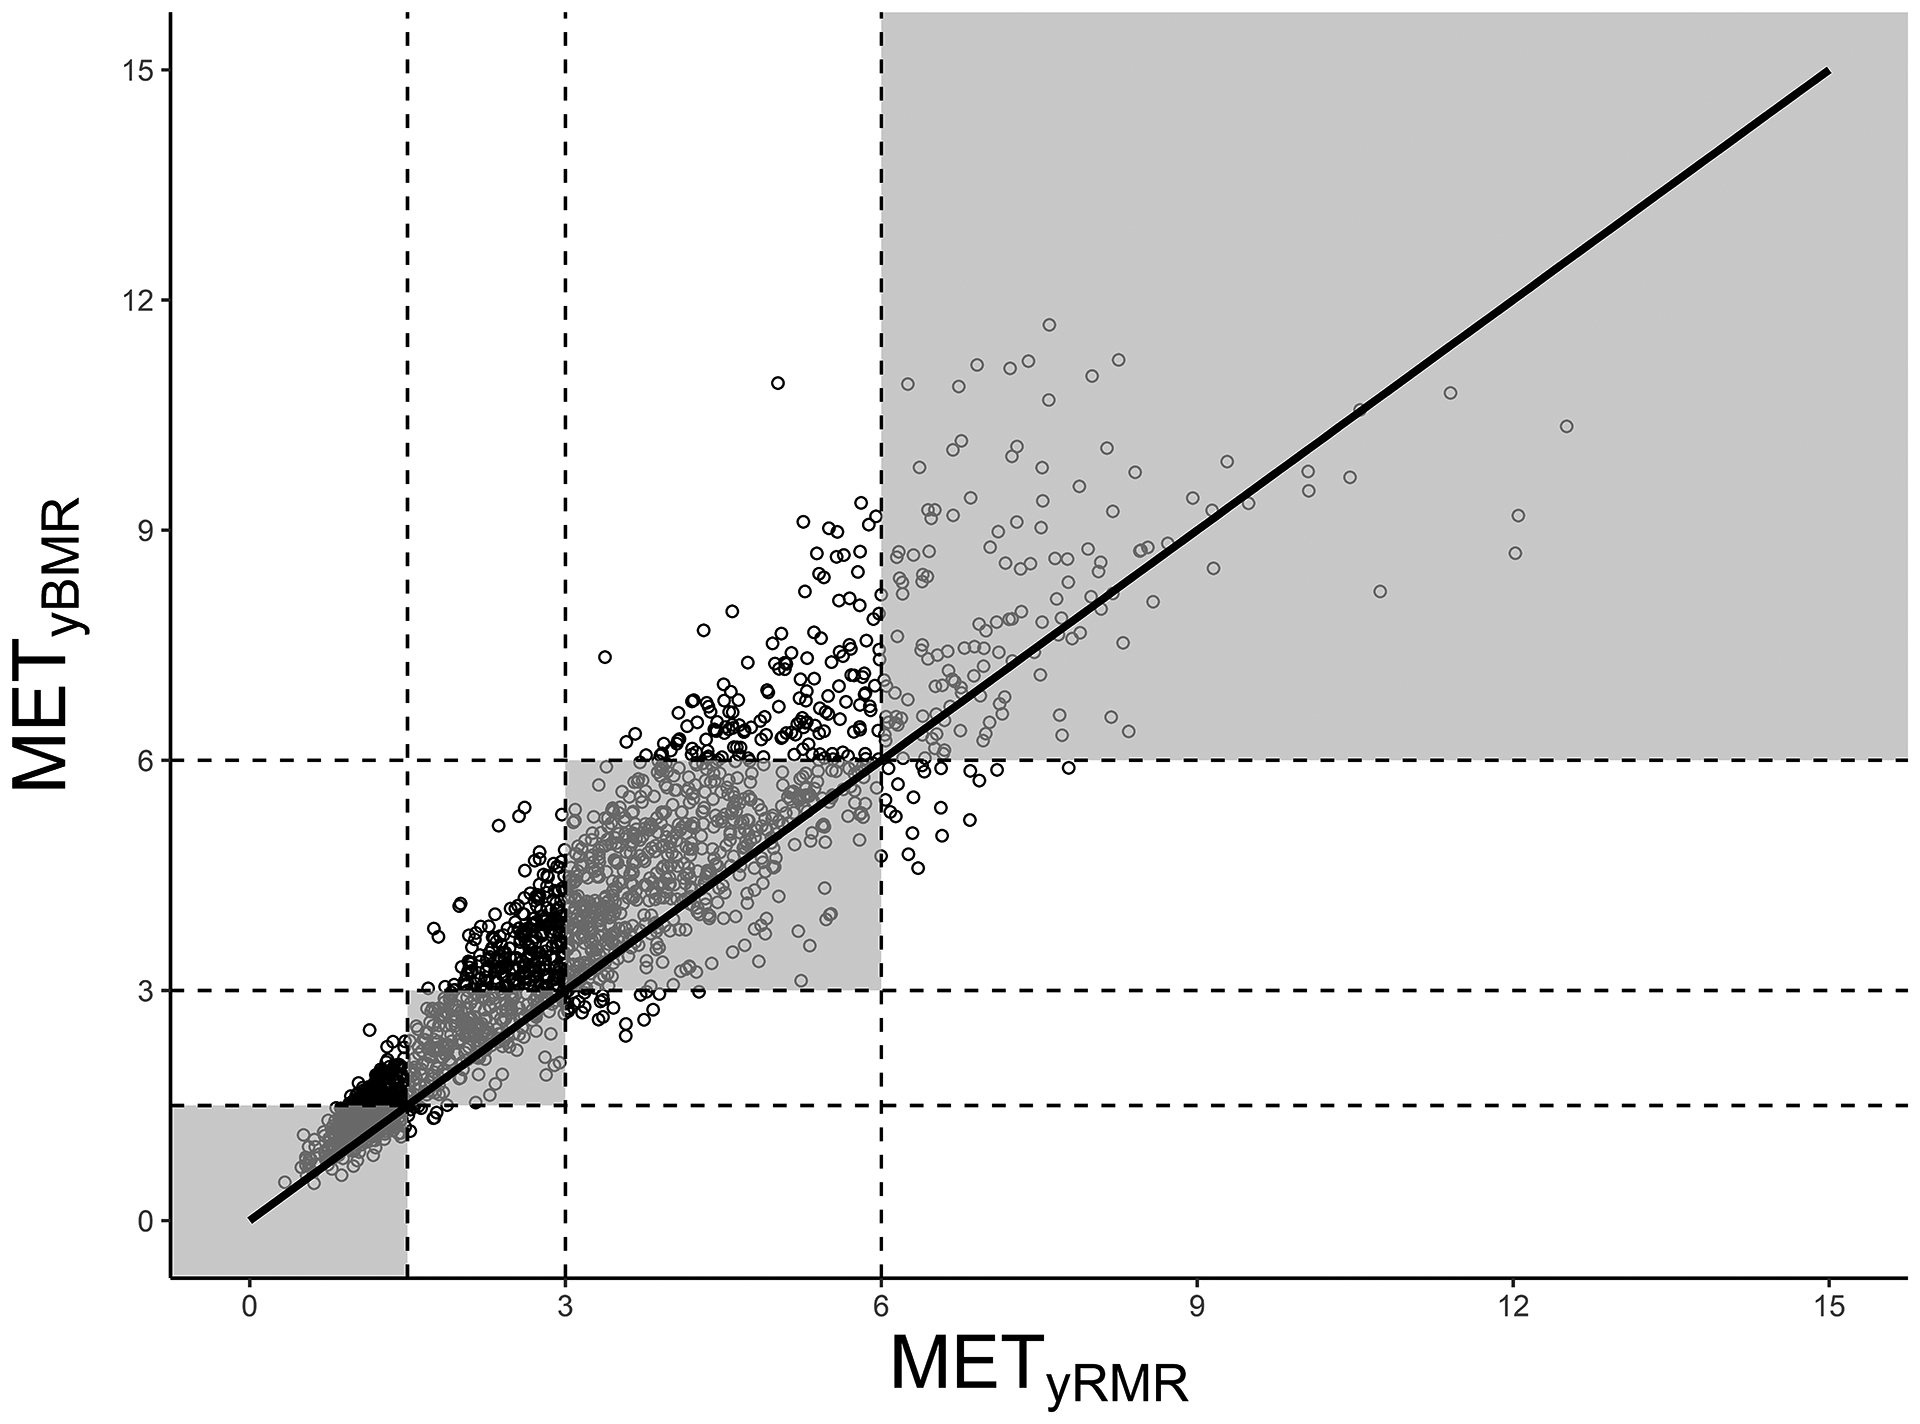
Classification of activity intensity based on youth metabolic equivalents (METy), where METy are defined as multiples of predicted basal metabolic rate (METyBMR) or measured resting metabolic rate (METyRMR). The line of identity is shown in black, and shaded areas are regions where the classifications are the same based on METyBMR and METyRMR, i.e., where both values fall in the same category, of the following four: sedentary behavior (≤ 1.50 METy); light physical activity (1.51 – 2.99 METy); moderate physical activity (3.00 – 5.99 METy); or vigorous physical activity (≥ 6.00 METy).
Discussion
In this study, METyBMR and METyRMR were compared in a large sample of youth performing a wide variety of activities. METyBMR values were consistently higher than those for METyRMR, which led to stark differences in classification of activity intensities as SB and light, moderate, and vigorous PA. The present findings demonstrate the importance of operational definitions as a consideration when assessing youth EE. Furthermore, the findings suggest that greater consensus is needed regarding how METy should be computed.
In light of the differences between METyBMR and METyRMR, the question remains which metric (if either) is preferable for use. To address that issue, it is helpful to understand the strengths and weaknesses of METyBMR and METyRMR, along with the practical implications. The remainder of this discussion will focus on those issues.
Strengths and Weaknesses of METyBMR
The main strengths of METyBMR are standardization and ease of use, since BMR predictions are made the exact same way for all participants in all studies, and can be calculated quickly, i.e., without a lengthy resting measurement (6). METyBMR also allows for back-calculation to VO2 or kcal, as long as demographic and anthropometric information are available for a given participant. The latter possibility is especially useful for dietary studies that may use the youth compendium of physical activities (8) to estimate PA EE.
Despite the conceptual advantages of BMR prediction equations, there are numerous sources of error that are often overlooked. First, the choice of equation can affect METyBMR values. The Schofield equations (9) are commonly used, but it is often unspecified whether body mass was used as the sole predictor, or whether body mass and height were both used. In the document Supplemental Digital Content 1, we compared both sets of equations, and there were negligible differences between them [see Appendix, Supplemental Digital Content 1, Analyses addressing specific questions about predicted basal metabolic rate (BMR) and measured resting metabolic rate (RMR)]. Nevertheless, researchers should make it clear which set of equations was used. More importantly, there are many other equations besides the Schofield equations (10, 12, 21, 22), among which large differences have been observed (10–12). For example, Wong et al. (12) compared 10 prediction equations in 118 female youth. Compared to measured BMR (obtained via room calorimetry), the predicted means for the equations ranged from underestimation by 5% to overestimation by 11%.
Apart from the number of available equations, a compounding issue is that the equations are not equally applicable for all samples. With the Schofield equations, overestimation is common, yet the magnitude of overestimation differs according to various demographic factors (10–12). Müller et al. (11) applied the Schofield equations to a contemporary German sample (N = 2528, age 5–91 years) and discovered systematic error, which they partially attributed to the low numbers of underweight or obese participants in the original Schofield data. In Supplemental Digital Content 1, the same issue was addressed, and the comparability of BMR and RMR was greater among underweight and normal weight individuals than overweight and obese individuals. Henry (10) documented disparities in the effectiveness of the Schofield equations among different races, which is likely attributable to the lack of racial and ethnic diversity in the original Schofield data. The latter issue was also addressed in Supplemental Digital Content 1, wherein it was shown that the agreement between BMR and RMR was substantially worse for those who were not African American or white. Wong et al. (12) provided evidence that age and sex can also impact the validity of the Schofield equations, and in Supplemental Digital Content 1, it was demonstrated that the same issues can impact the comparability of BMR and RMR. Differences across demographic lines indicate that METyBMR could potentially misrepresent the activity levels of different groups, which has concerning implications for the validity of health disparity research and related work. For example, the findings in Supplemental Digital Content 1 showed a greater disparity between predicted BMR and measured RMR for females ≤ 12 years old than males and older females, which could add artifact to METyBMR values and lead to dubious conclusions about how activity levels change with age in females versus males.
Unit conversions represent a third source of error to consider when using METyBMR. The Schofield equations predict megajoules per day, which must be converted to VO2. In Supplemental Digital Content 1, it was shown that the intermediate conversion (MJ to kcal) does not cause meaningful variation in BMR, whereas the final conversion (kcal to VO2) can cause BMR to change by up to 10.7%, which can dramatically change subsequent METyBMR values. Differences exist between the conversion tables of Lusk (23) and Péronnet and Massicotte (24), which are also important to consider. For any given respiratory quotient value, the two tables give conversions that differ by 0.15–0.17 kcal·L−1, which is large enough to change BMR by 2.6% to 3.8%. Conversions are rarely described in studies that use the Schofield equations, but the aforementioned issues suggest that it is essential to do so. Most likely, the conversions are not reported because it is assumed that the conversion should be 5.0 kcal·L−1 of VO2. It is useful to have a conventional conversion, since it improves methodological consistency across studies. However, a value close to the middle of the physiological range (e.g. 4.86 kcal·L−1, corresponding to respiratory quotient of 0.85) may be a more appropriate convention for BMR predictions, since fat metabolism is considerable at rest (25, 26).
Lastly, it should be noted that, by definition, METy are multiples of RMR, not BMR (27). Thus, METyBMR does not truly fit the definition of METy, and even if the present study had shown high comparability between METyBMR and METyRMR, the definitional issue would remain.
Strengths and Weaknesses of METyRMR
The main strength of METyRMR is that the values are individualized through direct measurement of RMR, which eliminates many of the issues that prediction equations create when using METyBMR. Specifically, direct RMR measurements can account for demographic variables that influence RMR, such as sex (1, 2, 28, 29), race (12, 30), age (2, 29), body mass (29), fat-free mass (1, 2, 7, 11, 28), and fat deposition patterns (28). However, direct RMR measurements are time intensive, and they also reduce the possibility of back calculating to kcal or VO2. The latter weaknesses could be considered minor, but there are also many sources of error with direct RMR measurements, and the sheer number of barriers and concerns may be enough to offset the advantages.
A key source of error is instrumentation (e.g. whole body calorimetry versus closed- and open-circuit calorimetry, masks versus mouthpieces and canopies), which has been discussed in several places (10, 12, 13). Other factors include the following from Compher et al. (13): measurement protocol, thermic effect of food, alcohol and caffeine consumption, PA, posture (i.e., sitting versus lying), measurement environment, day-to-day variability, and respiratory quotient. Most of the aforementioned factors have an appreciable effect, typically between 5–10% and sometimes higher.
The present study demonstrated that data processing is an additional source of error. Specifically, RMR was 11.6% ± 10.4% lower using the sliding window approach, compared to the more common approach of averaging the last five minutes. The latter issue is somewhat related to timing, which was also implicated by Compher et al. (13) as a source of error in RMR assessments. A novel implication in the present study was that resting periods longer than approximately 20 min may be too long for youth participants. That is, values were commonly elevated in the later stages of the resting period, possibly due to discomfort associated with wearing the equipment. The sliding window technique provides a way of ensuring that each participant’s lowest values are taken for analysis, regardless of changes in VO2 throughout the protocol. Thus, it may provide a way to limit error that is attributable to data processing. To facilitate usage of the sliding window approach, a version has been made available through the R function `PAutilities::rmr_sliding` (17).
It is difficult to account for all sources of error in RMR assessments, and it seems likely that each assessment will have a different balance of factors that would alter RMR. It is possible that those factors could cancel out, but there is no good way of telling whether that has occurred. Altogether, RMR assessments are subject to measurement error that is roughly comparable to the prediction error associated with BMR predictions (12). However, the key distinctions of RMR assessments are: 1) that error is unaffected by participant demographics; and 2) that the values are consistent with the true definition of METy.
Practical Implications
Despite the limitations of METy, its widespread use will likely continue because it is easy to calculate and interpret, and also because it is favorable for normalizing EE in a variety of scenarios (2, 3, 5, 6). For example, McMurray et al. (3) compared a range of EE metrics (not including METyRMR) across a variety of intensities in a large pooled sample of youth. Their findings showed that METyBMR was one of the most effective EE metrics for normalizing across sex, age, height, and body mass. Thus, they recommended METyBMR for use in the youth compendium of physical activities, and their recommendation was ultimately fulfilled (8). Although the limitations of METyBMR apply to the youth compendium, it should be noted that the compendium was assembled from many studies that did not all involve RMR assessments. Furthermore, when RMR was assessed, the methods were not standardized across studies (3). Thus, there were clear grounds for using METyBMR instead of METyRMR.
The youth compendium is a notable application for which the present study has implications. Users should understand that the METyBMR values in the compendium are likely higher than would be observed for METyRMR, which could influence the appropriateness of the compendium for certain tasks (e.g. data imputation in a study that otherwise assesses METyRMR). Thus, it is important to take a nuanced approach to using the compendium, possibly including adjustments to improve the comparability of METyBMR and METyRMR. For example, it may be possible make intensity classifications more convergent by using higher cutoffs for METyBMR than METyRMR, just as some have advocated increasing the cutoffs when using adult metabolic equivalents (i.e., multiples of 3.5 ml·kg−1·min−1) in youth (reference 31; see also section 10 of the measures registry user guide for individual physical activity, available from nccor.org/tools-mruserguides/individual-physical-activity/supplemental-considerations-for-scaling-and-scoring-mets-in-youth).
In a supplemental analysis, we re-classified METyBMR intensity using modified cutoffs, which were determined using the scaling approach of Saint-Maurice et al. (31), i.e., by multiplying the conventional cutoffs (1.5, 3.0, and 6.0 METy for light, moderate, and vigorous PA, respectively) by 1.33. The resulting classifications were SB (≤ 2.0 METyBMR), light PA (2.1–3.9 METyBMR), moderate PA (4.0–7.9 METyBMR) or vigorous PA (≥ 8.0 METyBMR), and classification agreement between METyBMR and METyRMR increased from the original 69.0% (κ = 0.56) to 80.3% (κ = 0.72). Full results are shown in the document Supplemental Digital Content 2 (see Appendix, Supplemental Digital Content 2, alternative intensity cutoffs for METyBMR). Altogether, it seems recommendable to use modified METyBMR cutoffs whenever there is a need to make joint intensity classifications using both METyBMR and METyRMR.
Modified intensity cutoffs are not the only way of potentially improving the comparability of METyBMR and METyRMR. Another approach would be to explore whether an alternate prediction equation (i.e., other than Schofield) could help by bringing BMR estimates closer to measured RMR values. Along the same line, a correction factor could potentially be developed for BMR predictions to boost them into a more realistic range for RMR. The latter approach would be conceptually similar to using modified intensity cutoffs, but the scale would be continuous and thus more flexible in some respects. When considering alternative prediction equations and correction factors, it is important to weigh the benefits against the risk of exchanging one set of problems for another. Unless a new approach demonstrates clear advantages over the Schofield equations (both in terms of convergence with measured RMR, and in terms of consistent validity in demographic subgroups), it would be preferable to continue using the Schofield equations, to minimize confusion and promote consistent interpretation across studies.
The issues discussed thus far should also be considered in the context of accelerometer-based activity monitoring, since it represents a major application for METy. There are different implications depending on the type of accelerometer model in question. For regression models (i.e., those that predict METy as a continuous outcome), the implications are straightforward. As long as it is clear whether the model is predicting METyBMR or METyRMR, users retain the ability to perform further analysis with as much nuance as necessary, particularly when classifying METy into intensity categories. For classification models (i.e., those that predict categorical intensity without giving a METy value), users do not have the same level of control, and thus a great deal of caution is necessary when determining which model to use and how to interpret the results. That is, depending on how intensity was defined in the model calibration (i.e., how METy was calculated and which cutoffs were used), the results may need to be interpreted very differently. Given the difficulties of interpreting output from classification models, it seems recommendable to use regression models whenever possible, and to include a high level of detail when describing subsequent analyses (particularly conversion from METy to categorical intensity).
Lastly, it is important to consider how the strengths and weaknesses of METy compare with those of alternative EE metrics. Absolute EE metrics (e.g. kcal·min−1) are simple to obtain and interpret, but are influenced by physical characteristics, particularly body size. Most other EE metrics are intended to produce normalized values among individuals of different body size (4). Ratio metrics (e.g. dividing EE by body mass or fat-free mass) are the simplest, but tend to over-correct (32, 33). Allometric scaling (i.e., division by body mass raised to a fractional power) is another useful approach (3), but the appropriate allometric exponent varies depending on what activity a person is engaged in (4), which is often unknown in free-living protocols. Furthermore, it is challenging to interpret and inter-convert EE values that have been allometrically scaled (3). The above metrics do not depend on resting EE (3), which is a clear operational strength compared to METy. However, it is clear that there is no ideal EE metric. Future work should aim to build greater consensus regarding best practices for assessing youth EE, whether using METy or another metric.
Strengths and Limitations of the Present Study
The strengths of the present study include its large sample size and the range of activities included, through the use of data from two studies. There are also limitations in this study, one being the limited duration of some activities in the LaMunion et al. (16) data set, which may have led to the inclusion of some pre-steady-state data. The ordering of activities is also a potential limitation of those data. That is, since activities were not performed in order of ascending intensity, intense activities may have caused EE elevations that carried over into a subsequent activity. Despite those limitations, it is important to note that METyBMR and METyRMR values were calculated on the same VO2 data, whether it was fully steady-state or not. Furthermore, the limitations would likely only apply to a small number of cases. Thus, the limitations of the LaMunion et al. (16) data are unlikely to have large impact on the present study’s findings.
Conclusions
The present study demonstrated that METy values are affected by which operational definition is used for resting EE. Until consensus definitions are established, future studies should distinguish carefully between METyBMR and METyRMR, and should also be thorough in reporting how the values are obtained, including details about which equations are used, and how unit conversions are performed. Youth may appear more active when using METyBMR than METyRMR, which can be avoided by using metric-specific cutoffs for SB (≤2.00 METyBMR versus ≤1.50 METyRMR), light PA (2.01–3.99 METyBMR versus 1.51–2.99 METyRMR), moderate PA (4.00–7.99 METyBMR versus 3.00–5.99 METyRMR), and vigorous PA (≥ 8.00 METyBMR versus ≥ 6.00 METyRMR). In general, METyRMR is preferable to METyBMR, for consistency across demographic lines, and for consistency with the definition of METy. Alternatively, there may be warrant for increasing the use of other metrics (e.g. kcal·kg−1·min−1) that do not rely on resting EE assessments.
Supplementary Material
Supplemental Digital Content 1.docx—Analyses addressing specific questions about predicted basal metabolic rate (BMR) and measured resting metabolic rate (RMR)
Supplemental Digital Content 2.docx—Alternative Intensity Cutoffs for METyBMR
Acknowledgements
Studies were supported by NIH grants R21HL093407 and R01HD083431.
Footnotes
Conflict of Interest: The authors declare no conflicts of interest. The results of this study are presented clearly, honestly, and without fabrication, falsification, or inappropriate data manipulation. This study does not constitute endorsement by ACSM.
References
- 1.Griffiths M, Payne PR, Rivers JPW, Cox M, Stunkard AJ. Metabolic rate and physical development in children at risk of obesity. Lancet. 1990;336(8707):76–8. [DOI] [PubMed] [Google Scholar]
- 2.Herrmann SD, McMurray RG, Kim Y, Willis EA, Kang M, McCurdy T. The influence of physical characteristics on the resting energy expenditure of youth: A meta-analysis Am J Hum Biol [internet]. 2017. [cited 2019 November 27];29(3). Available from: https://onlinelibrary.wiley.com/doi/abs/10.1002/ajhb.22944. doi: 10.1002/ajhb.22944. [DOI] [PubMed] [Google Scholar]
- 3.McMurray RG, Butte NF, Crouter SE, et al. Exploring metrics to express energy expenditure of physical activity in youth. PLoS One [internet]. 2015. [cited 2019 November 27];10(6). Available from: https://journals.plos.org/plosone/article?id=10.1371/journal.pone.0130869. doi: 10.1371/journal.pone.0130869. [DOI] [PMC free article] [PubMed] [Google Scholar]
- 4.Zakeri I, Puyau MR, Adolph AL, Vohra FA, Butte NF. Normalization of energy expenditure data for differences in body mass or composition in children and adolescents. J Nutr. 2006;136(5):1371–1376. [DOI] [PubMed] [Google Scholar]
- 5.Harrell JS, Mcmurray RG, Baggett CD, Pennell ML, Pearce PF, Bangdiwala SI. Energy costs of physical activities in children and adolescents. Med Sci Sports Exerc. 2005;37(2):329–36. [DOI] [PubMed] [Google Scholar]
- 6.Ridley K, Olds TS. Assigning energy costs to activities in children: A review and synthesis. Med Sci Sports Exerc. 2008;40(8):1439–46. [DOI] [PubMed] [Google Scholar]
- 7.Byrne NM, Hills AP, Hunter GR, Weinsier RL, Schutz Y. Metabolic equivalent: One size does not fit all. J Appl Physiol. 2005;99(3):1112–9. [DOI] [PubMed] [Google Scholar]
- 8.Butte NF, Watson KB, Ridley K, et al. A youth compendium of physical activities: Activity codes and metabolic intensities. Med Sci Sports Exerc. 2018;50(2):246–56. [DOI] [PMC free article] [PubMed] [Google Scholar]
- 9.Schofield WN. Predicting basal metabolic rate: New standards and review of previous work. Hum Nutr Clin Nutr. 1984;39:5–41. [PubMed] [Google Scholar]
- 10.Henry CJK. Basal metabolic rate studies in humans: Measurement and development of new equations. Public Health Nutr. 2005;8(7A):1133–52. [DOI] [PubMed] [Google Scholar]
- 11.Müller MJ, Bosy-Westphal A, Klaus S, et al. World Health Organization equations have shortcomings for predicting resting energy expenditure in persons from a modern, affluent population: Generation of a new reference standard from a retrospective analysis of a German database of resting energy expenditure. Am J Clin Nutr. 2004;80(5):1379–90. [DOI] [PubMed] [Google Scholar]
- 12.Wong WW, Butte NF, Hergenroeder AC, Hill RB, Stuff JE, Smith EO. Are basal metabolic rate prediction equations appropriate for female children and adolescents? J Appl Physiol. 1996;81(6):2407–14. [DOI] [PubMed] [Google Scholar]
- 13.Compher C, Frankenfield D, Keim N, Roth-Yousey L. Best practice methods to apply to measurement of resting metabolic rate in adults: A systematic review. J Am Diet Assoc. 2006;106(6):881–903. [DOI] [PubMed] [Google Scholar]
- 14.Crouter SE, Horton M, Bassett DR. Use of a two-regression model for estimating energy expenditure in children. Med Sci Sports Exerc. 2012;44(6):1177–85. [DOI] [PMC free article] [PubMed] [Google Scholar]
- 15.Crouter SE, Horton M, Bassett DR. Validity of ActiGraph child-specific equations during various physical activities. Med Sci Sports Exerc. 2013;45(7):1403–9. [DOI] [PMC free article] [PubMed] [Google Scholar]
- 16.LaMunion SR, Blythe AL, Hibbing PR, Kaplan AS, Clendenin BJ, Crouter SE. Use of consumer monitors for estimating energy expenditure in youth. Appl Physiol Nutr Metab [advance online publication]. 2019. [cited 2019 November 27]; Available from: https://www.nrcresearchpress.com/doi/abs/10.1139/apnm-2019-0129#.Xd9IiehKjIU. doi: 10.1139/apnm-2019-0129. [DOI] [PMC free article] [PubMed] [Google Scholar]
- 17.Hibbing PR. PAutilities: Streamline Physical Activity Research. 2019. [cited 2019 November 27] Available from: https://CRAN.R-project.org/package=PAutilities.
- 18.Kuznetsova A, Brockhoff PB, Christensen RHB. lmerTest: Tests in Linear Mixed Effects Models. 2017. [cited 2019 November 27]. Available from: https://cran.r-project.org/package=lmerTest.
- 19.Pate RR, O’Neill JR, Lobelo F. The evolving definition of “sedentary”. Exerc Sport Sci Rev. 2008;36(4):173–178. [DOI] [PubMed] [Google Scholar]
- 20.Pate RR, Pratt M, Blair SN, et al. Physical activity and public health: A recommendation from the Centers for Disease Control and Prevention and the American College of Sports Medicine. JAMA. 1995;273(5):402–407. [DOI] [PubMed] [Google Scholar]
- 21.Harris JA, Benedict FG. A biometric study of basal metabolism in man. Washington DC: Carnegie Institution of Washington; 1919. 266 p. [Google Scholar]
- 22.Nieman DC, Austin MD, Chilcote SM, Benezra L. Validation of a new handheld device for measuring resting metabolic rate and oxygen consumption in children. Int J Sport Nutr Exerc Metabolism. 2005;15(2):186–94. [DOI] [PubMed] [Google Scholar]
- 23.Lusk G. Animal calorimetry, twenty-fourth paper: Analysis of the oxidation of mixtures of carbohydrate and fat. J Biol Chem. 1924;59(1):41–2. [Google Scholar]
- 24.Péronnet F, Massicotte D. Table of nonprotein respiratory quotient: An update. Can J Sport Sci. 1991;16(1):23–9. [PubMed] [Google Scholar]
- 25.Ravussin E, Burnand B, Schutz Y, Jéquier E. Twenty-four-hour energy expenditure and resting metabolic rate in obese, moderately obese, and control subjects. Am J Clin Nutr. 1982;35(3):566–73. [DOI] [PubMed] [Google Scholar]
- 26.Seidell JC, Muller DC, Sorkin JD, Andres R. Fasting respiratory exchange ratio and resting metabolic rate as predictors of weight gain: The Baltimore Longitudinal Study on Aging. Int J Obes Relat Metab Disord. 1992;16(9):667–74. [PubMed] [Google Scholar]
- 27.Howley ET. You asked for it: Question authority. ACSM Health Fitness J. 2000;4(1):6, 40. [Google Scholar]
- 28.Dionne I, Després J, Bouchard C, Tremblay A. Gender difference in the effect of body composition on energy metabolism. Int J Obes. 1999;23(3):312–9. [DOI] [PubMed] [Google Scholar]
- 29.McMurray RG, Soares J, Caspersen CJ, McCurdy T. Examining variations of resting metabolic rate of adults: A public health perspective. Med Sci Sports Exerc. 2014;46(7):1352–8. [DOI] [PMC free article] [PubMed] [Google Scholar]
- 30.Gannon B, DiPietro L, Poehlman ET. Do African Americans have lower energy expenditure than Caucasians? Int J Obes. 2000;24(1):4–13. [DOI] [PubMed] [Google Scholar]
- 31.Saint-Maurice PF, Kim Y, Welk GJ, Gaesser GA. Kids are not little adults: What MET threshold captures sedentary behavior in children? Eur J Appl Physiol. 2016;116(1):29–38. [DOI] [PubMed] [Google Scholar]
- 32.Katch VL. Use of the oxygen/body weight ratio in correlational analyses: Spurious correlations and statistical considerations. Med Sci Sports. 1973;5(4):253–7. [PubMed] [Google Scholar]
- 33.Tanner J. Fallacy of per-weight and per-surface area standards, and their relation to spurious correlation. J Appl Physiol. 1949;2(1):15. [DOI] [PubMed] [Google Scholar]
Associated Data
This section collects any data citations, data availability statements, or supplementary materials included in this article.
Supplementary Materials
Supplemental Digital Content 1.docx—Analyses addressing specific questions about predicted basal metabolic rate (BMR) and measured resting metabolic rate (RMR)
Supplemental Digital Content 2.docx—Alternative Intensity Cutoffs for METyBMR