

Abstract
Negative symptoms such as anhedonia are associated with psychosis risk and poorer outcomes. The Prodromal Questionnaire (PQ) is a self-report questionnaire used to screen for psychosis spectrum symptoms. However; the convergent and divergent validity and underlying factor structure of the PQ-negative symptom subscale (PQ-N) have yet to be examined. Undergraduates (N=1,556) completed the PQ, Temporal Experience of Pleasure Scale, and measures assessing anxiety, depression, and motivation. An exploratory factor analysis conducted on the PQ-N yielded a two-factor solution, reflecting sub-dimensions of social expression and dissociative-depressive experiences, contrary to previous research examining the factor structure of negative symptoms. Associations between the PQ-N, its two factors, and measures of negative symptoms and other psychopathology were examined. Results indicated that the PQ-N and its factors were more strongly correlated with measures of depression and anxiety than with measures of negative symptoms relating to motivation and pleasure, suggesting poor convergent and divergent validity.
Keywords: negative symptoms, Prodromal Questionnaire, convergent validity, divergent validity, exploratory factor analysis
Introduction
Negative symptoms, such as anhedonia and avolition, are associated with psychosis risk and poorer functional outcomes among patients with psychotic disorders, such as schizophrenia (Kurtz, 2005; Milev, Ho, Arndt, & Andreasen, 2005; Sarkar, Hillner, & Velligan, 2015). As such, the development of measures that accurately assess negative symptoms has become imperative for conducting research in this domain. Negative symptoms generally are agreed to consist of five subdomains: blunted affect (a decrease in emotional expression), alogia (poverty of speech), anhedonia (decreased ability to feel pleasure), asociality (decrease in motivation to participate in social activities), and avolition (decrease in motivation for self-directed activity) (Kirkpatrick, Fenton, Carpenter, & Marder, 2006). Negative symptoms typically emerge prior to the onset of positive symptoms in the course of psychotic disorders (Häfner et al., 2005; Lencz, Smith, Auther, Correll, & Cornblatt, 2004; Lyne et al., 2015; Velthorst et al., 2010) and research has suggested that negative symptoms impact functional outcomes and quality of life to a greater degree than positive symptoms (e.g. hallucinations and delusions) (Mohamed et al., 2008; Rabinowitz et al., 2012; Milev et al., 2005; Narvaez, Twamley, Mckibbin, Heaton, & Patterson, 2008; Wegener et al., 2005). Additionally, individuals with a shorter duration of untreated negative symptoms tend to perform better on cognitive tasks than their counterparts with longer durations of untreated negative symptoms (Cuesta et al., 2012). These findings suggest that accurate, early identification and treatment of negative symptoms may not only assist in early identification of those at risk for developing psychosis, it also may improve their overall functional outcomes in the short term as well as the long term. Given the importance of negative symptoms in the course of psychotic disorders, a needed area of research is developing valid and reliable questionnaires that can aid in quickly identifying these dimensions across the psychosis spectrum.
Due to the breadth of research indicating that negative symptoms are an important prognostic factor of functioning for those at risk for psychosis, a variety of semi-structured interviews and self-report measures have been created to measure negative symptoms (e.g., Cooper, Lavayasse, & Gard, 2015; Deci & Ryan, 1985; Kay, Fiszbein, & Opler, 1987; Gard et al., 2006; Kring, Gur, Blanchard, Horan, & Reise, 2013). Although there have been some recent developments and improvements in the measurement of negative symptoms, many factors have impeded the development of accurate scales. First, the conceptualization of negative symptoms has changed over time (Kirkpatrick et al., 2006), which has led to changes in the way that negative symptom scales are designed. Although many newer measures are cognizant of and account for the changing definition of negative symptoms, many commonly used scales were created prior to the Kirkpatrick et al. (2006) consensus statement, wherein experts convened under the endorsement of the National Institute of Mental Health (NIMH) to, among other topics, review data and make a determination as to which domains of negative symptoms were empirically supported. Thus, older negative symptom scales potentially include remnants of items that are no longer widely classified as negative symptoms, such as social cognition (Blanchard, Kring, Horan, & Gur, 2011; Foussias & Remington, 2010; Kirkpatrick et al., 2006). Second, many negative symptom scales only measure one of the five subdomains of negative symptoms. This is problematic, because if negative symptom domains respond variably to treatment, domain-specific treatment responses may be obscured (Kirkpatrick et al., 2006). Furthermore, many negative symptom scales lack dimensions that tap into the behavioral aspects of negative symptoms (e.g., the Temporal Experience of Pleasure Scale (TEPS) assesses different facets of pleasure by asking participants to rate either how much they enjoy activities in the present moment or how much they look forward to them, but does not ask how often the participant either anticipates or engages in said behaviors [Gard, Gard, Kring, & John, 2006]), or fail to assess symptoms that are typically based on rater observation (e.g., alogia).
Similarly, some negative symptom measures are not structured in a way that adequately distinguishes between negative symptoms unique to psychosis and similar symptoms associated with related psychopathologies. There is a good deal of overlap between depressive symptoms and negative symptoms, although they are generally accepted to be separate constructs (Häfner et al., 1999; Herbener, Harrow, & Baker, 2002; Selten, Gernaat, Nolen, Wiersma, & Van Den Bosch, 1998). For example, both individuals with depressive symptoms and those with negative symptoms commonly experience anhedonia and social withdrawal and, as such, negative symptoms are often mistaken as transient symptoms of depression (Horan, Kring, & Blanchard, 2006). Many measures are not designed in a way that is conducive to examining whether experiences are primary or secondary to depression or to negative symptoms. In addition, many negative symptom measures do not ask participants about medication status (e.g., motivation and pleasure scale, self-report (MAP-SR) Llerena et al., 2013) and, as such, one cannot fully assess whether symptoms are secondary to medication effects. Thus, it is crucial to carefully examine the validity of measures intended to measure negative symptoms to determine whether negative symptoms are being accurately evaluated.
Although negative symptoms consist of five subdomains and consistently load onto factors that are separable from anxiety, depression, and other psychosis spectrum symptoms, such as positive symptoms (Blanchard, & Cohen, 2006; Liddle, 1987; Thompson & Meltzer, 1993), it is widely recognized that negative symptoms are multidimensional. That is, they are comprised of multiple, related yet distinct components. Due to the multidimensionality of negative symptoms, previous studies have examined their underlying factor structure and found that multi-factor solutions may be appropriate (Blanchard, & Cohen, 2006). The factor solution that has garnered the most support is a two-factor model that consists of a diminished or poor emotional expression factor and an avolition-apathy factor (Ergül & Üçok, 2015; Galderisi et al., 2013; Kimhy, Yale, Goetz, McFarr, & Malaspina, 2006; Nakaya, & Ohmori, 2008; Peralta & Manuel, 1995; Strauss et al., 2013). Although the majority of these factor analytic studies have been conducted on patient samples, recent evidence has also supported this 2-factor model in clinical high risk populations (Azis et al., 2018), although more evidence demonstrating the factor structure of negative symptoms in non-patient populations is necessary. Many studies supporting the two-factor model have utilized common measures of negative symptoms such as the scale for assessment of negative symptoms (SANS; Andreasen, 1982), schedule for the deficit syndromes (SDS; Kirkpatrick et al., 1989), and the brief psychiatric rating scale (BPRS; Overall & Gorham, 1962). However, methodologically some studies have opted to conduct factor analyses of items (e.g. Kimhy et al., 2006; Peralta & Manuel, 1995), whereas others have opted to conduct factor analyses of scales (e.g. Ergül & Üçok, 2015; Strauss et al., 2013); the latter of which assumes that the items within each scale or sub-scale homogenously reflects a single construct.
Despite the clear importance of accurate screening for negative symptoms early in the course of psychosis, only a few self-report questionnaires have been shown to be psychometrically sound in multiple validation studies. For example, to date some self-report measures have displayed good internal validity and reliability in multiple samples, such as the TEPS (Chan et al., 2012; Gard et al., 2006; Garfield, Cotton, & Lubman, 2016; Loas et al., 2009; Simon et al., 2018; Geaney, Treadway, & Smillie, 2015). However, other measures display good internal consistency but some measures had questionable discriminant validity, such as the positive and negative symptoms questionnaire (PNS-Q; Kilian et al., 2015; Iancu, Poreh, Lehman, Shamir, & Kotler, 2005). In other instances, measures have good internal consistency when administered as semi-structured interviews, such as the clinical assessment interview for negative symptoms (CAINS) and weaker internal consistency when administered as self-report versions (e.g. the CAINS-Self Report) (Kilian et al., 2015; Kring et al., 2013; Park et al., 2012). More recently developed measures, such as the General Causality Orientation Scale for Clinical Populations (GCOS-CP), have displayed excellent convergent and divergent validity (Cooper, Lavaysse, & Gard, 2015), but have not yet had their reliability and validity assessed by independent researchers.
Some broader measures of psychosis, such as the Prodromal Questionnaire (PQ), have not had the validity and reliability of their negative symptom subscales assessed (Loewy, Bearden, Johnson, Raine, & Cannon, 2005; Loewy, Johnson, & Cannon, 2007). The PQ, a commonly used measure in both research and clinical settings (Loewy et al., 2005), is a 92-item self-report screener that measures psychotic-spectrum symptoms and is utilized to predict the future onset of psychosis. In the original scale development study, Loewy and colleagues (2005) found that the PQ positive symptom items predicted diagnostic status of psychosis risk syndromes (as assessed via semi-structured interviews designed to assess risk for psychosis), while the other item subsets (e.g., negative symptoms and disorganized symptoms) did not. Although the PQ and its short version, the Prodromal Questionnaire-Brief (PQ-B), have been examined for validity in many studies (Ising et al., 2012; Loewy et al., 2005; Loewy, Pearson, Vinogradov, Bearden, & Cannon, 2011), these studies primarily focused on validating the positive symptom subscale of the PQ, given its reported predictive validity for psychosis-risk syndromes.
To date, no studies have examined the underlying factor structure of the PQ negative symptom subscale (PQ-N). Thus, it is unclear how many domains of negative symptoms are captured by this subscale. Although some items (see Table 3) appear to probe asociality (e.g., item 21), avolition (e.g. item 85), or anhedonia (e.g. item 82), not all items appear to align with a specific domain (e.g. item 16), and no items appear to examine blunted affect or alogia.
Table 3.
Factor Loadings based on an Exploratory Factor Analysis Results with a Geomin rotation for the 19 negative symptom items on the Prodromal Questionnaire (PQ)
| Item | Question | Factor 1 Social Dysfunction |
Factor 2 Dissociative/Depressive |
|---|---|---|---|
| 39 | I have gotten very nervous when I had to make polite conversation. | 0.930* | |
| 80 | I have been extremely anxious when meeting people for the first time. | 0.929* | |
| 87 | I have avoided going to places where there were many people because I get anxious. | 0.774* | |
| 33 | I have had nothing to say or very little to say. | 0.708* | |
| 21 | I have been very quiet and have kept in the background on social occasions. | 0.687* | |
| 43 | I have avoided social activities with other people. | 0.629* | |
| 59 | I have tended to keep my feelings to myself. | 0.595* | |
| 66 | I have not been very good at returning social courtesies and gestures. | 0.593* | |
| 78 | I have had little interest in getting to know other people. | 0.581* | |
| 58 | People have found me to be aloof and distant. | 0.469* | 0.345* |
| 42 | I have found it hard to be emotionally close to other people. | 0.421* | 0.337* |
| 48 | I have felt unable to enjoy things that I used to enjoy. | 0.932* | |
| 89 | I have felt uninterested in the things I used to enjoy. | 0.916* | |
| 81 | I have felt like I was at a distance from myself, as if I were outside my own body or that a part of my body did not belong to me. | 0.678* | |
| 82 | I have found that when something sad happened, I was no longer able to feel sadness, or when something joyful happened, I could not feel happy. | 0.669* | |
| 16 | I have noticed a sense of not knowing who I am. | 0.555* | |
| 71 | I have felt like I was looking at myself as in a movie, or that I was a spectator in my own life. | 0.529* | |
| 85 | I have felt unable to carry out everyday tasks because of fatigue or lack of motivation. | 0.493* | |
| 14 | I have had difficulty expressing my feelings as well as I used to. | 0.437* |
Note: N=1,556 Factor loadings <.3 are suppressed. Probability
p<.05
These limitations may be in part due to the measure development strategies utilized to construct the PQ. Although some novel items were added to the PQ by its authors (Loewy et al., 2015) the majority of prompts included in the PQ were drawn from the Schizotypal Personality Questionnaire (SPQ; Raine, 1991) and the Structured Interview for Prodromal Syndromes (SIPS; Miller et al., 2002). Notably, the SIPS negative symptom subscale has yet to be validated; and the SPQ was modeled not on negative symptoms, but on the DSM-III-R criteria for schizotypial personality disorder (Raine, 1991). Although the concurrent validity of the PQ has been demonstrated, the PQ’s development was not informed by the use of scale development tools such as CFA and EFA. Thus, due to these important limitations of the scales the PQ was constructed from, there may be a lack of content validity.
Although the PQ-N has been shown to have good internal consistency in multiple samples (Kotzalidis et al., 2017; Loewy et al., 2005), the factor structure and external validity of the measure are unexamined. Because the PQ is widely used and can be utilized in both clinical and research samples (Loewy, Johnson, & Cannon, 2007), it is imperative to determine the validity of its negative symptom subscale. The present study sought to determine 1) the factor structure of the PQ-N and 2) the discriminant and convergent validity with other measures of negative symptoms, as well with measures of other psychopathology. As the PQ-N appears to investigate multiple domains of negative symptoms, a multi-factor solution is expected. Furthermore, based on the content of the PQ-N items and their similarity to other measures of negative symptoms utilized in support of the 2-factor model, it is not expected that the resultant factors will align with previous research indicating that the underlying factor structure of negative symptoms consists of both a diminished or poor emotional expression factor, and an avolition-apathy factor, given that there are not items that fully capture theses dimensions (Ergül & Üçok, 2015; Galderisi et al., 2013; Kimhy et al., 2006; Nakaya, & Ohmori, 2008; Peralta & Manuel, 1995; Strauss et al., 2013). After determining the underlying factor structure of the PQ-N, its convergent and divergent validity will be examined by comparing the PQ-N and any resultant factors to well-established measures of negative symptoms and related psychopathology that have been previously determined to be highly valid and reliable.
Methods
Participants
The present protocol was approved by the Institutional Review Board at Temple University. Written informed consent was obtained from all participants prior to their enrollment in the study. We report how we determined our sample size, all data exclusions, all manipulations, and all measures in the study. In order to ensure a full range of psychotic-like experiences was represented, the present study consisted of a large sample of undergraduates (N=1556) who were identified via a multidisciplinary, online subject pool (sample characteristics are provided in Table 1). Undergraduates were selected in order to obtain a sample consisting of young adults; as the late teens to mid-20s represent the typical ages wherein subthreshold psychotic symptoms tend to emerge (Cannon et al., 2008). The present sample therefore represents an appropriate population for the assessment of prodromal symptoms as measured by the PQ. Notably, participants in the present sample were primarily female. However, evidence is mixed regarding biological sex differences in symptom expression in CHR populations, although some evidence suggests males may have more severe negative symptoms than females (Barajas, Ochoa, Obiols, & Lalucat-Jo, 2015). Finally, previous studies examining psychotic-like experiences in undergraduate samples have demonstrated that obtaining a full range of psychosis spectrum symptoms in this population is feasible (e.g. Cooper, Kring, & Ellman, 2018). Participants completed computerized versions of questionnaires online in the laboratory, with trained lab staff available to both provide instructions and answer questions. Students who did not complete all measures were excluded from this study. Data collection has been ongoing (e.g., based on doctoral student projects); therefore, measures were added during different time periods based on initiation of new projects (i.e., data were not missing, but rather the given questionnaire had not been added to the protocol).
Table 1.
Participant Demographics (N=1,556)
| Male, n (%) | 388 (24.9%) |
| Age, mean (SD) | 20.86 (2.44) |
| Ethnicity, Hispanic, n (%) | 102 (6.6%) |
| Race, n (%) | |
| White | 910 (58.5%) |
| Black/African American | 256 (16.5%) |
| Asian | 229 (14.7%) |
| Biracial or Multiracial | 73 (4.7%) |
| American Indian/Alaska Native | 5 (0.3%) |
| Native Hawaiian/Pacific Islander | 3 (0.2%) |
| Other | 80 (5.1%) |
Instruments
The Prodromal Questionnaire
The PQ consists of 92 true/false questions that measure the presence of positive symptoms, negative symptoms, disorganized symptoms (e.g. decreased hygiene and odd behavior), and general symptoms (e.g. impaired role functioning) (Loewy et al., 2005). The PQ-N is a 19-item subscale of the PQ meant to identify the presence of negative symptoms and consists of questions such as, “I have found that when something sad happened, I was no longer able to feel sadness,” or “When something joyful happened, I could not feel happy”. These items, as well as the items from the other subscales, are mixed together randomly throughout the PQ so that the items are neither clumped together nor are they presented in a meaningful order. Similar to the other PQ subscales, the PQ-N was found to have good internal consistency (α =.88) by Loewy et al., 2005.
The Temporal Experience of Pleasure Scale
Anticipatory pleasure (the ability to anticipate a future hedonic experience) and consummatory pleasure (the in-the-moment hedonic experience of a given activity or event) were examined utilizing the TEPS. The TEPS is an 18-item scale that includes items such as, “I love the sound of rain on the windows when I’m lying in my warm bed” and “When something exciting is coming up in my life, I really look forward to it” which are rated on a scale from 1 (very false for me) to 6 (very true for me) (Gard et al., 2006). To date, the TEPS has been validated in a number of samples, its factor structure has been well documented (Chan et al., 2012; Garfield, Cotton, & Lubman, 2016; Loas et al., 2009; Simon et al., 2018; Geaney, Treadway, & Smillie, 2015), and its internal consistency for its subscales has been shown to range from α=.74−90 for anticipatory pleasure, and α=.54−.84 for consummatory pleasure in previous studies (Gard et al., 2006; Garfield, Cotton, & Lubman, 2016; Geaney, Treadway, & Smillie, 2015). In the present study, α=.75 for anticipatory pleasure, and α=.67 for consummatory pleasure.
General Causality Orientation Scale for Clinical Populations
Motivation deficits were examined utilizing the General Causality Orientation Scale for Clinical Populations (GCOS-CP). The GCOS-CP is a measure of motivational orientations derived from the original 51-item General Causality Orientation Scale (GCOS) developed by Deci and Ryan (1985). The GCOS-CP examines three motivation orientations: autonomy (i.e., intrinsic motivation), control (i.e., external motivation), and impersonal (i.e., amotivation or lack of agency) (Cooper, Lavaysse, & Gard, 2015; Deci & Ryan, 1985). This measure consists of 8 vignettes that begin with a situational prompt (e.g., “You feel that your friend or roommate is being inconsiderate. You would probably…”) then provides participants with three possible ways to respond, and asks them to rate how likely they would be to respond in that manner on a scale from 1 (very unlikely) to 7 (very likely) (e.g., 1) “Find an opportunity to explain why it bothers you; your friend or roommate may not even realize how much it is bothering you.”, 2) “Say nothing; if your friend or roommate cared about you she would understand how you felt.”, 3) “Demand that your friend or roommate start being more considerate; otherwise you’ll respond similarly”). The GCOS-CP has been shown to have good convergent and divergent validity, and its respective sub-scales display adequate to good fit, with an internal consistency of α=.74 for autonomy α=.65 for control, and α=.67 for impersonal orientations (Cooper et al., 2015). In the present study, α=.82 for autonomy, α=.60 for control, and α=.70 for impersonal orientations.
The Center for Epidemiologic Studies Depression Scale - Short Form
The presence of depressive symptoms was measured utilizing the Center for Epidemiologic Studies Depression Scale Short Form (CES-D-10). The CES-D-10 is a psychometrically sound (Björgvinsson, Kertz, Bigda-Peyton, McCoy, & Aderka, 2013), shortened form of the original 20-item Center for Epidemiologic Studies Depression Scale (CES-D) developed by Radloff (1977). To date, the CES-D-10 has been validated in a number of samples, and has consistently demonstrated good reliability (Andersen, Malmgren, Carter, & Patrick, 1994; Björgvinsson, et al., 2013; Irwin, Artin, & Oxman, 1999; Zhang et al., 2012) with an internal consistency of α=.89 in other studies (Björgvinsson, et al., 2013), and α=.82 in the present study.
The State-Trait Anxiety Inventory Trait Form
The presence of current anxiety symptoms was measured utilizing the State-Trait Anxiety Inventory Trait Form (STAI-T), a subscale of the State-Trait Anxiety Inventory that eliminates items that load highly onto depression (Spielberger, 1983; Spielberger, Vagg, Barker, Donham, & Westberry, 1980; Bieling, Antony, & Swinson, 1998). This version of the scale was selected in order to optimize our ability to compare the PQ-N to a measure of anxiety without conflating depression and anxiety. The STAI-T consists of 7-items and has been shown to be valid (Maynard et al., 2010; Oei, Evans, & Crook, 1990) as well as reliable and internally consistent α=.81–89 in other samples (Bieling, Antony, & Swinson, 1998; Maynard et al., 2010; Westberry et al., 1988), with α=.86 in the present study.
The Social Phobia Scale
The presence of social anxiety was measured utilizing the Social Phobia Scale (SPS). The SPS is a 20-item, psychometrically sound scale that taps into constructs distinct from general anxiety symptoms, with internal consistency values ranging from α=88−.94 in previous studies (De Beurs, Tielen, & Wollmann, 2014; Mattick & Clarke, 1989; Peters, 2000), α=.93 in the present study, and has been validated in a number of samples (Brown et al., 1997; De Beurs et al., 2014; Olivares, García-López, & Hidalgo, 2001).
Data Analysis
Several analyses were utilized in the present study in order to fully assess the factor structure, discriminant, and convergent validity of the PQ-N items, utilizing SPSS version 24 (IBM Corp., 2013) MPlus version 7 (Muthén & Muthén, 1998), and R. First, an exploratory factor analysis (EFA) was conducted on the PQ-N items utilizing a geomin rotation method using Mplus, Version 7 (Muthén & Muthén, 1998). As the PQ relies on binary responses, the robust weighted least squares estimator (WLSMV) was used. The geomin rotation method is an oblique rotation method, which allows resultant factors to be correlated with one another. This method was preferred as there is evidence that utilizing an orthogonal rotation method may result in an inadvertent loss of information if factors are correlated, and if factors are uncorrelated, oblique and orthogonal rotation methods return near-identical results (Costello & Osborne, 2005; Fabrigar, Wegener, MacCallum, & Strahan, 1999; Mulaik, 2009). The number of factors retained was determined by multiple indices of fit. We examined the results of a scree plot, wherein the number of factors retained is the point at which the plot reaches a natural ‘break point’, and the eigenvalue curve flattens (Cattell, 1966; Velicer & Jackson, 1990). In addition to investigating the scree plot, we also conducted a parallel analysis (Çokluk, & Koçak, 2016; Horn, 1965) and Velicer’s (1976) Minimum Average Partial (MAP) using Principal Components Analysis (PCA) extraction in the psych package in R. Parallel analysis has been demonstrated to perform well with unidimensional binary data (Weng & Chen, 2005). Furthermore, parallel and MAP analyses tend to be more robust to the over-extraction of variables (Zwick & Velicer, 1986) than the scree plot. Both Parallel and MAP analyses have been demonstrated to be appropriate for use with categorical and binary data (Cho, Li, & Bandalos, 2009; Garrido, Abad, & Ponsoda, 2011). Goldbergs (2006) ‘bass-ackwards’ approach was also utilized in order to further clarify the number of factors to retain. This approach may be utilized in PCA and EFA frameworks and is designed to provide further elucidation regarding the number of factors to retain. Specifically, it involves conducting successive factor analyses and organizing them by their respective factor score correlations from level to level.
In addition, no factors containing fewer than three items were retained, as this is in indication of poor fit (Costello & Osborne, 2005). Specific items were retained on a given factor if a minimum factor loading of .32 was attained, which is consistent with previous research (Tabachnick, & Fidell, 2001). If multiple items returned cross loadings of .32 or higher on more than one factor, then the item demonstrating the cross loadings were removed from subsequent analyses to assess their overall influence on the model (Costello & Osborne, 2005). If the items had no influence over the model, they would be retained and remain in the factor to which they had the highest loading; if they significantly altered the model, they would be removed from subsequent analyses (Worthington & Whittaker, 2006). We also examined fit indices obtained from the EFAs. We relied on the comparative fit index (CFI) and root mean square error of approximation (RMSEA), with CFI values greater than 0.90 (Hu & Bentler, 1999) and RMSEA values less than 0.08 indicating good fit (Chen, Curran, Bollen, & Paxton, 2008; Marsh, Hau, & Wen, 2004). We report chi-square statistics for models, but do not interpret them as this index may be overly sensitive to large samples (Markland, 2007; Marsh, Hau, & Wen, 2004). In order to obtain additional fit indices, after the initial EFA was conducted; a secondary EFA was performed using a maximum likelihood estimator in Mplus in order to obtain Akaike Information Critera (AIC; Akaike, 1973) and Bayesian information criterion (BIC; Schwarz, 1978). Lower AIC and BIC scores indicate better fit.
The EFA aimed to ascertain whether the PQ-N items truly belonged to a single ‘negative symptom’ factor, or whether the items fed into multiple factors. In order to assess the consistency of any resultant factors from the PQ-N with previous literature, the variables in each resulting factor were examined to ascertain whether they appeared to capture either diminished emotional expression or avolition-apathy (Ergül & Üçok, 2015; Galderisi et al., 2013; Kimhy et al., 2006; Nakaya, & Ohmori, 2008; Peralta & Manuel, 1995; Strauss et al., 2013).
Next, two-tailed bivariate Pearson’s correlations and correlation coefficient difference tests were conducted on the PQ-N, measures of negative symptoms, and other psychopathology to ascertain the convergent and discriminant validity of the PQ-N. Partial correlations were conducted on the TEPS, GCOS-CP, and PQ-N while controlling for depression and anxiety as measured by the CES-D-10, STAI-T, and SPS to ascertain whether depression and anxiety may account for the observed relationships between the negative symptom scales. Two-tailed bivariate correlations were deemed significant at the p<.05 level. Given that statistically significant positive correlations are common between measures assessing anxiety, negative, and depressive symptoms (Wigman et al., 2012), differences in magnitude of associations were evaluated using Fisher’s r-to-z transformation (Fisher, 1915; Fisher, 1921).
Results
Results from EFAs utilizing the WLSMV and ML estimators indicated relatively good fit for solutions with one to four factors (Table 2). With each addition of a new factor, fit indices improved. Examining the natural ‘break point’ of the scree plot (Figure 1) indicated a 2-factor solution. Results from the parallel analysis indicated that a 7-factor model should be retained; however, given that the PQ-N consists of only 19-items, retaining a 7-factor solution would result in multiple factors with less than 3 items and, thus, result in unstable factors and diminish theoretical interpretability. Results from the MAP analysis indicated that a 2-factor solution is optimal. Notably, MAP analysis have been demonstrated to typically be more accurate and less variable than scree tests (Zwick & Velicer, 1986). Similarly to the scree plot and MAP analysis, results from a parallel analysis with a PCA extraction also supported the retention of a 2-factor solution. The bass-ackwards approach revealed a relatively high degree of downstream stability (Figure 2) that indicates that the inclusion of additional factors is not adding a large degree of theoretically substantive information.
Table 2.
Fit Statistics based on an Exploratory Factor Analysis Results with a Geomin rotation for the 19 negative symptom items on the Prodromal Questionnaire (PQ)
| Factors | Eigenvalue | chi-square | p-value | DF | CFI | RMSEA [CI] | SRMR | MAP | AIC | BIC |
|---|---|---|---|---|---|---|---|---|---|---|
| 1 factor | 9.49 | 1325.98 | >.000 | 152 | 0.935 | .07 [.067–.074] | 0.08 | 0.028 | 29763.31 | 29966.61 |
| 2 factor | 1.56 | 582.55 | >.000 | 134 | 0.975 | .046 [.043–.05] | 0.05 | 0.025 | 29281.08 | 29580.67 |
| 3 factor | 1.02 | 396.13 | >.000 | 117 | 0.984 | .039 [.035–.043] | 0.04 | 0.027 | 29147.85 | 29538.39 |
| 4 factor | 0.86 | 240.176 | >.000 | 101 | 0.992 | .030 [.025–.035] | 0.031 | 0.027 | 29033.96 | 29510.09 |
Note: N=1,556 AIC and BIC were obtained utilizing the ML estimator; all other statistics are drawn from the WLSMV estimator in Mplus.
Figure 1.
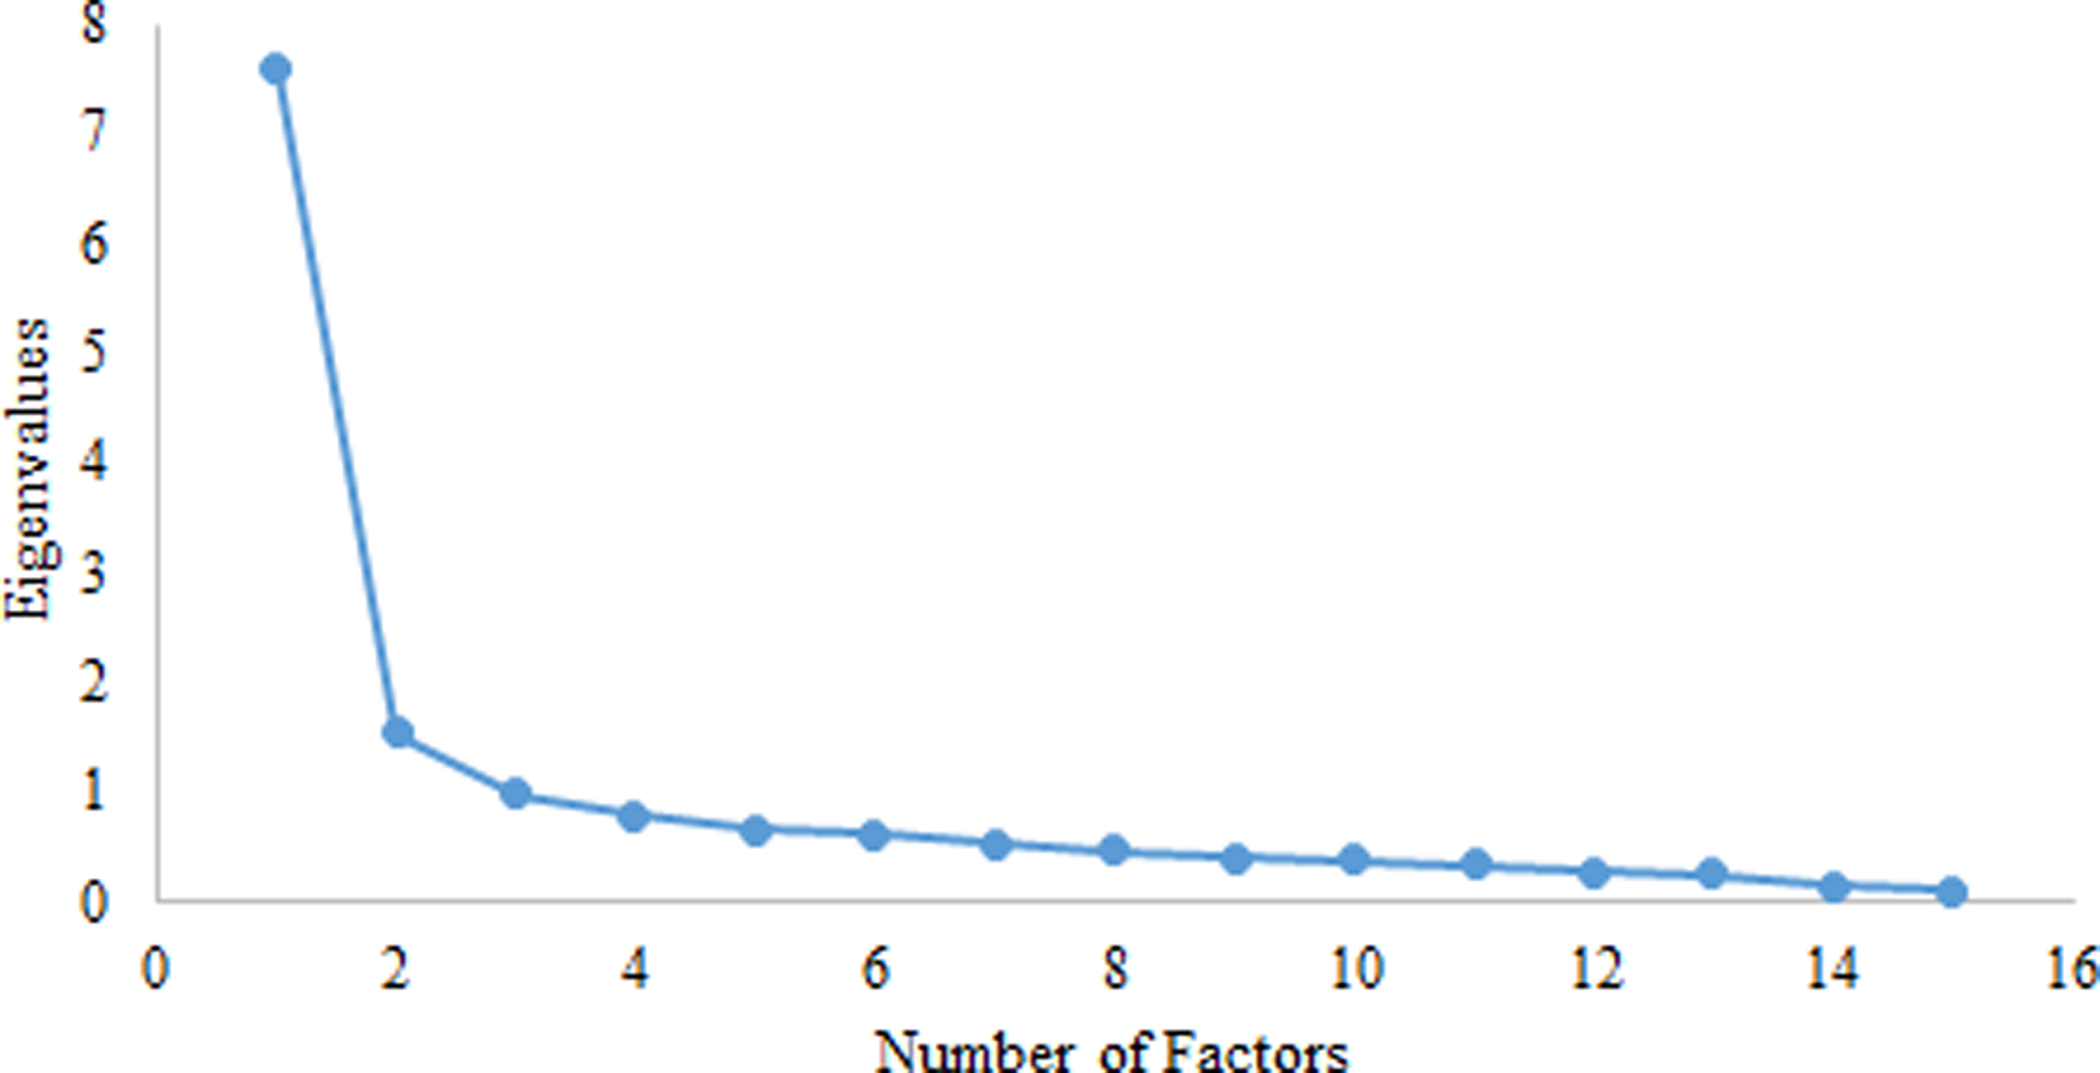
Scree Plot of Eigenvalues for PQ-N Factors
Figure 2:

Goldberg’s Backasswards Model
Note: N=1,556; Model presents 5 factor solutions
The 1-factor solution had the poorest overall fit. Notably, the eigenvalue for the first factor is quite high; which could support a 1-factor solution. However, the 1-factor solution is highly heterogeneous; and consists of items spanning multiple domains such as social dysfunction and dissociative experiences that are difficult to meaningfully summarize from a theoretical perspective. The 2-factor model returned a factor solution that was more theoretically interpretable; Factor 1 included items relating to social dysfunction, and factor two included items associated with dissociative and depressive experiences (Table 3). The 2-factor solution’s factors were highly correlated (r=.79, p<.05). However, although dissociative and depressive symptoms are highly related; they arguably represent separate constructs. The 3-factor model (Supplemental Table 1) had improved fit in comparison to the 1 and 2 factor models, but was less theoretically interpretable. In this 3-factor model, a strong factor consisting of social dysfunction was still retained. However, both factors 2 and 3 consisted of a mixture of items related to diminished enjoyment and motivation as well dissociative experiences.
Finally, in the 4-factor model (Supplemental Table 2) the previously highly stable social dysfunction factor splits into two factors that are highly related to one another (r=.61, p<.05). Although these factors are difficult to separate theoretically, factor 2 notably consists of all items explicitly using the words “anxious” and “nervous”. In the 4-factor model, it is also notable that factors 3 and 4 remained stable, with the exception of item 16 moving its highest loading to factor 4. With this change, factor 3 emerges as more related to diminished emotional experience and factor 4 consists of items relating to dissociative experiences. However, although factors 3 and 4 improve from an interpretability standpoint, factors 1 and 2 become less interpretable.
Additional supplementary analyses were also conducted to examine the factor structure of the PQ-N. In one analysis, the original sample was randomly split into two sub-samples; an EFA was conducted in one sub-sample and a CFA was conducted on the remaining sample. Outcomes from this analysis provided mixed results that approximated our original analysis results (Supplementary Tables 3–4). However, it is notable that conducting a CFA on categorical item-level data has limitations, such as the potential overestimation of factors (Bernstein & Teng, 1989; Nunnally & Bernstein, 1994). Due to the variability in internal consistencies of scales utilized in the present study, additional supplementary analyses were conducted in R and disattenuating correlation coefficients (Osborne, 2003; Zimmerman, & Williams, 1997) were obtained for 1, 2, 3, and 4 factor solutions. Results indicated that correlations obtained in the present study were not strongly influenced by measurement error (Supplemental Tables 5–7).
Taken together, the statistical and theoretically informed results from the EFA are mixed. In the present study, we retained a 2-factor solution; χ2 (134) =582.55, p<.0001; CFI=.98; RMSEA=.046 [90% CI = .04, .05]. This selection was based on statistical support from the Scree plot, Parallel Analysis, and MAP analysis; as well as evidence of high stability obtained from utilizing the bass-ackwards approach and examining raw and disattenuated correlations between factors. The high level of stability across factors found in these analyses are indicative that although model fit may improve with model complexity, the 3 and 4 factor solutions had less overall support theoretically and from the various analyses. The 2-factor model was also selected due to its theoretical interpretability. Specifically, both the 3 and 4 factor solutions returned factors that were difficult to interpret theoretically, and the 1-factor model was highly heterogeneous. Thus, although there are some reservations regarding potential heterogeneity in the second factor, the 2-factor model was retained.
Some cross-loadings were present in the 2-factor model; however, omitting items with cross-loadings from the analysis did not diminish model fit nor change the substantive interpretation of the model solution. As such, all items were retained in subsequent analyses. The internal consistency of the PQ-N factor 1 was α=.84, and factor 2 was α=.79, which indicated good internal consistency for both factors. However, neither of the resultant factors from the PQ-N appeared to fully align with the factors that negative symptoms appear to be comprised of based off previous literature; namely diminished emotional expression and avolition-apathy.
In order to examine the potential distributional effects resulting from the frequency of item endorsement, average thresholds for each factor were estimated and the frequency of item endorsement was examined. Results indicated that for the 2-factor model, the threshold for factor 1 (social dysfunction) and factor 2 (dissociative/depressive) were 0.09 and 0.59 respectively. Although the threshold for factor 2 was higher compared to that of factor 1; these results are not unexpected given the content of the factors. For example, factor 1 contains multiple items that are indicative of anxiousness or nervousness, which is expected to be endorsed more frequently than dissociative experiences such as being an outside observer of one’s own actions (Bandelow & Michaelis, 2015; Loewenstein, 2018). Thus, although the average threshold for factor 2 is higher, we attribute this difference to content rather than distributional properties. Notably, the mean number of symptoms endorsed on the PQ-N was 7.45 with a standard deviation of 5; which is indicative of the presence of a full range of experiences.
Pearson’s correlations were conducted on the full PQ-N, the two resultant PQ-N factors identified in the EFA, negative symptom scales, and measures of other psychopathology (Table 4). We compared all associations between PQ-N items with measures of other psychopathology and negative symptoms and found that associations with the former criteria were stronger than those with the latter (z’s ranged from 15.1 to 26.3, all p’s<.01). This suggests that the 19-item PQ-N does not display adequate convergent or divergent validity with other measures of negative symptoms. The internal consistency of the full PQ-N was α=.88, which is the exact value identified by Loewy et al, 2005. We conducted similar comparisons of associations between the PQ-N EFA-based factors with measures of other psychopathology and negative symptoms. Similar to the results focusing on the total PQ-N score, PQ-N factors were more strongly correlated with measures of other psychopathology than with measures of negative symptoms for both PQ-N factor 1 (all z’s ranged from 6.9 to 18.5, all, ps<.01) and PQ-N factor 2 (all z’s ranged from 15.3 to 22.2, all ps<.01). When controlling for anxiety and depression, the relationship between the two PQ-N factors was greatly reduced (z=19.67, p<.001) as compared with their initial correlation, although the relationship remained significant (Table 5).
Table 4.
Descriptive Statistics and Correlations
| Measure | PQ Negative | PQ Factor 1 | PQ Factor 2 | TEPS-ANT | TEPS-CON | GCOS-A | GCOS-C | GCOS-I | CES-D-10 | STAI-T | SPS |
|---|---|---|---|---|---|---|---|---|---|---|---|
| PQ Negative | 1 | ||||||||||
| PQ Factor 1 | .94** | 1 | |||||||||
| PQ Factor 2 | .86** | .64** | 1 | ||||||||
| TEPS-ANT | −.20** | −.20** | −.15** | 1 | |||||||
| TEPS-CON | −.09** | −.10** | −.05* | .46** | 1 | ||||||
| GCOS-A | −.11** | −.09** | −.11** | .27** | .28** | 1 | |||||
| GCOS-C | −0.01 | −0.02 | 0.01 | .17** | 0.03 | .22** | 1 | ||||
| GCOS-I | .30** | .30** | .22** | −0.04 | −0.02 | −.11** | .24** | 1 | |||
| CES-D-10 | .67** | .57** | .67** | −.23** | −.12** | −.15** | 0.01 | .26** | 1 | ||
| STAI-T | .60** | .49** | .62** | −.12** | −.07** | −.11** | 0.05 | .25** | .70** | 1 | |
| SPS | .58** | .57** | .47** | −.11** | −.06* | −.12** | 0.03 | .34** | .54** | .55** | 1 |
| Mean | 7.45 | 5.1 | 2.36 | 47.48 | 37.55 | 43.05 | 27.04 | 28.76 | 7.82 | 12.63 | 14.53 |
| (SD) | 5 | 2.36 | 2.21 | 7.15 | 6.39 | 8.53 | 7.34 | 7.78 | 5.28 | 4.84 | 13.13 |
Note: N= 1,556. PQ: Prodromal Questionnaire; TEPS-ANT: Anticipatory pleasure; TEPS-CON: consummatory pleasure; GCOS-I,A,C: Impersonal, Autonomy, Control; CES-D-10: the Center for Epidemiologic Studies Depression Scale Short Form; STAI-T: State-Trait Anxiety Inventory Trait-Form; SPS: Social Phobia Scale; Probability:
p<.05;
p<.01
Table 5.
Partial Correlations: Controlling for Anxiety and Depression
| Measure | PQ Negative | PQ Factor 1 | PQ Factor 2 | TEPS-ANT | TEPS-CON | GCOS-A | GCOS-C | GCOS-I |
|---|---|---|---|---|---|---|---|---|
| PQ Negative | 1 | |||||||
| PQ Factor 1 | 0.91** | 1 | ||||||
| PQ Factor 2 | 0.74** | 0.39** | 1 | |||||
| TEPS-ANT | −0.08** | −0.10** | −0.015 | 1 | ||||
| TEPS-CON | −0.021 | −0.05* | 0.034 | 0.44** | 1 | |||
| GCOS-A | −0.009 | −0.011 | −0.002 | 0.25** | 0.26** | 1 | ||
| GCOS-C | −0.042 | −0.049 | −0.014 | 0.18** | 0.03 | 0.22** | 1 | |
| GCOS-I | 0.091** | 0.12** | 0.016 | 0.02 | 0.01 | 0.06* | 0.24** | 1 |
Note: N= 1,556. PQ: Prodromal Questionnaire; TEPS-ANT: Anticipatory pleasure; TEPS-CON: consummatory pleasure; GCOS-I, A,C: Impersonal, Autonomy, Control; CES-D-10: the Center for Epidemiologic Studies Depression Scale Short Form; STAI-T: State-Trait Anxiety Inventory Trait-Form; Probability:
p<.05;
p<.01
Discussion
The present study examined the factor structure of the PQ-N and assessed its discriminant and convergent validity with other measures of negative symptoms, as well with measures of other psychopathology. Results from the present study suggest that the PQ-N and its underlying factors neither converge with other measures of negative symptoms, nor do they diverge from other, related measures of psychopathology. Confidence in these findings are further strengthened as the magnitude of the associations between PQ-N and negative symptom scales either remain consistent or are reduced when controlling for anxiety and depression. As such, the PQ-N subscale may not be an optimal measure for accurately assessing the presence of negative symptomatology in non-clinical samples. Our study suggested that a two-factor solution better fit the PQ-N scale than other factor solutions, with the two factors appearing to be related to social dysfunction (factor 1) and dissociative-depressive experiences (factor 2). However, while a 2-factor solution was retained for analysis in the present manuscript, the mixed nature of the indices of model fit indicate that the factor structure of the PQ-N warrants additional research. Although we selected the model with the highest degree of support based on the scree plot, MAP, and supplemental disattenuated correlation analyses, an argument for either unidimensionality or a 4-factor model could be made. Nevertheless, given the importance of accurately assessing negative symptoms, the findings from the present study could have implications for a variety of questionnaire-based protocols. Further, our findings indicate that the PQ-N items may be better at tapping into non-negative symptom related constructs.
As discussed previously, multiple studies have indicated that a two-factor solution may be optimal for capturing the heterogeneity of negative symptoms as assessed by measures such as the SDS, BPRS, and SANS (Ergül & Üçok, 2015; Galderisi et al., 2013; Kimhy et al., 2006; Nakaya, & Ohmori, 2008; Peralta & Manuel, 1995; Strauss et al., 2013). Although the present study identified a two-factor solution, the content of the resultant factors from the PQ-N do not align with the two-factor solutions of negative symptoms found in previous literature. For example, in the present study, the social dysfunction factor consisted of many items that may be more related to social anxiety (e.g. item 87: “I have avoided going to places where there were many people because I get anxious.”) or social cognition (e.g. item 66: “I have not been very good at returning social courtesies and gestures.”), and the dissociative-depressive factor contained items that may indicate dissociative processes (e.g. item 71: “I have felt like I was looking at myself as in a movie, or that I was a spectator in my own life.”) and depression (e.g. item 48: “I have felt unable to enjoy things that I used to enjoy.”). Although the PQ-N factors contained items that could potentially tap into either diminished emotional expression or avolition-apathy (e.g. item 14), neither factor appears to fully capture either of these constructs. Notably, measures assessing alogia and blunted affect were not included in analyses examining convergent and divergent validity as the PQ-N does not contain items relating to these domains.
There are multiple possible explanations for our findings that should be considered. First, many of the PQ-N items are broad (e.g. “I have felt unable to carry out everyday tasks because of fatigue or lack of motivation”). Including such items ensures that the PQ-N is inclusive of many experiences, but potentially increases difficulties in differentiating negative symptoms from affective symptoms. Second, the PQ-N items do not assess the five negative symptom subdomains. Third, the finding that the PQ-N and its factors relate more to measures of other psychopathology may be partially related to overlap between negative symptoms and affective symptoms (e.g., depression), which is a common difficulty in these types of measures (Chemerinski, Bowie, Anderson, & Harvey, 2008; Krynicki, Upthegrove, Deakin, & Barnes, 2018; Marneros & Akiskal, 2007; Müller, Szegedi, Wetzel, & Benkert, 2001). Interestingly, neither the TEPS nor the GCOS-CP overlapped as strongly with measures of other psychopathology as the PQ-N. This suggests that these questionnaires tap into constructs separate from affective symptoms and depression, indicating that their continued use would be beneficial in evaluating negative symptoms.
Furthermore, there may be significant discrepancies in whether items accurately distinguish between primary negative symptoms (i.e., experiences that are fully attributable to negative symptoms) and secondary negative symptoms (i.e., symptoms more attributable to medication effects, positive symptoms, or other depressive symptoms; Flaum, & Andreasen, 1995; Kirschner, Aleman, & Kaiser, 2017). For example, social isolation may be more related to either social anxiety or positive symptoms such as paranoia than to negative symptoms (e.g., asociality). As such, some PQ-N items may inadvertently capture paranoia-related, isolative behaviors or other psychopathological symptoms under negative symptoms.
As mentioned previously, there is mixed research regarding reliability between interview-based and self-report measures of negative symptoms (Blanchard, Kring, Horan, & Gur, 2011; Foussias & Remington, 2010; Kirkpatrick et al., 2006). These potential differences may converge or diverge based on the level of symptom severity that the reporter is experiencing, and warrant investigation in future studies. For example, it may be the case that those experiencing moderate or severe symptoms may be less able to accurately assess and self-report their own levels of negative symptomatology, whereas those with mild symptoms may have more insight into this domain. Better understanding the nuances and potential interactions between symptom severity and type of measure may provide some elucidation as to whether certain types of measures are more accurate or valid within certain sub-populations, or whether they may be used interchangeably between multiple settings.
There are some limitations to the present paper. First, this study utilized a large undergraduate sample for analyses, thus its findings may not be generalizable to other samples, such as help-seeking populations. However, negative symptoms are common, with an estimated 12–20% of non-help-seeking individuals endorsing at least one negative symptom (Dominguez et al., 2010; Werbeloff et al., 2015). Furthermore, the PQ has been previously examined in undergraduate populations (Loewy, Johnson, & Cannon, 2007) with results indicating that undergraduates performed similarly to help-seeking populations experiencing non-psychotic spectrum symptoms, although they have significantly lower scores than their high-risk counterparts. Second, because the GCOS-CP and TEPS are self-report measures, they depend on participants’ level of insight for accurate ratings. Third, although the present study examined the PQ-N in relation to the TEPS and GCOS-CP, we did not examine the PQ-N in relation to other well-supported negative symptom scales or interviews, such as the CAINS (Kring et al., 2013), thus it is possible the PQ-N would have higher convergent validity with other measures, and warrants investigation in future research. There are also some notable strengths to the present study, such as the inclusion of well-established measures of negative symptoms and of related psychopathology as comparison groups as well as sampling from a large undergraduate population; which has been demonstrated to be appropriate for the examination of a full range of psychosis spectrum symptoms in previous studies. Although modern negative symptom measures have seen many improvements in recent years, there is a need to develop measures that accurately assess the five domains of negative symptoms, and to validate and replicate the validity of negative symptom measures in both clinical and non-clinical populations. Our findings highlight that some widely used measures of negative symptoms, such as the PQ, need further investigation as to whether they display adequate convergent and divergent validity, and whether their specified models are adequately reflected by their factor structures. Because previous research has shown that negative symptoms occur prior to the onset of positive symptoms (Häfner et al., 2005), and are a risk factor for the development of psychosis (Cooper, Kring, & Ellman, 2017; Schlosser et al., 2012), it is crucial to develop succinct, valid questionnaire-based assessments of negative symptoms for the early identification of individuals who may be at a heightened risk for psychosis.
Supplementary Material
References
- Akaike H (1987). Factor analysis and AIC. Psychometrika, 52, 317–332. doi: 10.1007/978-1-4612-1694-0_29 [DOI] [Google Scholar]
- Andersen EM, Malmgren JA, Carter WB, & Patrick DL (1994). Screening for depression in well older adults: Evaluation of a short form of the CES-D (Center for Epidemiologic Studies Depression Scale). American Journal of Preventive Medicine, 10, 77–84. doi: 10.1016/S0749-3797(18)30622-6 [DOI] [PubMed] [Google Scholar]
- Andreasen NC (1982). Negative symptoms in schizophrenia: definition and reliability. Archives of General Psychiatry, 39, 784–800. doi: 10.1001/archpsyc.1982.04290070020005 [DOI] [PubMed] [Google Scholar]
- Azis M, Strauss GP, Walker E, Revelle W, Zinbarg R, & Mittal V (2018). Factor Analysis of Negative Symptom Items in the Structured Interview for Prodromal Syndromes. Schizophrenia bulletin. doi: 10.1093/schbul/sby177 [DOI] [PMC free article] [PubMed] [Google Scholar]
- Bandelow B, & Michaelis S (2015). Epidemiology of anxiety disorders in the 21st century. Dialogues in clinical neuroscience, 17(3), 327–335. [DOI] [PMC free article] [PubMed] [Google Scholar]
- Barajas A, Ochoa S, Obiols JE, & Lalucat-Jo L (2015). Gender differences in individuals at high-risk of psychosis: a comprehensive literature review. The Scientific World Journal, 2015. doi: 10.1155/2015/430735 [DOI] [PMC free article] [PubMed] [Google Scholar]
- Bernstein IH, & Teng G (1989). Factoring items and factoring scales are different: Spurious evidence for multidimensionality due to item categorization. Psychological Bulletin, 105(3), 467. doi: 10.1037/0033-2909.105.3.467 [DOI] [Google Scholar]
- Bieling, Antony, & Swinson. (1998). The State-Trait Anxiety Inventory, Trait version: Structure and content re-examined. Behaviour Research and Therapy, 36(7), 777–788. doi: 10.1016/S0005-7967(98)00023-0 [DOI] [PubMed] [Google Scholar]
- Björgvinsson T, Kertz S, Bigda-Peyton J, McCoy K, & Aderka I (2013). Psychometric Properties of the CES-D-10 in a Psychiatric Sample. Assessment, 20(4), 429–436. [DOI] [PubMed] [Google Scholar]
- Blanchard J, & Cohen A (2006). The Structure of Negative Symptoms Within Schizophrenia: Implications for Assessment. Schizophrenia Bulletin, 32(2), 238–245. doi: 10.1016/S0005-7967(98)00023-0 [DOI] [PMC free article] [PubMed] [Google Scholar]
- Blanchard J, Kring A, Horan W, & Gur R (2011). Toward the next generation of negative symptom assessments: the collaboration to advance negative symptom assessment in schizophrenia. Schizophrenia Bulletin, 37(2), 291–299. doi: 10.1093/schbul/sbq104 [DOI] [PMC free article] [PubMed] [Google Scholar]
- Brown Elissa J., Turovsky Julia, Heimberg Richard G., Juster Harlan R., Brown Timothy A, Barlow David H., & Butcher James N. (1997). Validation of the Social Interaction Anxiety Scale and the Social Phobia Scale Across the Anxiety Disorders. Psychological Assessment, 9(1), 21–27. doi: 10.1037/1040-3590.9.1.21 [DOI] [Google Scholar]
- Cannon TD, Cadenhead K, Cornblatt B, Woods SW, Addington J, Walker E, Seidman LJ, Perkins D, Tsuang M, McGlashan T, and Heinssen R (2008). Prediction of psychosis in youth at high clinical risk: a multisite longitudinal study in North America. Archives of general psychiatry 65, 28–37. doi: 10.1001/archgenpsychiatry.2007.3 [DOI] [PMC free article] [PubMed] [Google Scholar]
- Cattell R (1966). The scree test for the number of factors. Multivariate behavioral research, 1(2), 245–276. doi: 10.1207/s15327906mbr0102_10 [DOI] [PubMed] [Google Scholar]
- Chan R, Shi Y, Lai M, Wang Y, Kring Y, Heaton A, & Heaton Robert K. (2012). The Temporal Experience of Pleasure Scale (TEPS): exploration and confirmation of factor structure in a healthy chinese sample (Cross-Validation of TEPS in Chinese). PLoS ONE, 7(4), E35352. doi: 10.1371/journal.pone.0035352 [DOI] [PMC free article] [PubMed] [Google Scholar]
- Chen F, Curran PJ, Bollen KA, & Paxton P (2008). An empirical evaluation of the use of fixed cutoff points in RMSEA test statistic in structural equation models. Sociological Methods and Research, 36, 462–494. doi: 10.1177/0049124108314720 [DOI] [PMC free article] [PubMed] [Google Scholar]
- Chemerinski E, Bowie C, Anderson H, & Harvey P (2008). Depression in schizophrenia: methodological artifact or distinct feature of the illness? The Journal of Neuropsychiatry and Clinical Neurosciences, 20(4), 431–440. doi: 10.1176/jnp.2008.20.4.431 [DOI] [PMC free article] [PubMed] [Google Scholar]
- Cho SJ, Li F, & Bandalos D (2009). Accuracy of the parallel analysis procedure with polychoric correlations. Educational and Psychological Measurement, 69(5), 748–759. doi: 10.1177/0013164409332229 [DOI] [Google Scholar]
- Çokluk Ö, & Koçak D (2016). Using Horn’s Parallel Analysis Method in Exploratory Factor Analysis for Determining the Number of Factors. Educational Sciences: Theory and Practice, 16(2), 537–551. doi: 10.12738/estp.2016.2.0328 [DOI] [Google Scholar]
- Cooper SM, Ellman L, & Kring A (2017). Attenuated positive psychotic symptoms and the experience of anhedonia. Early Intervention in Psychiatry, 1–5. doi: 10.1111/eip.12439 [DOI] [PMC free article] [PubMed] [Google Scholar]
- Cooper S, Kring AM, Ellman LM (2018). Attenuated positive psychotic symptoms and the experience of anhedonia. Early Intervention in Psychiatry, 12(6), 1188–1192. doi: 10.1111/eip.12439. [DOI] [PMC free article] [PubMed] [Google Scholar]
- Cooper S, Lavaysse LM, & Gard DE (2015). Assessing motivation orientations in schizophrenia: Scale development and validation. Psychiatry Research, 225(0), 70–78. doi: 10.1016/j.psychres.2014.10.013 [DOI] [PMC free article] [PubMed] [Google Scholar]
- Costello AB, & Osborne J (2005). Best practices in exploratory factor analysis: Four recommendations for getting the most from your analysis. Practical Assessment,10(7), 1–9. 10.4135/9781412995627.d8 [DOI] [Google Scholar]
- Cronbach L (1951). Coefficient alpha and the internal structure of tests. Psychometrika, 16(3), 297–334. doi: 10.1007/BF02310555 [DOI] [Google Scholar]
- Cuesta, García de Jalón, Campos, Ibáñez, Sánchez-Torres, & Peralta. (2012). Duration of untreated negative and positive symptoms of psychosis and cognitive impairment in first episode psychosis. Schizophrenia Research, 141(2–3), 222–227. [DOI] [PubMed] [Google Scholar]
- De Beurs E, Tielen D, & Wollmann L (2014). The Dutch Social Interaction Anxiety Scale and the Social Phobia Scale: Reliability, Validity, and Clinical Utility. Psychiatry Journal, 2014, 9. doi: 10.1016/j.schres.2012.08.019 [DOI] [PMC free article] [PubMed] [Google Scholar]
- Deci EL, & Ryan RM (1985) The general causality orientations scale: Self-determination in personality. Journal of Research in Personality. 19:109–134. doi: 10.1016/0092-6566(85)90023-6 [DOI] [Google Scholar]
- Demjaha A, Valmaggia L, Stahl D, Byrne M, & McGuire P (2012). Disorganization/cognitive and negative symptom dimensions in the at-risk mental state predict subsequent Transition to Psychosis. Schizophrenia Bulletin, 38(2), 351–359. [DOI] [PMC free article] [PubMed] [Google Scholar]
- Dollfus S, Mach C, & Morello R (2016). Self-evaluation of negative symptoms: a novel tool to assess negative symptoms. Schizophrenia Bulletin, 42(3), 571–578. doi: 10.1093/schbul/sbq088 [DOI] [PMC free article] [PubMed] [Google Scholar]
- Dominguez M, Can Saka M, Lieb R,Wittchen HU, van Os J (2010). Early Expression of Negative/Disorganized Symptoms Predicting Psychotic Experiences and Subsequent Clinical Psychosis: A 10-Year Study. The American Journal of Psychiatry. https://doi-org.libproxy.temple.edu/10.1176/appi.ajp.2010.09060883 [DOI] [PubMed] [Google Scholar]
- Ergül C, Üçok A (2015). Negative symptom subgroups have different effects on the clinical course of schizophrenia after the first episode: a 24-month follow up study. European Psychiatry 30, 14–19. doi: 10.1016/j.eurpsy.2014.07.005 [DOI] [PubMed] [Google Scholar]
- Fisher RA (1921) On the “Probable Error” of a coefficient of correlation deduced from a small Sample. Metron 1: 3–32. [Google Scholar]
- Galderisi S, Bucci P, Mucci A, Kirkpatrick B, Pini S, Rossi A, et al. (2013). Categorical and dimensional approaches to negative symptoms of schizophrenia: focus on long-term stability and functional outcome. Schizophrenia Research, 147, 157–162. doi: 10.1016/j.schres.2013.03.020 [DOI] [PubMed] [Google Scholar]
- Gard DE, Gard MG, Kring AM, & John OP (2006). Anticipatory and consummatory components of the experience of pleasure: A scale development study. Journal of Research in Personality, 40(6), 1086–1102. doi: 10.1016/j.jrp.2005.11.001 [DOI] [Google Scholar]
- Gard David E., Kring Ann M., Gard Marja Germans, Horan William P., & Green Michael F. (2007). Anhedonia in schizophrenia: Distinctions between anticipatory and consummatory pleasure. Schizophrenia Research, 93(1), 253–260. doi: 10.1016/j.schres.2007.03.008 [DOI] [PMC free article] [PubMed] [Google Scholar]
- Garfield, Cotton, & Lubman. (2016). Psychometric properties, validity, and reliability of the Temporal Experience of Pleasure Scale state version in an opioid-dependent sample. Drug and Alcohol Dependence, 161, 238–246. doi: 10.1016/j.drugalcdep.2016.02.011 [DOI] [PubMed] [Google Scholar]
- Garrido LE, Abad FJ, & Ponsoda V (2011). Performance of Velicer’s minimum average partial factor retention method with categorical variables. Educational and Psychological Measurement, 71(3), 551–570. doi: 10.1177/0013164410389489 [DOI] [Google Scholar]
- Geaney J, Treadway M, & Smillie L (2015). Trait anticipatory pleasure predicts effort expenditure for reward. PLoS One, 10(6), PLoS One, June 2015, Vol.10(6). doi: 10.1371/journal.pone.0131357 [DOI] [PMC free article] [PubMed] [Google Scholar]
- Goldberg LR (2006). Doing it all bass-ackwards: The development of hierarchical factor structures from the top down. Journal of Research in Personality, 40(4), 347–358. doi: 10.1016/j.jrp.2006.01.001 [DOI] [Google Scholar]
- Fabrigar LR, Wegener DT, MacCallum RC, & Strahan EJ (1999). Evaluating the use of exploratory factor analysis in psychological research. Psychological Methods, 4(3), 272–299. doi: 10.1037/1082-989X.4.3.272 [DOI] [Google Scholar]
- Flaum & Andreasen. (1995). The reliability of distinguishing primary versus secondary negative symptoms. Comprehensive Psychiatry,36(6), 421–427. doi: 10.1016/S0010-440X(95)90249-X [DOI] [PubMed] [Google Scholar]
- Foussias G, & Remington G (2010). Negative Symptoms in Schizophrenia: Avolition and Occam’s Razor. Schizophrenia Bulletin,36(2), 359–369. doi: 10.1093/schbul/sbn094 [DOI] [PMC free article] [PubMed] [Google Scholar]
- Häfner H, Löffler W, Maurer K, An Der Heiden M, Hambrecht W, & Häfner W (1999). Depression, negative symptoms, social stagnation and social decline in the early course of schizophrenia. Acta Psychiatrica Scandinavica, 100(2), 105–118. doi: 10.1111/j.1600-0447.1999.tb10831.x [DOI] [PubMed] [Google Scholar]
- Häfner, Maurer, Trendler, An Der Heiden, Schmidt, & Könnecke. (2005). Schizophrenia and depression: Challenging the paradigm of two separate diseases—A controlled study of schizophrenia, depression and healthy controls. Schizophrenia Research, 77(1), 11–24. doi: 10.1016/j.schres.2005.01.004 [DOI] [PubMed] [Google Scholar]
- Herbener E, Harrow M, & Baker Timothy B. (2002). The Course of Anhedonia During 10 Years of Schizophrenic Illness. Journal of Abnormal Psychology, 111(2), 237–248. doi: 10.1037/0021-843X.111.2.237 [DOI] [PubMed] [Google Scholar]
- Ho P, Cooper A, Hall P, & Smillie L (2015). Factor structure and construct validity of the temporal experience of pleasure scales. Journal of Personality Assessment, 97(2), 200–8. doi: 10.1080/00223891.2014.940625 [DOI] [PubMed] [Google Scholar]
- Horan W, Kring A, & Blanchard J (2006). Anhedonia in Schizophrenia: A Review of Assessment Strategies. Schizophrenia Bulletin, 32(2), 259–273. doi: 10.1093/schbul/sbj009 [DOI] [PMC free article] [PubMed] [Google Scholar]
- Horn JL (1965). A rationale and test for the number of factors in factor analysis. Psychometrica, 30(2), 179–185. doi: 10.1007/BF02289447 [DOI] [PubMed] [Google Scholar]
- Hu L, & Bentler P (1999). Cutoff criteria for fit indexes in covariance structure analysis: Conventional criteria versus new alternatives. Structural Equation Modeling: A Multidisciplinary Journal, 6(1), 1–55. doi: 10.1080/10705519909540118 [DOI] [Google Scholar]
- Iancu Poreh, Lehman Shamir, & Kotler. (2005). The Positive and Negative Symptoms Questionnaire: A self-report scale in schizophrenia. Comprehensive Psychiatry, 46(1), 61–66. doi: 10.1016/j.comppsych.2004.07.014 [DOI] [PubMed] [Google Scholar]
- IBM Corp. (2013). IBM SPSS Statistics for Windows, Version 24.0. Armonk, NY: IBM Corp. [Google Scholar]
- Irwin M, Artin K, & Oxman M (1999). Screening for Depression in the Older Adult: Criterion Validity of the 10-Item center for epidemiological studies depression scale (CES-D). Archives of Internal Medicine, 159(15), 1701–1704. doi: 10.1001/archinte.159.15.1701 [DOI] [PubMed] [Google Scholar]
- Ising H, Veling W, Loewy R, Rietveld M, Rietdijk J, Dragt S, … Van der Gaag M (2012). The Validity of the 16-Item Version of the Prodromal Questionnaire (PQ-16) to screen for ultra high risk of developing psychosis in the general help-seeking population. Schizophrenia Bulletin, 38(6), 1288–1296. doi: 10.1093/schbul/sbs068 [DOI] [PMC free article] [PubMed] [Google Scholar]
- Kay SR, Fiszbein LA, & Opler LA (1987). The Positive and Negative Syndrome Scale (PANSS) for Schizophrenia. Schizophrenia Bulletin, 13(2) 108–112. doi: 10.1093/schbul/13.2.261 [DOI] [PubMed] [Google Scholar]
- Kilian S, Asmal L, Goosen A, Chiliza B, Phahladira L, & Emsley R (2015). Instruments measuring blunted affect in schizophrenia: A systematic review. Plos One, 10(6), E0127740. doi: 10.1371/journal.pone.0127740 [DOI] [PMC free article] [PubMed] [Google Scholar]
- Kim JS, Jang SK, Park SC, Yi JS, Park JK, Lee JS, … Lee SH (2016). Measuring negative symptoms in patients with schizophrenia: Reliability and validity of the Korean version of the Motivation and Pleasure Scale-Self-Report. Neuropsychiatric Disease and Treatment, 1167–1172. doi: 10.2147/NDT.S107775 [DOI] [PMC free article] [PubMed] [Google Scholar]
- Kimhy D, Yale S, Goetz R, McFarr L, & Malaspina D (2006). The Factorial Structure of the Schedule for the Deficit Syndrome in Schizophrenia. Schizophrenia Bulletin, 32(2), 274–278. doi: 10.1093/schbul/sbi064 [DOI] [PMC free article] [PubMed] [Google Scholar]
- Kirkpatrick B, Buchanan RW, McKenney PD, Alphs LD, Carpenter WT (1989). The Schedule for the Deficit Syndrome: an instrument for research in schizophrenia. Psychiatry Research, 30, 119–124. doi: 10.1016/0165-1781(89)90153-4 [DOI] [PubMed] [Google Scholar]
- Kirkpatrick B, Fenton W, Carpenter W, & Marder S (2006). The NIMH-MATRICS consensus statement on negative symptoms. Schizophrenia Bulletin, 32(2), 214–219. doi: 10.1093/schbul/sbj053 [DOI] [PMC free article] [PubMed] [Google Scholar]
- Kirschner, Aleman, & Kaiser. (2017). Secondary negative symptoms — A review of mechanisms, assessment and treatment. Schizophrenia Research, 186, 29–38. doi: 10.1016/j.schres.2016.05.003 [DOI] [PubMed] [Google Scholar]
- Kotzalidis, Solfanelli, Piacentino, Savoja, Fiori Nastro, Cursto, … Schultze-Lutter. (2017). The Italian version of the 92-item prodromal questionnaire: concurrent validity with the SIPS and factor analysis in a sample of 258 outpatients aged 11–36 years. Schizophrenia Research, 189, 50–56. doi: 10.1016/j.schres.2017.02.008 [DOI] [PubMed] [Google Scholar]
- Kring A, Gur R, Blanchard J, Horan W, & Reise S (2013). The clinical assessment interview for negative symptoms (CAINS): Final Development and Validation. The American Journal of Psychiatry,170(2), 165–72. doi: 10.1176/appi.ajp.2012.12010109 [DOI] [PMC free article] [PubMed] [Google Scholar]
- Krynicki C, Upthegrove R, Deakin J, & Barnes T (2018). The relationship between negative symptoms and depression in schizophrenia: A systematic review. Acta Psychiatrica Scandinavica, Acta psychiatrica Scandinavica, 13 March 2018. doi: 10.1111/acps.12873 [DOI] [PubMed] [Google Scholar]
- Kumari S, Malik M, Florival C, Manalai P, & Sonje S (2017). An assessment of five (PANSS, SAPS, SANS, NSA-16, CGI-SCH) commonly used symptoms rating scales in schizophrenia and comparison to newer scales (CAINS, BNSS). Journal of Addiction Research & Therapy, 8(3), 324. doi: 10.4172/2155-6105.1000324 [DOI] [PMC free article] [PubMed] [Google Scholar]
- Kurtz M (2005). Symptoms Versus Neurocognitive Test performance as predictors of psychosocial status in schizophrenia: A 1- and 4-year prospective study. Schizophrenia Bulletin, 31(1), 167–174. doi: 10.1093/schbul/sbi004 [DOI] [PubMed] [Google Scholar]
- Lencz, Smith, Auther, Correll, & Cornblatt. (2004). Nonspecific and attenuated negative symptoms in patients at clinical high-risk for schizophrenia. Schizophrenia Research, 68(1), 37–48. doi: 10.1016/S0920-9964(03)00214-7 [DOI] [PubMed] [Google Scholar]
- Liddle P (1987). The symptoms of chronic schizophrenia. A re-examination of the positive-negative dichotomy. The British Journal of Psychiatry : The Journal of Mental Science, 151, 145–51. 10.1192/bjp.151.2.145 [DOI] [PubMed] [Google Scholar]
- Llerena K, Park SG, McCarthy JM, Couture SM, Bennett ME, Blanchard JJ (2013) The Motivation and Pleasure Scale–Self-Report (MAP-SR): Reliability and validity of a self-report measure of negative symptoms. Comprehensive Psychiatry, 54(5), 568–574. 10.1016/j.comppsych.2012.12.001 [DOI] [PMC free article] [PubMed] [Google Scholar]
- Loas, Monestes, Ameller, Bubrovszky, Yon, Wallier, … Gard. (2009). Traduction et étude de validation de la version française de l’échelle d’expérience temporelle du plaisir (EETP, Temporal Experience of Pleasure Scale [TEPS], Gard et al., 2006): étude chez 125 étudiants et chez 162 sujets présentant un trouble psychiatrique. Annales Médico-psychologiques, 167(9), 641–648. doi: 10.1016/j.amp.2009.09.002 [DOI] [Google Scholar]
- Loewenstein RJ (2018). Dissociation debates: everything you know is wrong. Dialogues in clinical neuroscience, 20(3), 229–242. [DOI] [PMC free article] [PubMed] [Google Scholar]
- Loewy RL, Bearden CE, Johnson JK, Raine A, & Cannon TD (2005). The prodromal questionnaire (PQ): Preliminary validation of a self-report screening measure for prodromal and psychotic syndromes. (Report). Schizophrenia Research, 77(2 3), 141–149. doi: 10.1016/j.schres.2005.03.007 [DOI] [PubMed] [Google Scholar]
- Loewy, Johnson, & Cannon. (2007). Self-report of attenuated psychotic experiences in a college population. Schizophrenia Research, 93(1), 144–151. doi: 10.1016/j.schres.2007.02.010 [DOI] [PMC free article] [PubMed] [Google Scholar]
- Loewy, Pearson, Vinogradov, Bearden, & Cannon. (2011). Psychosis risk screening with the Prodromal Questionnaire — Brief Version (PQ-B). Schizophrenia Research, 129(1), 42–46. doi: 10.1016/j.schres.2011.03.029 [DOI] [PMC free article] [PubMed] [Google Scholar]
- Lyne, O’donoghue, Roche, Behan, Jordan, Renwick, … Clarke. (2015). Illness characteristics and symptoms in an Irish early intervention for psychosis service. Irish Journal of Psychological Medicine, 32(01), 147–154. doi: 10.1017/ipm.2014.79 [DOI] [PubMed] [Google Scholar]
- Mach C, Morello R, & Dollfus S (2015). The Self-report of Negative Symptoms (SNS): Validity of a Self-assessment of Negative Symptoms in Patients with Schizophrenia. European Psychiatry, 30, 878. doi: 10.1016/S0924-9338(15)30686-6 [DOI] [Google Scholar]
- Marder & Kirkpatrick(2014). Defining and measuring negative symptoms of schizophrenia in clinical trials. European Neuropsychopharmacology, 24(5), 737–743. doi: 10.1016/j.euroneuro.2013.10.016. [DOI] [PubMed] [Google Scholar]
- Markland D (2007). The golden rule is that there are no golden rules: A commentary on Paul Barrett’s recommendations for reporting model fit in structural equation modeling. Personality and Individual Differences, 42, 851–858. doi: 10.1016/j.paid.2006.09.023 [DOI] [Google Scholar]
- Marneros A, & Akiskal H (2007). The overlap of affective and schizophrenic spectra. Cambridge; New York: Cambridge University Press, 159–168. doi: 10.1192/bjp.191.4.366 [DOI] [Google Scholar]
- Marsh H, Hau K, & Wen Z (2004). In Search of golden rules: Comment on hypothesis-testing approaches to setting cutoff values for fit indexes and dangers in overgeneralizing Hu and Bentler’s (1999) findings. Structural Equation Modeling: A Multidisciplinary Journal,11(3), 320–341. doi: 10.1207/s15328007sem1103_2 [DOI] [Google Scholar]
- Mattick RP, & Clarke JC (1989). Development and validation of measures of social phobia scrutiny fear and social interaction anxiety. Behaviour Research and Therapy, 36(4), 455–45570. doi: 10.1080/15428119891010686 [DOI] [PubMed] [Google Scholar]
- Maynard D, Campbell M, Devonish D, Leon T, Emmanuel M, & Roberti J (2010). Psychometric properties and factorial structure of the State Trait Anxiety Inventory-Trait version (STAI-T) in Caribbean university students. Journal of Psychology in Africa, 20(1), 7–12. doi: 10.1080/14330237.2010.10820337 [DOI] [Google Scholar]
- Milev P, Ho B, Arndt S, & Andreasen N (2005). Predictive Values of Neurocognition and Negative Symptoms on Functional Outcome in Schizophrenia: A Longitudinal First-Episode Study With 7-Year Follow-Up. American Journal of Psychiatry, 162(3), 495–506. doi: 10.1176/appi.ajp.162.3.495 [DOI] [PubMed] [Google Scholar]
- Miller TJ, McGlashan TH, Rosen JL, Somjee L, Markovich PJ, Stein K, & Woods SW (2002). Prospective diagnosis of the initial prodrome for schizophrenia based on the Structured Interview for Prodromal Syndromes: preliminary evidence of interrater reliability and predictive validity. American Journal of Psychiatry, 159(5), 863–865. doi: 10.1176/appi.ajp.159.5.863 [DOI] [PubMed] [Google Scholar]
- Mohamed S, Rosenheck R, Swartz M, Stroup S, Lieberman J, & Keefe R (2008). Relationship of cognition and psychopathology to functional impairment in Schizophrenia. American Journal of Psychiatry, 165(8), 978–987. doi: 10.1176/appi.ajp.2008.07111713 [DOI] [PubMed] [Google Scholar]
- Mulaik SA (2009). Foundations of factor analysis (2nd ed.). Boca Raton, FL: Chapman & Hall/CRC. [Google Scholar]
- Müller, Szegedi, Wetzel, & Benkert. (2001). Depressive factors and their relationships with other symptom domains in schizophrenia, schizoaffective disorder, and psychotic depression. Schizophrenia Bulletin, 27(1), 19–28. [DOI] [PubMed] [Google Scholar]
- Muthén LK & Muthén BO (1998–2012). Mplus user’s guide. Seventh edition Los Angeles, CA: Muthén & Muthén. [Google Scholar]
- Nakaya, & Ohmori. (2008). A two-factor structure for the Schedule for the Deficit Syndrome in schizophrenia. Psychiatry Research,158(2), 256–259. doi: 10.1016/j.psychres.2007.10.008 [DOI] [PubMed] [Google Scholar]
- Narvaez, Twamley, Mckibbin, Heaton, & Patterson. (2008). Subjective and objective quality of life in schizophrenia. Schizophrenia Research,98(1), 201–208. doi: 10.1016/j.schres.2007.09.001 [DOI] [PMC free article] [PubMed] [Google Scholar]
- Nunnally JC (1994). Psychometric theory 3E. Tata McGraw-Hill Education. [Google Scholar]
- Oei T, Evans L, & Crook G (1990). Utility and validity of the STAI with anxiety disorder patients. British Journal of Clinical Psychology, 29, 429–432. [DOI] [PubMed] [Google Scholar]
- Ohata H, Yotsumoto K, Taira M, Kochi Y, & Hashimoto T (2014). Reliability and validity of a brief self-rated scale of health condition with acute schizophrenia. Psychiatry and Clinical Neurosciences, 68(1), 70–7. doi: 10.1111/pcn.12105 [DOI] [PubMed] [Google Scholar]
- Olivares J, García-López L, & Hidalgo M (2001). The Social Phobia Scale and the Social Interaction Anxiety Scale: Factor Structure and Reliability in a Spanish-Speaking Population. Journal of Psychoeducational Assessment, 19(1), 69–80. doi: 10.1177/073428290101900105 [DOI] [Google Scholar]
- Osborne JW (2003). Effect sizes and the disattenuation of correlation and regression coefficients: lessons from educational psychology. Practical Assessment, Research & Evaluation, 8(11), 1–5. [Google Scholar]
- Overall JE, Gorham DR (1962). The brief psychiatric rating scale. Southern Universities Press, 10, 799–812. doi: 10.2466/pr0.1962.10.3.799 [DOI] [Google Scholar]
- Park, Llerena, Mccarthy, Couture, Bennett, & Blanchard. (2012). Screening for negative symptoms: preliminary results from the self-report version of the Clinical Assessment Interview for Negative Symptoms. Schizophrenia Research, 135(1–3), 139–143. doi: 10.1016/j.schres.2011.12.007 [DOI] [PMC free article] [PubMed] [Google Scholar]
- Peralta V, Manuel JC (1995) Negative symptoms in schizophrenia: A confirmatory factor analysis of competing models. American Journal of Psychiatry, 152(10), 1450–1457. doi: 10.1176/ajp.152.10.1450 [DOI] [PubMed] [Google Scholar]
- Peters L (2000). Discriminant validity of the Social Phobia and Anxiety Inventory (SPAI), the Social Phobia Scale (SPS) and the Social Interaction Anxiety Scale (SIAS). Behaviour Research and Therapy, 38(9), 943–950. doi: 10.1016/S0005-7967(99)00131-X [DOI] [PubMed] [Google Scholar]
- Rabinowitz, Levine, Garibaldi, Bugarski-Kirola, Berardo, & Kapur. (2012). Negative symptoms have greater impact on functioning than positive symptoms in schizophrenia: Analysis of CATIE data. Schizophrenia Research, 137(1–3), 147–150. doi: 10.1016/j.schres.2012.01.015 [DOI] [PubMed] [Google Scholar]
- Radloff L (1977). The CES-D Scale. A Self-Report Depression Scale for Research in the General Population. Applied Psychological Measurement, 1(3), 385–401. doi: 10.1177/014662167700100306. [DOI] [Google Scholar]
- Raine A (1991). The SPQ: a scale for the assessment of schizotypal personality based on DSM-III-R criteria. Schizophrenia bulletin, 17(4), 555–564. doi: 10.1093/schbul/17.4.555 [DOI] [PubMed] [Google Scholar]
- Sarkar S, Hillner K, & Velligan D (2015). Conceptualization and treatment of negative symptoms in schizophrenia. World Journal of Psychiatry, 5(4), 352–61. doi: 10.5498/wjp.v5.i4.352 [DOI] [PMC free article] [PubMed] [Google Scholar]
- Schwarz G (1978). Estimating the dimension of a model. Annals of Statistics, 6, 461–464. doi: 10.1214/aos/1176344136 [DOI] [Google Scholar]
- Selten J, Gernaat H, Nolen W, Wiersma D, & Van Den Bosch R (1998). Experience of Negative Symptoms: Comparison of Schizophrenic Patients to Patients With a Depressive Disorder and to Normal Subjects. American Journal of Psychiatry, 155(3), 350–354. doi: 10.1176/ajp.155.3.350 [DOI] [PubMed] [Google Scholar]
- Selten, Wiersma, & Van Den Bosch. (2000). Clinical predictors of discrepancy between self-ratings and examiner ratings for negative symptoms. Comprehensive Psychiatry, 41(3), 191–196. doi: 10.1016/S0010-440X(00)90047-6 [DOI] [PubMed] [Google Scholar]
- Schlosser DA, Fisher M, Gard D, Fulford D, Loewy RL, & Vinogradov S (2014). Motivational deficits in individuals at-risk for psychosis and across the course of schizophrenia. Schizophrenia Research, 158, 52–57. doi: 10.1016/j.schres.2014.06.024 [DOI] [PMC free article] [PubMed] [Google Scholar]
- Simon, Zimmermann, Cosrdeiro, Marée, Gard, Friederich, … Kaiser. (2018). Psychometric evaluation of the temporal experience of pleasure scale (TEPS) in a German sample. Psychiatry Research,260, 138–143. doi: 10.1016/j.psychres.2017.11.060 [DOI] [PubMed] [Google Scholar]
- Spielberger C, (1983). Manual for the STAI. Palo Alto, CA: Consulting psychologists press. [Google Scholar]
- Spielberger CD, Vagg PR, Barker LR, Donham GW, & Westberry LG (1980). The factor structure of the State-Trait Anxiety Inventory. Stress and anxiety, 7, (95–109). [Google Scholar]
- Strauss, Horan, Kirkpatrick, Fischer, Keller, Miski, … Carpenter. (2013). Deconstructing negative symptoms of schizophrenia: Avolition–apathy and diminished expression clusters predict clinical presentation and functional outcome. Journal of Psychiatric Research, 47(6), 783–790. [DOI] [PMC free article] [PubMed] [Google Scholar]
- Tabachnick BG, & Fidell LS (2001). Using multivariate statistics. Boston: Allyn and Bacon. [Google Scholar]
- Thompson P, & Meltzer H (1993). Positive, Negative, and Disorganisation Factors from the Schedule for Affective Disorders and Schizophrenia and the Present State Examination. British Journal of Psychiatry, 163(03), 344–351. doi: 10.1192/bjp.163.3.344 [DOI] [PubMed] [Google Scholar]
- Velicer WF (1976). Determining the number of components from the matrix of partial correlations. Psychometrika, 41, 321–327. doi: 10.1007/BF02293557. [DOI] [Google Scholar]
- Velicer WF, & Jackson DN (1990). Component analysis versus common factor-analysis - some further observations. Multivariate Behavioral Research, 25(1), 97–114. doi: 10.1207/s15327906mbr2501_12 [DOI] [PubMed] [Google Scholar]
- Velthorst, Nieman, Becker, Van de Fliert, Dingemans, Klaassen, … Linszen. (2010). Baseline differences in clinical symptomatology between ultra high risk subjects with and without transition to psychosis. Schizophrenia Research,117(2–3), 530. doi: 10.1016/j.schres.2009.02.002 [DOI] [PubMed] [Google Scholar]
- Wegener S, Redoblado-Hodge M, Lucas S, Fitzgerald D, Harris A, & Brennan J (2005). Relative Contributions of Psychiatric Symptoms and Neuropsychological Functioning to Quality of Life in First-Episode Psychosis. Australian and New Zealand Journal of Psychiatry, 39(6), 487–492. doi: 10.1080/j.1440-1614.2005.01608.x [DOI] [PubMed] [Google Scholar]
- Weng LJ, & Cheng CP (2005). Parallel analysis with unidimensional binary data. Educational and Psychological Measurement, 65(5), 697–716. doi: 10.1177/0013164404273941 [DOI] [Google Scholar]
- Werbeloff N, Dohrenwend BP, Yoffe R, van Os J, Davidson M, & Weiser M (2015). The association between negative symptoms, psychotic experiences and later schizophrenia: a population-based longitudinal study. PloS one, 10(3), e0119852. doi: 10.1371/journal.pone.0119852 [DOI] [PMC free article] [PubMed] [Google Scholar]
- Wigman JT, van Nierop M, Vollebergh WA, Lieb R, Beesdo-Baum K, Wittchen HU, & van Os J (2012). Evidence that psychotic symptoms are prevalent in disorders of anxiety and depression, impacting on illness onset, risk, and severity--implications for diagnosis and ultra-high risk research. Schizophrenia bulletin, 38(2), 247–57. doi: 10.1093/schbul/sbr196 [DOI] [PMC free article] [PubMed] [Google Scholar]
- Zhang W, O’Brien N, Forrest J, Salters K, Patterson T, Montaner J … Buch S (2012). Validating a shortened depression scale (10 Item CES-D) among HIV-positive people in British Columbia, Canada (Shortened Depression Scale). PLoS ONE, 7(7), E40793. doi: 10.1371/journal.pone.0040793 [DOI] [PMC free article] [PubMed] [Google Scholar]
- Zimmerman DW, & Williams RH (1997). Properties of the Spearman correction for attenuation for normal and realistic non-normal distributions. Applied Psychological Measurement, 21, 253–270. doi: 10.1177/01466216970213005 [DOI] [Google Scholar]
- Zwick WR, & Velicer WF (1986). Comparison of five rules for determining the number of components to retain. Psychological bulletin, 99(3), 432. doi: 10.1037/0033-2909.99.3.432 [DOI] [Google Scholar]
Associated Data
This section collects any data citations, data availability statements, or supplementary materials included in this article.