

Abstract
The ability to rapidly change gene expression patterns is essential for differentiation, development, and functioning of the brain. Throughout development, or in response to environmental stimuli, gene expression patterns are tightly regulated by the dynamic interplay between transcription activators and repressors. Nuclear receptor corepressor 1 (NCoR1) and silencing mediator for retinoid or thyroid-hormone receptors (SMRT) are the best characterized transcriptional co-repressors from a molecular point of view. They mediate epigenetic silencing of gene expression in a wide range of developmental and homeostatic processes in many tissues, including the brain. For instance, NCoR1 and SMRT regulate neuronal stem cell (NSC) proliferation and differentiation during brain development and they have been implicated in learning and memory. However, we still have a limited understanding of their regional and cell type-specific expression in the brain. In this study, we used fluorescent immunohistochemistry (IHC) to map their expression patterns throughout the adult mouse brain. Our findings reveal that NCoR1 and SMRT share an overall neuroanatomical distribution, and are detected in both excitatory and inhibitory neurons. However, we observed striking differences in their cell type-specific expression in glial cells. Specifically, all oligodendrocytes express NCoR1, but only a subset express SMRT. In addition, NCoR1, but not SMRT, was detected in a subset of astrocytes and in the microglia. These novel observations are corroborated by single cell transcriptomics and emphasize how NCoR1 and SMRT may contribute to distinct biological functions, suggesting an exclusive role of NCoR1 in innate immune responses in the brain.
Keywords: Transcriptional co-repressor, gene expression, immunohistochemistry, NCoR1, SMRT
1. INTRODUCTION
NCoR1 and SMRT are essential components of a multiprotein complex that comprise other co-repressors, such as histone deacetylases 3 (HDAC3), transducin β-like protein 1 (TBL1)/TBL1-related protein 1 (TBLR1), and G-protein pathway suppressor 2 (GPS2)(Guenther et al., 2000; J. W. Li et al., 2000; Yoon et al., 2003; J. S. Zhang, Kalkum, Chait, & Roeder, 2002). As part of this complex, they repress the transcriptional activity of nuclear receptors through a ligand-dependent or independent interaction while functioning as repressors for other sequence-specific transcription factors (TF) (Edwards, 2000; Hu & Lazar, 2000; Jepsen & Rosenfeld, 2002; Mottis, Mouchiroud, & Auwerx, 2013; Ordentlich, Downes, & Evans, 2001; Perissi, Jepsen, Glass, & Rosenfeld, 2010; Rosenfeld, Lunyak, & Glass, 2006). Their repressive activity is based on the recruitment of chromatin modifying enzymes, such as HDAC3, or their interference with recruitment of basal transcriptional machinery (Hudson, Watson, Fairall, Jamieson, & Schwabe, 2015; Stewart & Wong, 2009).
Although NCoR1 and SMRT share high level of overall amino acid sequence identity and are typically considered to operate in concert, multiple lines of evidence indicate that they also have unique biological roles (Mottis et al., 2013). For instance, they display a diversified pattern of expression in various tissues that underlie tissue-specific functions (van der Laan et al., 2005). Moreover, numerous studies document the existence of multiple splice variants, which give rise to protein variants that exert distinct, even opposing, biological roles (Faist, Short, Kneale, & Sharpe, 2009; Goodson, Jonas, & Privalsky, 2005; Goodson, Young, Snyder, Schroeder, & Privalsky, 2014; Malartre, Short, & Sharpe, 2004; Mengeling, Goodson, Bourguet, & Privalsky, 2012; Privalsky, Snyder, & Goodson, 2016). Finally, the generation of germline mutations of either NCoR1 or SMRT in mice lead to embryonic lethality, highlighting their non-redundant role in development (Hermanson, Jepsen, & Rosenfeld, 2002; Jepsen et al., 2000; Jepsen & Rosenfeld, 2002; Jepsen et al., 2007).
The characterization of total, tissue- and domain-specific knock-out (KO) mouse models highlights the involvement of NCoR1 and SMRT in various metabolic pathways (Mottis et al., 2013), such as glucose homeostasis (Astapova et al., 2008; Astapova et al., 2011; Feng, Jiang, Meltzer, & Yen, 2001; Sinha et al., 2012), energy metabolism (Yamamoto et al., 2011), lipid metabolism (P. P. Li et al., 2011; Sutanto et al., 2010), and regulation of circadian behavior (Alenghat et al., 2008). These animal models also revealed the key contribution of these transcriptional co-repressors to developmental processes. The NCoR1/SMRT complex is essential for cell lineage decisions including adipogenesis (Feng et al., 2001; P. P. Li et al., 2011; Nofsinger et al., 2008), myogenesis (Yamamoto et al., 2011) and neurogenesis (Hermanson et al., 2002; Jepsen et al., 2000). Specifically during brain development, NCoR1 and SMRT are required for NSC proliferation and differentiation, with the loss of NCoR1 leading to premature differentiation of NSC to astrocytes and oligodendrocytes (Castelo-Branco et al., 2014), and the loss of SMRT to premature differentiation to neurons and astrocytes (Hermanson et al., 2002; Jepsen et al., 2007). These findings implicate that both proteins are required for NSC self-renewal, but each co-repressor has a specific role in cell fate determination. NCoR1 specifically represses oligodendrogenesis while SMRT specifically inhibits neurogenesis. The recent development of a mouse model, characterized by the conditional deletion of NCoR1 and SMRT in GABAergic neurons, revealed that the lack of these co-repressors causes memory deficits associated with impaired hippocampal long-term potentiation through a hypothalamus-hippocampal projection (Zhou et al., 2019). Moreover, our previous work showed that the repressive activity of NCoR1 in differentiated neurons is linked to the transcriptional regulation of Reelin-dependent genes and hippocampal associative learning (Telese et al., 2015).
In summary, these studies clearly underscore the pleotropic role of NCoR1 and SMRT, and their importance for brain development and plasticity. However, a detailed map of their expression patterns in the context of different cell types of the brain has not been conducted. A previous report using in situ hybridization examined the regional distribution of NCoR1 and SMRT mRNA in the rat brain and provided evidence of their ubiquitous distribution in the brain tissue (van der Laan et al., 2005). However, understanding the cell type specificity of NCoR1 and SMRT expression may reveal important insights in their shared or unique roles in the brain. Therefore, in this study, we aimed to generate a detailed anatomical survey of NCoR1 and SMRT expression in different regions and cell types of the adult mouse brain by IHC. We found that both co-repressors are widely expressed in excitatory and inhibitory neurons; but, we observed remarkable differences in their relative expression in glial cells, including oligodendrocytes, astrocytes, and microglia. Strikingly, only NCoR1, but not SMRT, is expressed in microglia cells and astrocytes. Moreover, we compared our results with the expression of NCoR1 (Ncor1) and SMRT (Ncor2) genes in different cell types of the mouse neocortex that are defined by single-cell transcriptional signatures (Tasic et al., 2016; Tasic et al., 2018). Taken together, these findings suggest that these co-repressors may exhibit distinct physiological roles in the mature brain, and indicate that NCoR1 may be exclusively implicated in mechanisms of immune defense mediated by microglia and astrocytes in the brain.
2. METHODS
2.1. Animals
All experimental procedures were approved by the institutional animal care and use committee at University of California, San Diego. For the IHC experiments, we used 2–3 months old animals that were either wild-type C57BL/6J or Sun1-GFP-tagged transgenic mice. A total number of 16 animals were used, which included both females and males. We generated Sun1-GFP-tagged transgenic mice by crossing Sun1-GFP-floxed mice (JAX mice Stock No: 021429) with CamK2a-CRE (JAX mice Stock No:005359) or Pavlb-CRE (JAX mice Stock No:008069) transgenic mice. These transgenic lines were back-crossed to C57BL/6J mice.
2.2. Genotyping
For the generation of the Sun1-tagged lines, mice were genotyped using PCR. DNA was extracted from tail biopsies by NaOH extraction (Truett et al., 2000) and PCR was performed using OneTaq DNA Polymerase (NEB, Cat. Num. M0480) following the manufacturer’s instructions. The following forward and reverse primers were used: CRE forward: 5’- atggtttcccgcagaacctgaaga-3’; CRE reverse: 5’- gccgcataaccagtgaaacagcat- 3; Sun1–8820 (mutant reverse): 5’-gttatgtaacgcggaactcc-3’; Sun1–1615 (wild type reverse): 5’- catagt ctaactcgc gacactg-3’; Sun1–1414 (common): 5’- gcacttgctctcccaaagtc- 3’
2.3. Antibodies
The antibodies used in IHC or western blot (WB) assays are listed in Table 1.
Table 1.
List of primary antibodies used
| Target | Host species | Dilution | Catalog # | Company | RRID |
|---|---|---|---|---|---|
| NCoRl | rabbit | 1:500 (IHC) and 1:1000 (Western) | PA1–844A | Thermofisher | AB_2149004 |
| SMRT | rabbit | 1:500 (IHC) and 1:1000 (Western) | 06–891 | Millipore | 310286 |
| NeuN | guinea pig | 1:1000 | ABN90 | Millipore | AB_11205592 |
| GFP | chicken | 1:500 | A10262 | Thermofisher | AB_2534023 |
| GAD67 | mouse | 1:250 | MAB5406 | Millipore | AB_2278725 |
| VGlutl | mouse | 1:250 | MAB5502 | Millipore | AB_262185 |
| GFAP | mouse | 1:500 | 3670 | Cell Signaling | AB_561049 |
| Ibal | goat | 1:250 | ab5076 | Sigma-Aldrich | AB_2224402 |
| Olig2 | mouse | 1:250 | MABN50 | Millipore | AB_10807410 |
| GAPDH | mouse | 1:5000 | sc-32233 | Santa Cruz | AB_627679 |
2.4. Western Blot
To generate protein extracts from embryonic brain tissue, the tissue was homogenized with gentleMACS Dissociator (Miltenyi Biotec, # 130-093-235) and cells lysed using N-PER Neuronal Protein Extraction Reagent (Cat. Num. 87792, Life Technologies) following the manufacturer’s instructions. Proteins were normalized using a BCA Protein Assay Kit (Cat. Num. 23227, Life Technologies) before loading on 7% Tris-Acetate polyacrylamide gels (Cat. Num. EA03585BOX, Life Technologies). To perform denaturing gel electrophoresis, we loaded 25ug of protein extracts in each well before proteins were transferred onto PVDF membranes. The membranes were blocked in Tris Buffered Saline (TBS) with 1% (w/v) Casein (Cat. Num. 1610782, Bio-Rad Laboratories) for 1 hour at room temperature and then incubated overnight at 4°C with the primary antibodies. After washing the membranes three times in TBST (50 mM tris-HCl at pH 7.5, 150 mM NaCl, and 0.05% Tween 20) for 10 minutes each, membranes were incubated with secondary antibodies for 1 hour at room temperature. Finally, the membranes were developed by chemiluminescence using the Clarity Western ECL Substrate (Cat. Num. 1705060, Bio-Rad Laboratories) and imaged using a ChemiDoc Imaging System (Bio-Rad Laboratories).
2.5. Blocking peptide assays
For validation of the NCoR1 antibody, we used a synthetic peptide corresponding to the epitope P A P L L S A Q Y E T L S D S D D (from amino acid residue 2427 to 2443) of mouse NCoR1 protein (Cat. Num. PEP-061, Life Technologies). Before proceeding with the immunostaining or western blot (WB) protocol, the antibody was incubated with 1X excess of peptide in TBS-1% Casein overnight at 4°C. The staining and western blots were performed with two identical samples, using the neutralized antibody for one and the regular antibody solution for the other.
2.6. Immunohistochemistry
Mice were anesthetized with isoflurane and fixed via transcardial perfusion with 4% paraformaldehyde (PFA) in phosphate buffered saline (PBS). After dissection, the brain tissue was fixed in 4% PFA for 24 hr at 4°C. After a wash in PBS, the fixed tissue was placed in a sucrose solution (30% w/v in PB) for 48 hr at 4°C until tissue sinks. This tissue was embedded in O.C.T. compound (Cat. Num. 4586, Scigen), frozen on dry ice and stored at −80°C until processing. The brain tissues were sliced into 30-μm thick coronal slices using a Leica CM 1850 cryostat (Leica, Wetzlar, Germany). These free-floating sections of the cortex, striatum and hippocampus were blocked with PBS containing 0.3% Triton X-100 and 10% SuperBlock (Cat. Num. 37515, Life Technologies) followed by incubation with primary antibodies for 24 to 48h at 4°C. After the sections were rinsed with a solution of 0.3% Triton in PBS, the slices were incubated with the secondary antibodies: goat anti-rabbit Alexa Fluor 594 (1:3000, A11012, Life Technologies) or donkey anti-rabbit Alexa Fluor 488 (1:1000, A21206, Life Technologies), donkey anti-mouse Alexa Fluor 594 (1:3000, A21203, Life Technologies), and goat-anti-chicken Alexa Fluor 488 (1:1000, A11039, Life Technologies). Hoechst as a nuclear counterstain was used.
2.7. Data acquisition and data analysis of immunofluorescent images
For the analysis of the IHC staining, we acquired images using the BZ-X800 (Keyence Corporation, Osaka, Japan) or Leica TCS SPE (Leica, Wetzlar, Germany) microscopes. For the identification and annotation of brain areas, we used the mouse brain atlas Paxinos and Franklin (2001). For cell counting, we randomly selected images from +2 to −2 bregma sections for each area (cortex, striatum and hippocampus). To assess variability, we used three images from three animals, and cell counting was confirmed by two examiners. To estimate the number of cells expressing NCoR1 in the cortex and striatum, we counted the total number of Hoechst+ and NCoR1+ cells in each image, and then we calculated the fraction of Hoechst+ that were co-stained with NCoR1. To determine the number of astrocytes expressing NCoR1 and SMRT, we calculated the fraction of GFAP-positive cells that were co-stained with NCoR1 or SMRT in different brain areas. GFAP+ cells were identified as those cells showing positive staining around the nucleus. The fraction of NCoR1+ and SMRT+ astrocytes was calculated based on the overlapping signal of NCoR1 or SMRT staining inside the nucleus of GFAP+ cells. To estimate the number of oligodendrocytes or microglia expressing NCoR1 or SMRT, we calculated the fraction of NCoR1+ or SMRT+ cells that were co-stained by the Olig2 and Iba1 antibodies, respectively. All numbers are presented as mean ± S.E.M. (standard error mean).
2.8. Analysis of Single-cell RNA-seq data analysis
The analysis of NCoR1 (Ncor1) and SMRT (Ncor2) gene expression in specific cell types was conducted using an annotated data set and analytical tools that are freely accessible via the Allen Brain Atlas data portal (https://portal.brain-map.org/atlases-and-data/rnaseq). The RNA-Seq Data Navigator tool (http://celltypes.brain-map.org/rnaseq/mouse/v1-alm) was used to generate the Group Plots showing the aggregate expression level of samples categorized by cell marker genes and cell clusters derived from the analysis of the whole data set. Cell clusters (groups) are shown on the x-axis, and genes are shown on the y-axis. The size of each dot corresponds to the fraction of cells in each cell cluster that express each gene, and the color corresponds to the median expression in each group expressed as log10 of counts per million (CPM). The nomenclature of the cell clusters is described in the original publication (Tasic et al., 2018).
3. RESULTS
3.1. Neuroanatomical distribution of endogenous NCoR1 and SMRT in the mouse brain
3.1.1. Validation of NCoR1 and SMRT antibodies
To investigate the expression of NCoR1 and SMRT in the mouse brain, we used two commercial antibodies, PA1–844A (Thermofisher, RRID: AB_2149004) and 06–891 (Sigma-Aldrich, RRID: AB_310286) respectively. The NCoR1 antibody is raised against a peptide of 17 amino acids corresponding to the residues 2427 to 2443 of mouse NCoR1. This antibody has been previously used to study the interaction of NCoR1 with MeCP2 in mouse brains (Ebert et al., 2013) and in different cellular model systems (Cato et al., 2019; Legrand et al., 2019; Pascual et al., 2005; Sengupta, Peterson, Laplante, Oh, & Sabatini, 2010; Yang et al., 2017). The SMRT antibody (06–891) is raised against a GST fusion protein corresponding to a fragment of 203 amino acids (1146–1349) of human SMRT. This antibody has been previously used to study the role of SMRT in regulating neuronal activity- and estrogen-dependent gene expression programs (Sharma et al., 2019; Yang et al., 2017). To further determine the validity of the anti-NCoR1 antibody for IHC on brain tissues, we used a blocking peptide assay. The blocking peptide was comprised of the amino acid sequence corresponding to the epitope recognized by the antibody. The antibody-peptide pre-absorption was used to prevent the subsequent binding of the antibody to the target protein in the tissue slice. We compared the signal strength between samples stained with control antibody or pre-absorbed antibody with the blocking peptide. The IHC assay demonstrated the antibody specificity and showed a specific signal for NCoR1 in the nucleus, which was only visible in the samples stained with the control antibody, but not in those stained with the pre-absorbed antibody (Figure 1a). To further determine the specificity of SMRT antibodies in the absence of a peptide, we examined the immunoreactivity of the antibody in WB assays using total protein extract from embryonic brain tissue in which SMRT and NCoR1 are known to be expressed (Hermanson et al., 2002; Jepsen et al., 2000; Jepsen et al., 2007). The antibody detected a high molecular weight band with the expected size for SMRT (~270kDa) (Figure 1d). Similar results were observed for NcoR1 (Figure 1b). IHC assays also showed the expected nuclear localization for both NCoR1 (Figure 1a) and SMRT (Figure 1c). These results confirm the validity of the antibodies to study NCoR1 and SMRT by IHC.
Figure 1. Antibodies validation.

(a) NCoR1 IHC in brain tissue shows nuclear staining co-localized with DNA dye Hoechst (top panel); pre-absorption of NCoR1 antibody with excess of the blocking peptide (BP) prevents NCoR1 signal to be detected by IHC (bottom panel). Immunoreactivity of anti-NCoR1 (PA1–844A) antibody (b) and anti-SMRT #06–891 (d) antibody in protein lysates from mouse brain tissue. (c) SMRT IHC in brain tissue shows nuclear localization.
3.1.2. Region specific distribution of NCoR1 and SMRT
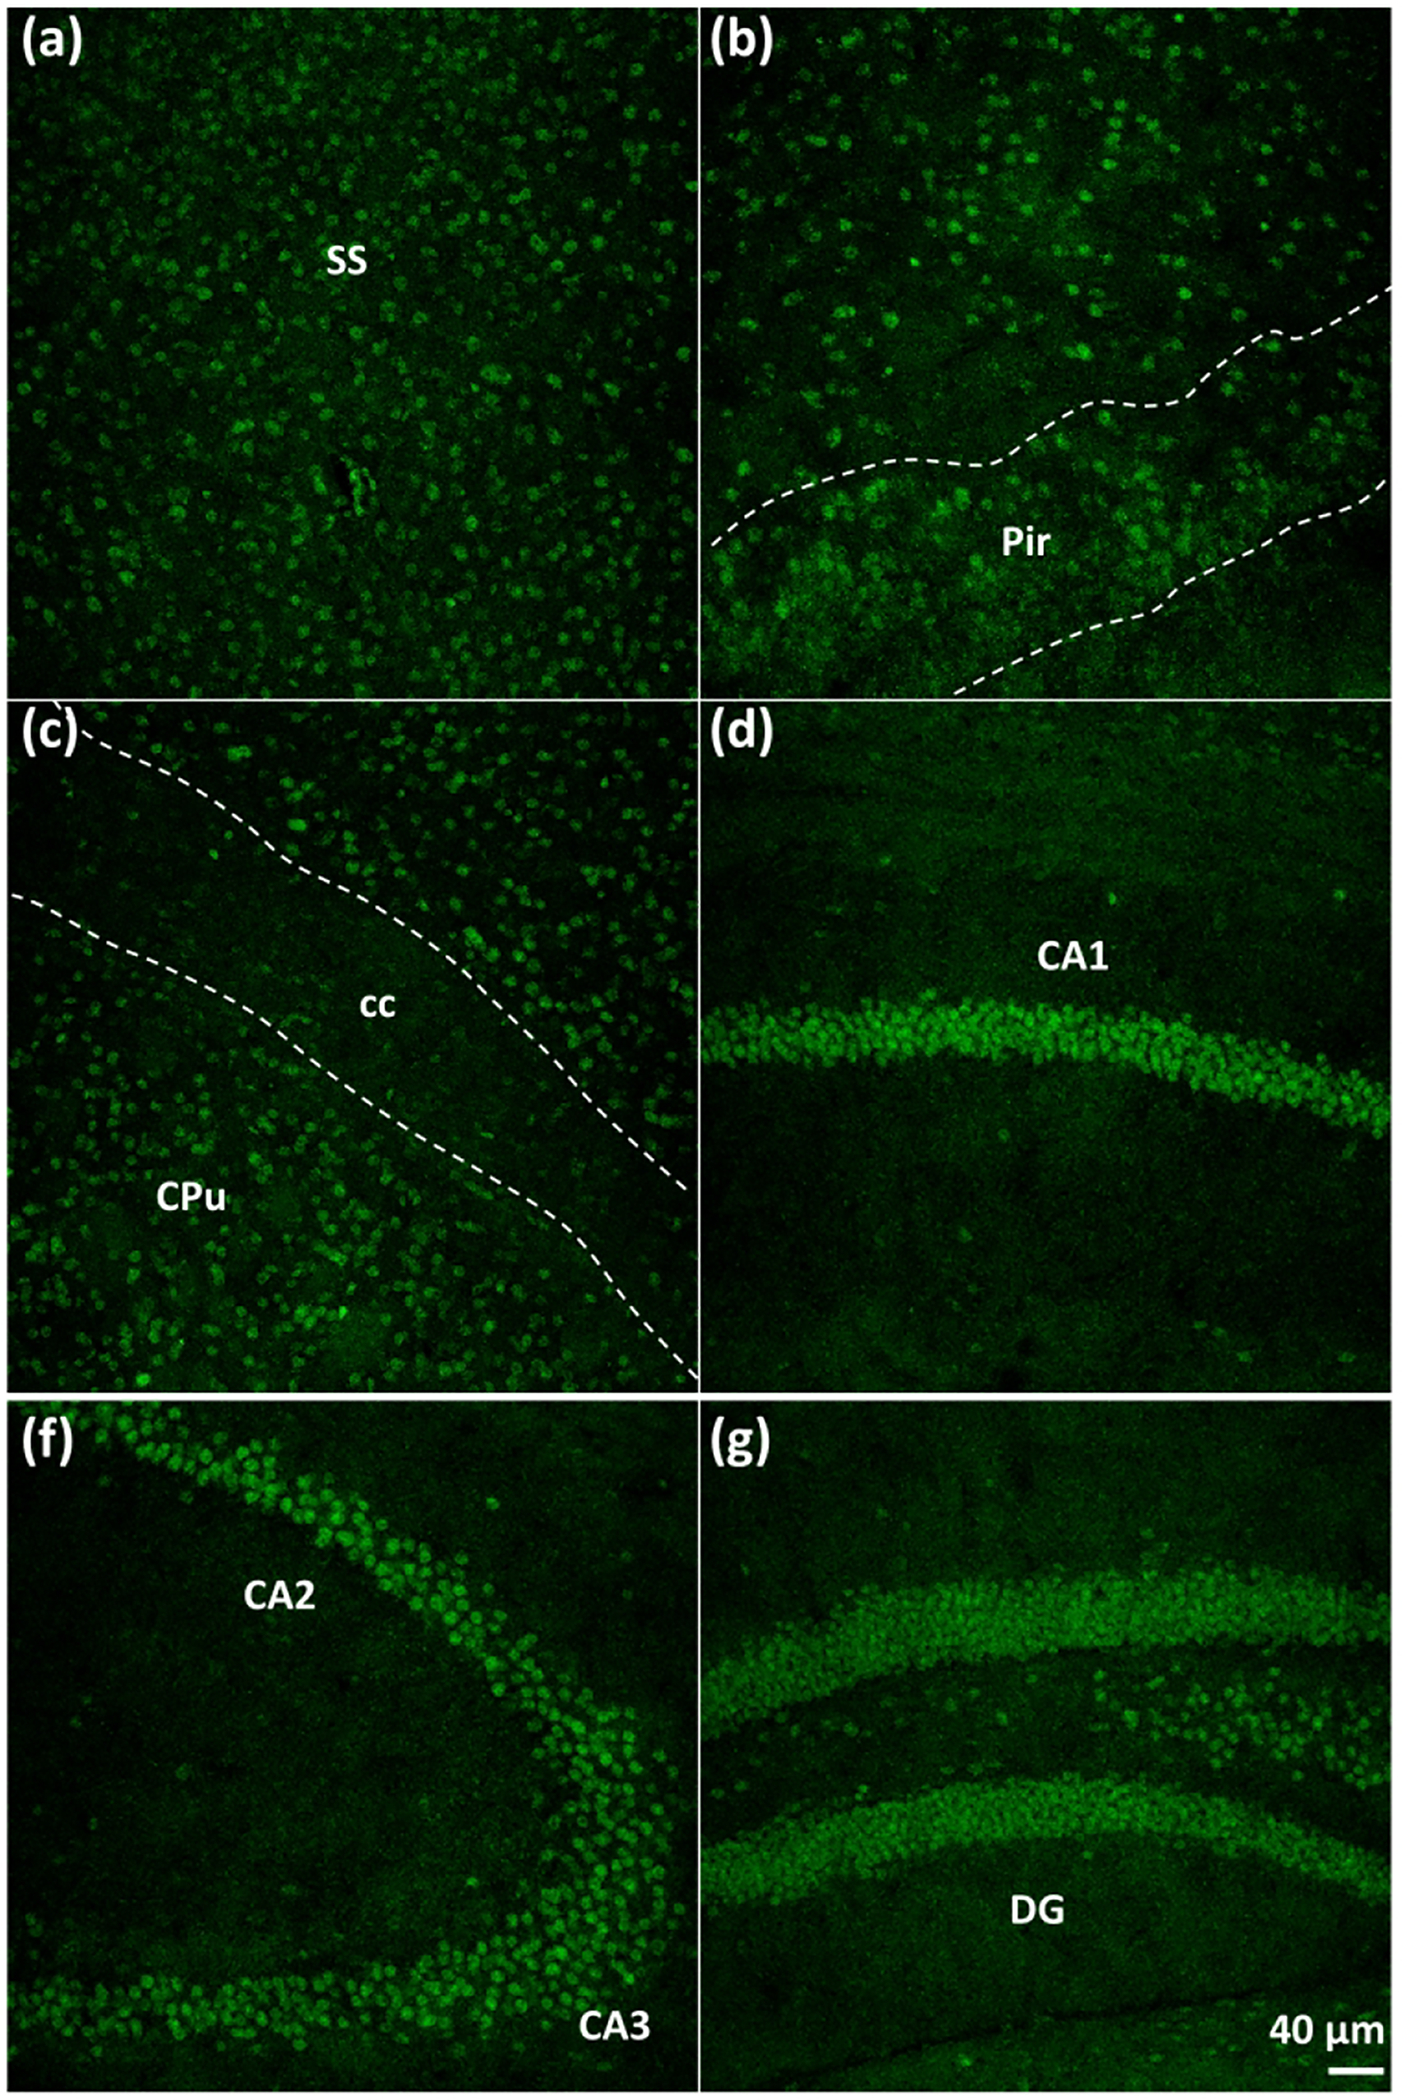
Using IHC, we detailed the localization of endogenous NCoR1 and SMRT proteins in the mouse brains. We observed that both proteins show a similar regional distribution throughout the brain (Figure 2 and Figure 3). For instance, we detected both proteins in all cortical layers of the neocortex, in the pyramidal cell layer of the piriform cortex, in all sub-regions of the hippocampus, and in the nuclei of the striatal region (Figure 2 c–j and Figure 3 a–f). To quantify the percent of brain cells that express NCoR1, we used coronal slices stained with NCoR1 antibodies that were also co-stained with Hoechst, a DNA dye that detects all cells (Figure 4a). This analysis indicates that ~ 60.94 % ± 2.44 of all cells in the neocortex and 46.49 % ± 2.65 in the striatum express NCoR1. Next, we used NeuN antibody to identify neuronal cells. This antibody recognizes the transcription factor Fox3 and is expressed exclusively in post-mitotic neurons of the central nervous system (CNS) (Gusel’nikova & Korzhevskiy, 2015). The superimposition of the NeuN+ with NCoR1+ or SMRT+ images showed that these co-repressors are widely expressed in neuronal cells in different brain regions, such as neocortex, hippocampus and striatum (Figure 4b and Figure 5).
Figure 2. Distribution of NCoR1 in different areas of the mouse brain.

(a-b) Coronal sections of mouse brain (Bregma 1.42mm to −1.94mm) stained with anti-NCoR1 antibody. (C) NCoR1 immunoreactivity in somatosensory cortex (SS); (D) piriform cortex (Pir); (E) dorsal striatum (CPu)/corpus callosum (cc); (F) ventral striatum (LV = lateral ventricle; acp = anterior commissure, posterior); (G) CA1 of the hippocampus; (H) CA2/CA3 of the hippocampus; (I) dentate gyrus (DG) of the hippocampus; (J) subthalamic nuclei (Sth).
Figure 3. Distribution of SMRT in different areas of the mouse brain.
Immunolabeling of SMRT in coronal slices of the mouse brain corresponding to (from left to right panel): somatosensory cortex (SS), piriform cortex (Pir), dorsal striatum (CPu)/corpus callosum (cc), CA1 of the hippocampus, CA2/CA3 of the hippocampus; and dentate gyrus (DG) of the hippocampus.
Figure 4. NCoR1 expression in brain cells.

(a) Representative images showing NCoR1 and Hoechst staining in brain tissue; white arrows show nuclei labeled with both staining; yellow arrows show NCoR1-negative nuclei. (b) Representative images of NCoR1 expression in neuronal cells marked by NeuN antibody in neocortex, striatum and hippocampus.
Figure 5. SMRT expression in neuronal cells.

Immunolabeling of SMRT in neocortex, striatum and hippocampus shows staining co-localized with neuronal marker NeuN.
Together these findings demonstrate that NCoR1 and SMRT share a common neuroanatomical distribution in the adult brain and are widely expressed in neuronal cells. This suggests that they may be involved in the regulation of similar neuronal functions.
3.2. Cell-type specific expression of NCoR1 and SMRT in the brain
3.2.1. Glutamatergic and GABAergic neurons
To investigate the neuronal subtype-specific cells that express NCoR1 and SMRT, we measured the expression pattern of these proteins in excitatory glutamatergic neurons and inhibitory GABAergic neurons. In the CNS, a delicate balance between excitation and inhibition dictates neuronal activity and is essential for proper functioning of neural circuits (Tatti, Haley, Swanson, Tselha, & Maffei, 2017). This balance is predominantly maintained by synaptic transmission mediated by interneurons, through the transmitter γ-aminobutyric acid (GABA), and excitatory neurons, through the transmitter glutamate. We identified glutamatergic neurons using as an antibody that recognize the vesicular glutamate transporter1 (Vglut1) (Millipore, Cat# MAB5502, RRID: AB_262185)(Blanchard et al., 2015; J. M. Li et al., 2015; Meng et al., 2019; Octeau et al., 2018). Vglut1 is a glutamate transporter that associates with membranes of synaptic vesicles of excitatory neurons and is encoded by Slc17a7 gene (Takamori, Rhee, Rosenmund, & Jahn, 2000). We examined the excitatory neurons of the hippocampus, a region enriched in glutamatergic neurons and among the regions with the highest signals for NCoR1 and SMRT. The superimposition of Vglut1+ with NCoR1+ (Figure 6a) or SMRT+ (Figure 6b) cells allowed us to visualize the widespread expression of these co-repressors in excitatory neurons. Next, we examined the expression of NCoR1 (Figure 6c) and SMRT (Figure 6d) in inhibitory neurons that were identified using an antibody against glutamate decarboxylase 67 (GAD67) (Millipore, Cat# MAB5406, RRID: AB_2278725)(Anstotz, Karsak, & Rune, 2019; Chuhma, Mingote, Moore, & Rayport, 2014; Goyer et al., 2019; Orefice et al., 2019; Tulloch, Teo, Carvajal, Tessier-Lavigne, & Jaworski, 2019). GAD67 is an enzyme that catalyzes the synthesis of GABA and encoded by Gad1 gene (Pinal & Tobin, 1998). We examined the pre-frontal cortex, in which scattered GAD67+ cells represent interneurons. We found that NCoR1 and SMRT are also expressed in GABAergic neurons. These results were further confirmed using the Sun1-tagged mice that express GFP, as a fusion protein, with Sun1, which is localized at the inner membrane in specific cell types targeted by Cre recombinase (Mo et al., 2015). Here, we crossed the Sun1-tagged mice with the Camk2a-Cre or PV-Cre transgenic mice to express the Sun1-GFP in Camk2a+ excitatory neurons or parvalbumin interneurons, respectively. This complementary approach facilitates the visualization of the nuclei in which NCoR1 and SMRT are expressed, compared to the Vglut1 and Gad67 antibody staining labeling terminals or cell bodies. Immunohistochemistry targeting GFP+ and NCoR1+ (Figure 7a and Figure 7c) or SMRT+ cells (Figure 7b and Figure 7d) confirmed that both corepressors are expressed in excitatory and inhibitory neurons.
Figure 6. NCoR1 and SMRT expression in excitatory and inhibitory neurons.

Double staining of NCoR1 (a) or SMRT (b) with Vglut1 shows NCoR1 and SMRT expression in the nuclei of glutamatergic neurons of the hippocampus. Immunolabeling of NCoR1 (c) or SMRT (d) shows staining co-localized with GAD67, a marker of GABAergic neurons in the prefrontal cortex.
Figure 7. Expression of NCoR1 and SMRT in Camk2a+ neurons and Pavlb+ neurons.

NCoR1 (a) or SMRT (b) immunoreactivity detected in gluatamatergic neurons of the hippocampus from Sun1-GFP-tagged mice that express GFP on the nuclear membrane of Camk2a+ neurons. Double staining of NCoR1 (c) or SMRT (d) with GFP in the prefrontal cortex of Sun1-GFP-tagged mice that express GFP on the nuclear membrane of parvalbumin neurons.
These results indicate that both NCoR1 and SMRT are expressed in glutamatergic and GABAergic neurons, and there is no preferential expression of these co-repressors in a specific neuronal population.
3.2.2. Astrocytes
During brain development, genetic deletions of either NCoR1 and SMRT in mice induce spontaneous differentiation to astrocytes (Hermanson et al., 2002; Jepsen et al., 2007). In the CNS, astrocytes exert a wide range of complex functions to support and repair the nervous tissue (Sofroniew & Vinters, 2010). However, the potential role of these co-repressors in mature astrocytes remains uncharacterized. We examined the expression of NCoR1 and SMRT in astrocytes using an antibody that recognizes glial fibrillary acidic protein (GFAP) (Cell Signaling Technologies, Cat#3670, RRID: AB_561049)(Alvarez-Arellano et al., 2018; Lee, Martinez-Lozada, Krizman, & Robinson, 2017; Leng et al., 2018; Murru et al., 2019; Xiong et al., 2019; S. B. Zhang et al., 2019). GFAP is the main astrocytic intermediate filament that is expressed at low level in the quiescent state and at high level in the reactive state of astrocytes (Eng, Ghirnikar, & Lee, 2000; Jacque et al., 1978). We examined the expression of NCoR1 and SMRT in GFAP+ cells detected in brain regions of the corpus callosum, a white matter structure in the brain, and the hippocampus. Using a low magnification (20x), we observed that areas with the highest density of NCoR1/SMRT+ cells did not correspond with those showing the highest density of GFAP+ cells (Figure 8a and 9a), suggesting that NCoR1/SMRT expression is mainly restricted in structures enriched in neuronal cell bodies. Imaging at a higher magnification permitted a more detailed analysis of NCoR1 and SMRT expression in GFAP+ cells (Figure 8b–c and 9b–c). It should be noted that the anti-GFAP antibody stains cellular processes, but not nuclei. Thus, overlapping of GFAP signal with Hoechst or NCoR1/SMRT does not result in a color transformation. We found that a small subset of GFAP+ astrocytes show positive immunoreactivity for NCoR1 (27.8% in the HP and 9.9% in the corpus callosum, see Table 2) whereas SMRT does not. However, we observed lower intensity compared to neuronal staining of NCoR1, suggesting a low level of expression of this protein in GFAP+ cells.
Figure 8. NCoR1 expression in GFAP+ astrocytes.
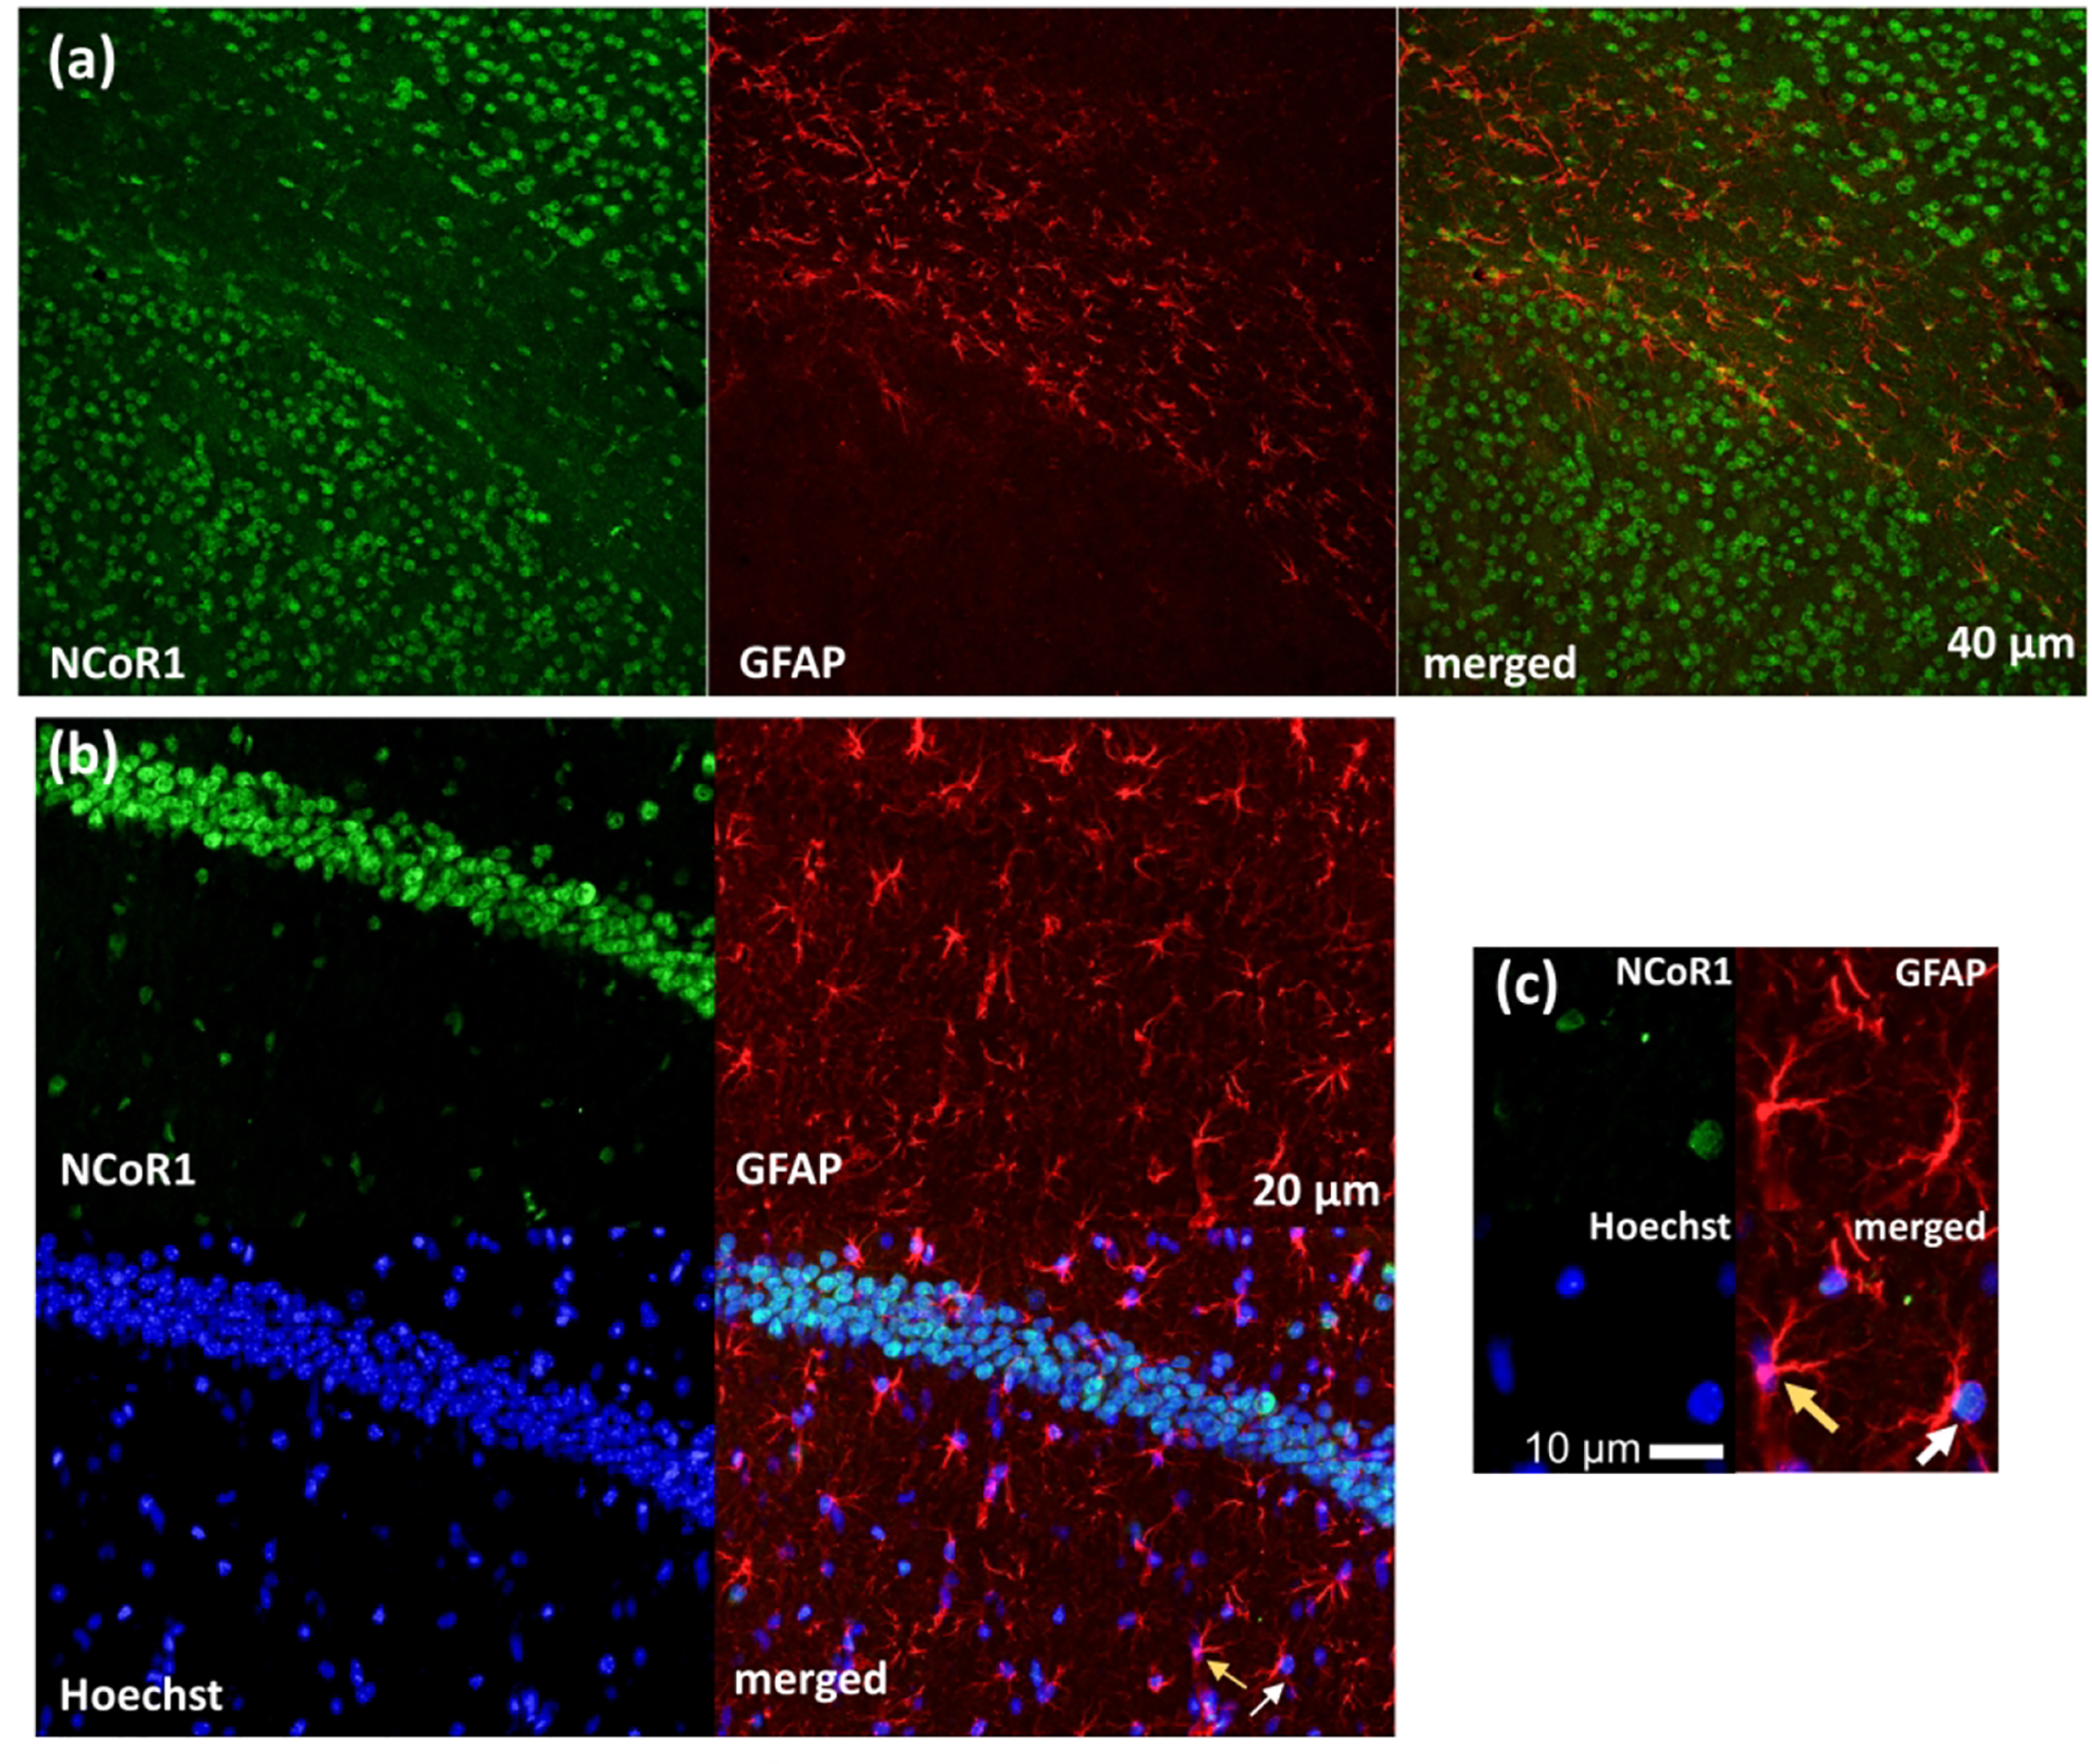
IHC assays show co-localization of NCoR1 in GFAP+ astrocytes of the corpus callosum (a) and hippocampus (b). Magnified images (c) show NCoR1 nuclear staining in GFAP+ cells (white arrows), whereas yellow arrows indicate GFAP+ cells that do not express NCoR1.
Figure 9. SMRT expression in GFAP+ astrocytes.

IHC assays show co-localization of SMRT (a,b) in GFAP+ astrocytes of the corpus callosum (a) and hippocampus (b). Magnified images (c) show lack of SMRT nuclear staining in GFAP+ cells (yellow arrow).
Table 2.
Fraction (%) of non-neuronal cells expressing NcoR1 and SMR
| Gene Target | Brain Area | Cell Marker | ||
|---|---|---|---|---|
| GFAP | Iba1 | Olig2 | ||
| NCoRl | Neocortex | ND | 80.12 ± 5.71 | 100 ± 0 |
| Callosum | 9.92 ± 4.30 | ND | ND | |
| Striatum | ND | 74.69 ± 6.76 | 100 ± 0 | |
| Hippocampus | 27.84 ± 7.80 | 95.71 ± 1.50 | 100 ± 0 | |
| SMRT | Neocortex | ND | 0.00 ± 0.00 | 48.32 ± 6.98 |
| Callosum | 0.00 ± 0.00 | ND | ND | |
| Striatum | ND | 0.00 ± 0.00 | 55.73 ± 7.40 | |
| Hippocampus | 0.00 ± 0.00 | 0.00 ± 0.00 | 46.87 ± 8.57 | |
Note: The numbers represent Mean ± S.E.M. Abbreviations: ND= not detected
Taken together, these findings show that NCoR1 is expressed in GFAP+ astrocytes at low or undetectable levels, and in restricted subsets of GFAP+ cells.
3.2.3. Oligodendrocytes
NSC isolated from NCoR1 KO mice prematurely differentiate in oligodendrocytes (Castelo-Branco et al., 2014). This suggests a role of NCoR1 in the repression of oligodendrogenesis in the developing brain. Oligodendrocyte precursor cells (OPC) differentiate to non-myelinating immature oligodendrocytes, which, in turn, differentiate to mature myelinating cells. In the adult CNS, a population of oligodendrocyte precursor cells (OPC) persist in the gray and white matter, and are thought to give rise to mature oligodendrocytes in the injured brain. However, whether or not the NCoR1-SMRT complex is expressed in oligodendrocytes of the adult brain has not been reported. We examined brain sections from cortex, hippocampus and striatum to detect the expression of NCoR1 (Figure 10a and Figure 12a) and SMRT (Figure 11a and Figure 13a) in oligodendrocytes, which were identified using an antibody against oligodendrocyte transcription factor 2 (Olig2) (Millipore, Cat# MABN50, RRID: AB_10807410)(Bonnefil et al., 2019; Butti et al., 2019; Dimas et al., 2019; Nellessen et al., 2019). Olig2 is a basic helix-loop-helix TF directly involved in the lineage determination of oligodendrocytes (Takebayashi et al., 2002; Tekki-Kessaris et al., 2001) and it is widely used as cellular marker of progenitors, immature and mature (myelinating) oligodendrocytes (Yokoo et al., 2004).
Figure 10. NCoR1 and SMRT expression in oligodendrocytes.

IHC assays show co-localization of NCoR1 (a) and SMRT (b) in striatal Olig2-positive cells (white arrows); yellow arrow shows a SMRT-negative oligodendrocyte. Magnified images are shown on the right.
Figure 12. Expression of NCoR1 in oligodendrocytes and microglia.

Double staining of NCoR1 and Olig2 (a) or Iba1 (b) in neocortex, striatum, and hippocampus; white arrows indicate co-labeling; yellow arrow indicates lack of co-localization.
Figure 11. NCoR1 and SMRT expression in microglia.

IHC assays show immunolabeling of NCoR1 (a) and SMRT (b) in hippocampal Iba1+ microglia; white arrow indicates co-labeling; yellow arrows indicate lack of co-localization. Magnified images are shown on the right.
Figure 13. Expression of SMRT in oligodendrocytes and microglia.

Double staining of NCoR1 and Olig2 (a) or Iba1 (b) in neocortex, striatum, and hippocampus; white arrows indicate co-labeling; yellow arrows indicate lack of co-localization.
We found that all oligodendrocytes express NCoR1 (Figure 10a and Table 2), but only a subset expresses SMRT (~47–57%, Figure 10b and Table 2). These findings suggest that NCoR1 and SMRT may play distinct roles in functionally different subsets of oligodendrocytes with important implications for how myelination is controlled. Myelination is a critical process that ensures the insulation of neuronal axons in the brain and spinal cord and provides a mechanism to optimize action potential and neural transmission (Simons & Nave, 2015; van Tilborg et al., 2018).
3.2.3. Microglia
Microglia are immune cells that account for 5–20% of the total glial cell population within the CNS, and are highly similar to peripheral macrophages (Ginhoux, Lim, Hoeffel, Low, & Huber, 2013; Schafer & Stevens, 2015). Microglial functions can be activated by pathogens and injury. In their activated state, microglia change morphology, proliferate, and migrate to the infected or injured site, where they direct the immune response by secreting cytokines, and phagocytose pathogens and damaged cells (Colonna & Butovsky, 2017). Moreover, they have also been implicated in the maintenance of brain homeostasis (Greter & Merad, 2013; Nayak, Roth, & McGavern, 2014). A role for NCoR1 and SMRT in the repression of inflammatory response gene expression has been established in macrophages (Ghisletti et al., 2009; P. Li et al., 2013; Ogawa et al., 2004). Intriguingly, NCoR1 and SMRT have a non-redundant effect on transcriptional control of inflammation depending on the specific inflammatory stimulus (Fan et al., 2016; Ghisletti et al., 2009). However, the contribution of NCoR1 or SMRT to microglia function in brain development and plasticity has not been explored. We examined the expression of NCoR1 and SMRT in microglia that were identified by an antibody against Iba1 (Sigma-Aldrich, Cat# ab5076, RRID: AB_2224402)(Gonzalez Fleitas et al., 2019; Kalambogias et al., 2019; Matsuda et al., 2019; VanRyzin et al., 2019; S. B. Zhang et al., 2019) (Ito et al., 1998), a member of the calcium-binding group of proteins that is specifically expressed in microglia (Imai, Ibata, Ito, Ohsawa, & Kohsaka, 1996). Tissue sections corresponding to the cortex, hippocampus, and striatum were co-stained with anti-Iba1 antibody and anti-NCoR1 (Figure 11a and Figure 12b) or anti-SMRT antibodies (Figure 11b and Figure 13b). Surprisingly, we found that NCoR1 is expressed in most Iba1+ cells (~75–95%, see Table 2), whereas SMRT is not expressed in this cell-type (see Table 2).
In summary, these results indicate that NCoR1, but not SMRT, might play a critical role in the regulation of inflammatory pathways in the brain.
3.3. Expression of NCoR1 and SMRT in transcriptomic cell-types across the mouse neocortex
Recently, large-scale single-cell transcriptomic studies provided a comprehensive taxonomy of cell types in the brain based on gene expressed in individual cells of discrete areas of the brain (Ecker et al., 2017; Poulin, Tasic, Hjerling-Leffler, Trimarchi, & Awatramani, 2016; Zeisel et al., 2015; Zeng & Sanes, 2017). To examine the expression of NCoR1 (Ncor1) and SMRT (Ncor2) transcripts in individual cells of the mouse brain, we leveraged freely available data collected from nearly ~75,000 single cells isolated from >20 areas of mouse cortex and hippocampus of adult mice (https://portal.brain-map.org/atlases-and-data/rnaseq). This data has been used to quantify diversity of cell types in mouse primary visual cortex (VISp) (Tasic et al., 2016) and anterior lateral motor cortex (ALM) (Tasic et al., 2018) identifying133 transcriptomic cell clusters. We analyzed the expression of NCoR1 and SMRT across all annotated cell clusters, including more than 100 neuronal and more than 10 non-neuronal putative cell types. We focused on the major classes (Figure 14a) and subclasses (Figure 14b–c) categorized using known cell marker, including Slc17a7 for glutamatergic neurons, Gad2 for GABAergic neurons, Aqp4 for astrocytes, Olig2 for different subclasses of oligodendrocytes, and Ctss for microglia. The analysis of the aggregated expression level of Ncor1 and Ncor2 across different classes or subclasses reveals that there are major differences in their patterns of expression (Figure 14a–c). The analysis of the main classes (glutamatergic, GABAergic and non-neuronal) shows that Ncor1 is expressed in the majority of cell types with the lowest expression levels in GABAergic neurons, but Ncor2 is expressed mostly in neuronal cells and in a small fraction of non-neuronal cells. (Figure 14a). Because the single cell transcriptomic analysis provides a higher resolution of cell type categorization, we also analyzed the relative expression of Ncor1 and Ncor2 transcripts in subclasses of neurons (Figure 14b) and glial cells (Figure 14c). Although Ncor1 is expressed at high levels in glutamatergic neurons (Figure 14a), we observed a specific pattern of expression across different subclasses of excitatory neurons with high expression restricted to neurons from layers 2 to 4 (Figure 14b). Conversely, Ncor2 is broadly expressed in glutamatergic neurons from layers 2 to 6, but displays a heterogeneous pattern of expression in GABAergic neurons with highest expression levels detected in parvalbumin (Pvalb) and somatostatin (Sst) types (Figure 14b). Next, we examined the distribution of Ncor1 and Ncor2 in subclasses of glial cells, including Aqp4+ astrocytes, three classes of Olig2+ oligodendrocytes and Ctss+ microglia. Ncor1 is expressed in most glial cells with lowest expression in a fraction of microglia (Figure 14c). Ncor2 is expressed at high levels in in two subclasses of oligodendrocytes, but is almost undetectable in astrocytes and microglia (Figure 14c). Overall, the distribution of transcript levels across cell types is consistent with the protein levels, but the transcriptomic analysis reveals a finer mapping of Ncor1 and Ncor2 transcriptional expression and provides novel information about the specific groups of cells expressing these co-repressors and the relative abundance in each cell cluster.
Figure 14. Ncor1 and Ncor2 expression in transcriptomic cell clusters.

Group plots show the aggregated expression level of genes (y-axis) in samples grouped by annotations assigned by the RNAseq data navigator (http://celltypes.brain-map.org/rnaseq/mouse/v1-alm) for main classes of Glutamatergic, GABAergic and non-neuronal cells (a), and subclasses of neuronal (b) or non-neuronal (c) cell types. The size of each point corresponds to the fraction of cells in each group that have expression of each gene, and the color corresponds to the median expression in each group.
4. DISCUSSION
This study provides the first comprehensive map of NCoR1 and SMRT proteins across multiple regions of the adult mouse brain by IHC. Consistent with a previous study that documented the mRNA expression of these two proteins (van der Laan et al., 2005) and with the analysis of single-cell transcriptomics of the mouse neocortex, we found evidence for the widespread expression of NCoR1 and SMRT throughout the brain with the highest expression levels in multiple forebrain regions.
Our detailed expression analysis revealed that both co-repressors are detected in neuronal cells. The IHC survey of the main glutamatergic and GABAergic classes shows that both corepressors are detected in excitatory and inhibitory neurons. However, the detailed transcriptomic analysis of distinct neuronal subclasses shows that both corepressors display different magnitude of expression in defined classes of neurons. This suggests that NCoR1 and SMRT may have distinct roles in specific neuronal subtypes. Conditional deletion of NCoR1 and SMRT genes in GABAergic neurons in mice is sufficient to cause learning memory deficits observed in novel object recognition test and the Morris water maze (Zhou et al., 2019). Similar results were observed in whole-body knock-in mouse models that express mutated deacetylase activation domains of NCoR1 and SMRT (Zhou et al., 2019). These findings do not exclude that the loss of function of NCoR1/SMRT complex in other brain cell types that may contribute to the cognitive deficits observed in DAD mutants. Further studies addressing the role of NCoR1 and SMRT in excitatory neurons or non-neuronal cells are required. These studies are relevant to human disorders as de novo variants in the genes encoding NCoR1 and SMRT have been identified in patients with intellectual disabilities and neurodevelopmental disorders (Zhou et al., 2019). Analogously, other components of this corepressor complex, such as HDAC3 and TBLR1 have been associated with neurodevelopmental and neurocognitive disorders (Kruusvee et al., 2017; Zhou et al., 2019). It is noteworthy that NCoR1 and SMRT can also interact with MeCP2 (methylated CpG binding protein 2) (Ebert et al., 2013; Lyst et al., 2013), a protein mutated in Rett syndrome, an X-linked autism spectrum disorder (Zoghbi et al., 2000). Importantly, most amino acids in the NCoR1/SMRT interaction domain cause RTT syndrome when mutated (Lyst et al., 2013). The functional role of NCoR1 and SMRT in the brain will need to be explored in future studies to better understand how loss of function of these co-repressors impacts different brain functions.
Next, we identified the relative abundance of NCoR1 and SMRT in non-neuronal cells. The characterization of the null NCoR1 and SMRT mice provided strong evidence of the critical role of these co-repressors in the differentiation of NSC in neuronal or glial lineages (Hermanson et al., 2002; Jepsen et al., 2007). In this study, we examined whether mature GFAP+ astrocytes express NCoR1/SMRT, and we observed low or undetectable levels of these proteins, consistent with the observation that NSC deficient for either protein prematurely differentiate in astrocytes. Specifically, no GFAP+ cells were co-labeled with SMRT and only ~10–30% GFAP+ cells showed also immunoreactivity for NCoR1, suggesting that only subsets of GFAP+ astrocytes might express this protein in the adult brain. However, a higher fraction of Aqp4+ cells express Ncor1 transcript. Several studies demonstrated that only a fraction of astrocytes express GFAP in the mature brain and there is a great heterogeneity of astrocytes across different brain regions (Farmer & Murai, 2017). This diversity is reflected in differences in they morphology, spatial distribution, gene expression patterns and functional properties. It would be important for future studies to determine whether the NCoR1 protein is expressed in other classes of astrocytes, as suggested by the transcriptomic analysis. It should be noted that major challenges remain when imaging astrocytes in thick tissue, especially with antibodies that recognize cellular processes (e.g. anti-GFAP antibodies). This is due to the complex morphology and large size of astrocytes. Volumetric analysis by high-resolution microscopy estimated that astrocytes in mouse cortex and hippocampus span over 23,000um3 and are organized in non-overlapping territories (Bushong, Martone, Jones, & Ellisman, 2002; Halassa, Fellin, Takano, Dong, & Haydon, 2007). These morphological features render the observation of their entire structure more challenging; and identifying nuclei of astrocytes stained by anti-GFAP antibodies remains a challenge. In addition, subpopulations of GFAP+ astrocytes have been identified as bona fide neural stem cells in the subventricular zone of the lateral ventricle and in the subgranular zone of the dentate gyrus of the adult mammalian brain (Denise et al., 2004; Doetsch, Caille, Lim, Garcia-Verdugo, & Alvarez-Buylla, 1999; Doetsch, Garcia-Verdugo, & Alvarez-Buylla, 1999). Further studies using additional markers of astrocytes and neural stem cells are required to address the heterogeneity of the astrocytes and better identity the subset that express NCoR1.
We also investigated the region- and cell type-specific expression of NCoR1 and SMRT in oligodendrocytes. A previous study reported that the loss of NCoR1 in NSC leads to premature oligodendrocyte differentiation. We found that both co-repressors are expressed in Olig2+ cells. Specifically, NCoR1 was detected in nearly all Olig2+ cells, whereas SMRT was only detectable in ~50% of oligodendrocytes. These results are supported by the single-cell transcriptional analysis, which identifies three subclasses of oligodendrocytes based on transcriptomic signatures (Tasic et al., 2018). Olig2 is a sonic hedgehog-responsible basic bHLH (helix-loop-helix) TF that functions as an oligodendrocyte lineage-specific transcription factors during brain development, and it is also expressed throughout the CNS after development in precursors, immature (non-myelinating) and mature (myelinating) oligodendrocytes (van Tilborg et al., 2018). Additional research is needed to determine the functional properties of different transcriptomic subclasses of oligodendrocytes. A challenge remains in identifying specific cell markers that can label the cell body of different subclasses of oligodendrocytes.
Finally, we examined the expression of NCoR1 and SMRT in microglia cells identified by Iba1. Strikingly, only NCoR1 was detected in this population of cells, but not SMRT. This result is corroborated by the transcriptomic analysis and suggests that NCoR1 might have a specific role in the immune responses mediated by microglia in the brain.
In sum, we provided a detailed characterization of the cell type-specific expression of NCoR1 and SMRT in the adult mouse brain. Our results reveal that these two co-repressors exhibit a cell type-specific expression in different cell types of the brain. Considering that targeting NCoR1 and SMRT in NSC or inhibitory neurons revealed their critical role in cell fate determination and memory formation, our findings might serve as foundation for future studies targeting NCoR1 and/or SMRT in different cell types, which might reveal their important contribution to other signaling pathways, including neuroinflammation.
Table 3.
Fraction (%) of non-neuronal cells expressing NcoR1 and SMR
| Gene Target | Brain Area | Cell Marker | ||
|---|---|---|---|---|
| GFAP | Iba1 | Olig2 | ||
| NCoRl | Neocortex | ND | 80.12 ± 5.71 | 100 ± 0 |
| Callosum | 9.92 ± 4.30 | ND | ND | |
| Striatum | ND | 74.69 ± 6.76 | 100 ± 0 | |
| Hippocampus | 27.84 ± 7.80 | 95.71 ± 1.50 | 100 ± 0 | |
| SMRT | Neocortex | ND | 0.00 ± 0.00 | 48.32 ± 6.98 |
| Callosum | 0.00 ± 0.00 | ND | ND | |
| Striatum | ND | 0.00 ± 0.00 | 55.73 ± 7.40 | |
| Hippocampus | 0.00 ± 0.00 | 0.00 ± 0.00 | 46.87 ± 8.57 | |
Note: The numbers represent Mean ± S.E.M. Abbreviations: ND= not detected
ACKNOWLEDGMENTS
We thank Dr. Dorota Skowronska-Krawczyk and Alex Lee for technical assistance with the use of the Keyence microscope. Graphical abstract was created with BioRender.
Footnotes
DATA AVAILABILITY STATEMENT
The data that supports the findings of this study are available from the corresponding author upon reasonable request.
REFERENCES
- Alenghat T, Meyers K, Mullican SE, Leitner K, Adeniji-Adele A, Avila J, … Lazar MA (2008). Nuclear receptor corepressor and histone deacetylase 3 govern circadian metabolic physiology. Nature, 456(7224), 997–1000. doi: 10.1038/nature07541 [DOI] [PMC free article] [PubMed] [Google Scholar]
- Alvarez-Arellano L, Pedraza-Escalona M, Blanco-Ayala T, Camacho-Concha N, Cortes-Mendoza J, Perez-Martinez L, & Pedraza-Alva G (2018). Autophagy impairment by caspase-1-dependent inflammation mediates memory loss in response to beta-Amyloid peptide accumulation. J Neurosci Res, 96(2), 234–246. doi: 10.1002/jnr.24130 [DOI] [PubMed] [Google Scholar]
- Anstotz M, Karsak M, & Rune GM (2019). Integrity of Cajal-Retzius cells in the reeler-mouse hippocampus. Hippocampus, 29(6), 550–565. doi: 10.1002/hipo.23049 [DOI] [PubMed] [Google Scholar]
- Astapova I, Lee LJ, Morales C, Tauber S, Bilban M, & Hollenberg AN (2008). The nuclear corepressor, NCoR, regulates thyroid hormone action in vivo. Proc Natl Acad Sci U S A, 105(49), 19544–19549. doi: 10.1073/pnas.0804604105 [DOI] [PMC free article] [PubMed] [Google Scholar]
- Astapova I, Vella KR, Ramadoss P, Holtz KA, Rodwin BA, Liao XH, … Hollenberg AN (2011). The nuclear receptor corepressor (NCoR) controls thyroid hormone sensitivity and the set point of the hypothalamic-pituitary-thyroid axis. Mol Endocrinol, 25(2), 212–224. doi: 10.1210/me.2010-0462 [DOI] [PMC free article] [PubMed] [Google Scholar]
- Blanchard JW, Eade KT, Szucs A, Lo Sardo V, Tsunemoto RK, Williams D, … Baldwin KK (2015). Selective conversion of fibroblasts into peripheral sensory neurons. Nature Neuroscience, 18(1), 25-+. doi: 10.1038/nn.3887 [DOI] [PMC free article] [PubMed] [Google Scholar]
- Bonnefil V, Dietz K, Amatruda M, Wentling M, Aubry AV, Dupree JL, … Liu J (2019). Region-specific myelin differences define behavioral consequences of chronic social defeat stress in mice. Elife, 8. doi: 10.7554/eLife.40855 [DOI] [PMC free article] [PubMed] [Google Scholar]
- Bushong EA, Martone ME, Jones YZ, & Ellisman MH (2002). Protoplasmic astrocytes in CA1 stratum radiatum occupy separate anatomical domains. Journal of Neuroscience, 22(1), 183–192. doi:Doi 10.1523/Jneurosci.22-01-00183.2002 [DOI] [PMC free article] [PubMed] [Google Scholar]
- Butti E, Bacigaluppi M, Chaabane L, Ruffini F, Brambilla E, Berera G, … Martino G (2019). Neural Stem Cells of the Subventricular Zone Contribute to Neuroprotection of the Corpus Callosum after Cuprizone-Induced Demyelination. Journal of Neuroscience, 39(28), 5481–5492. doi: 10.1523/Jneurosci.0227-18.2019 [DOI] [PMC free article] [PubMed] [Google Scholar]
- Castelo-Branco G, Lilja T, Wallenborg K, Falcao AM, Marques SC, Gracias A, … Hermanson O (2014). Neural Stem Cell Differentiation Is Dictated by Distinct Actions of Nuclear Receptor Corepressors and Histone Deacetylases. Stem Cell Reports, 3(3), 502–515. doi: 10.1016/j.stemcr.2014.07.008 [DOI] [PMC free article] [PubMed] [Google Scholar]
- Cato L, de Tribolet-Hardy J, Lee I, Rottenberg JT, Coleman I, Melchers D, … Brown M (2019). ARv7 Represses Tumor-Suppressor Genes in Castration-Resistant Prostate Cancer. Cancer Cell, 35(3), 401–413 e406. doi: 10.1016/j.ccell.2019.01.008 [DOI] [PMC free article] [PubMed] [Google Scholar]
- Chuhma N, Mingote S, Moore H, & Rayport S (2014). Dopamine Neurons Control Striatal Cholinergic Neurons via Regionally Heterogeneous Dopamine and Glutamate Signaling. Neuron, 81(4), 901–912. doi: 10.1016/j.neuron.2013.12.027 [DOI] [PMC free article] [PubMed] [Google Scholar]
- Colonna M, & Butovsky O (2017). Microglia Function in the Central Nervous System During Health and Neurodegeneration. Annu Rev Immunol, 35, 441–468. doi: 10.1146/annurev-immunol-051116-052358 [DOI] [PMC free article] [PubMed] [Google Scholar]
- Denise A, Garcia R, Doan NB, Imura T, Bush TG, & Sofroniew MV (2004). GFAP-expressing progenitors are the principal source of constitutive neurogenesis in adult mouse forebrain. Nature Neuroscience, 7(11), 1233–1241. doi: 10.1038/nn1340 [DOI] [PubMed] [Google Scholar]
- Dimas P, Montani L, Pereira JA, Moreno D, Trotzmuller M, Gerber J, … Suter U (2019). CNS myelination and remyelination depend on fatty acid synthesis by oligodendrocytes. Elife, 8. doi: 10.7554/eLife.44702 [DOI] [PMC free article] [PubMed] [Google Scholar]
- Doetsch F, Caille I, Lim DA, Garcia-Verdugo JM, & Alvarez-Buylla A (1999). Subventricular zone astrocytes are neural stem cells in the adult mammalian brain. Cell, 97(6), 703–716. doi:Doi 10.1016/S0092-8674(00)80783-7 [DOI] [PubMed] [Google Scholar]
- Doetsch F, Garcia-Verdugo JM, & Alvarez-Buylla A (1999). Regeneration of a germinal layer in the adult mammalian brain. Proceedings of the National Academy of Sciences of the United States of America, 96(20), 11619–11624. doi:DOI 10.1073/pnas.96.20.11619 [DOI] [PMC free article] [PubMed] [Google Scholar]
- Ebert DH, Gabel HW, Robinson ND, Kastan NR, Hu LS, Cohen S, … Greenberg ME (2013). Activity-dependent phosphorylation of MeCP2 threonine 308 regulates interaction with NCoR. Nature, 499(7458), 341–U116. doi: 10.1038/nature12348 [DOI] [PMC free article] [PubMed] [Google Scholar]
- Ecker JR, Geschwind DH, Kriegstein AR, Ngai J, Osten P, Polioudakis D, … Zeng H (2017). The BRAIN Initiative Cell Census Consortium: Lessons Learned toward Generating a Comprehensive Brain Cell Atlas. Neuron, 96(3), 542–557. doi: 10.1016/j.neuron.2017.10.007 [DOI] [PMC free article] [PubMed] [Google Scholar]
- Edwards DP (2000). The role of coactivators and corepressors in the biology and mechanism of action of steroid hormone receptors. J Mammary Gland Biol Neoplasia, 5(3), 307–324. [DOI] [PubMed] [Google Scholar]
- Eng LF, Ghirnikar RS, & Lee YL (2000). Glial fibrillary acidic protein: GFAP-thirty-one years (1969–2000). Neurochem Res, 25(9–10), 1439–1451. [DOI] [PubMed] [Google Scholar]
- Faist F, Short S, Kneale GG, & Sharpe CR (2009). Alternative splicing determines the interaction of SMRT isoforms with nuclear receptor-DNA complexes. Biosci Rep, 29(3), 143–149. doi: 10.1042/BSR20080093 [DOI] [PubMed] [Google Scholar]
- Fan R, Toubal A, Goni S, Drareni K, Huang Z, Alzaid F, … Treuter E (2016). Loss of the co-repressor GPS2 sensitizes macrophage activation upon metabolic stress induced by obesity and type 2 diabetes. Nat Med, 22(7), 780–791. doi: 10.1038/nm.4114 [DOI] [PubMed] [Google Scholar]
- Farmer WT, & Murai K (2017). Resolving Astrocyte Heterogeneity in the CNS. Front Cell Neurosci, 11, 300. doi: 10.3389/fncel.2017.00300 [DOI] [PMC free article] [PubMed] [Google Scholar]
- Feng X, Jiang Y, Meltzer P, & Yen PM (2001). Transgenic targeting of a dominant negative corepressor to liver blocks basal repression by thyroid hormone receptor and increases cell proliferation. Journal of Biological Chemistry, 276(18), 15066–15072. [DOI] [PubMed] [Google Scholar]
- Ghisletti S, Huang W, Jepsen K, Benner C, Hardiman G, Rosenfeld MG, & Glass CK (2009). Cooperative NCoR/SMRT interactions establish a corepressor-based strategy for integration of inflammatory and anti-inflammatory signaling pathways. Genes Dev, 23(6), 681–693. doi: 10.1101/gad.1773109 [DOI] [PMC free article] [PubMed] [Google Scholar]
- Ginhoux F, Lim S, Hoeffel G, Low D, & Huber T (2013). Origin and differentiation of microglia. Front Cell Neurosci, 7, 45. doi: 10.3389/fncel.2013.00045 [DOI] [PMC free article] [PubMed] [Google Scholar]
- Gonzalez Fleitas MF, Devouassoux JD, Aranda ML, Calanni JS, Chianelli MS, Dorfman D, & Rosenstein RE (2019). Enriched environment provides neuroprotection against experimental glaucoma. J Neurochem. doi: 10.1111/jnc.14885 [DOI] [PubMed] [Google Scholar]
- Goodson ML, Jonas BA, & Privalsky ML (2005). Alternative mRNA splicing of SMRT creates functional diversity by generating corepressor isoforms with different affinities for different nuclear receptors. Journal of Biological Chemistry, 280(9), 7493–7503. doi: 10.1074/jbc.M411514200 [DOI] [PMC free article] [PubMed] [Google Scholar]
- Goodson ML, Young BM, Snyder CA, Schroeder AC, & Privalsky ML (2014). Alteration of NCoR corepressor splicing in mice causes increased body weight and hepatosteatosis without glucose intolerance. Mol Cell Biol, 34(22), 4104–4114. doi: 10.1128/MCB.00554-14 [DOI] [PMC free article] [PubMed] [Google Scholar]
- Goyer D, Silveira MA, George AP, Beebe NL, Edelbrock RM, Malinski PT, … Roberts MT (2019). A novel class of inferior colliculus principal neurons labeled in vasoactive intestinal peptide-Cre mice. Elife, 8. doi: 10.7554/eLife.43770 [DOI] [PMC free article] [PubMed] [Google Scholar]
- Greter M, & Merad M (2013). Regulation of microglia development and homeostasis. Glia, 61(1), 121–127. doi: 10.1002/glia.22408 [DOI] [PubMed] [Google Scholar]
- Guenther MG, Lane WS, Fischle W, Verdin E, Lazar MA, & Shiekhattar R (2000). A core SMRT corepressor complex containing HDAC3 and TBL1, a WD40-repeat protein linked to deafness. Genes & Development, 14(9), 1048–1057. [PMC free article] [PubMed] [Google Scholar]
- Gusel’nikova VV, & Korzhevskiy DE (2015). NeuN As a Neuronal Nuclear Antigen and Neuron Differentiation Marker. Acta Naturae, 7(2), 42–47. [PMC free article] [PubMed] [Google Scholar]
- Halassa MM, Fellin T, Takano H, Dong JH, & Haydon PG (2007). Synaptic islands defined by the territory of a single astrocyte. Journal of Neuroscience, 27(24), 6473–6477. doi: 10.1523/Jneurosci.1419-07.2007 [DOI] [PMC free article] [PubMed] [Google Scholar]
- Hermanson O, Jepsen K, & Rosenfeld MG (2002). N-CoR controls differentiation of neural stem cells into astrocytes. Nature, 419(6910), 934–939. doi: 10.1038/nature01156 [DOI] [PubMed] [Google Scholar]
- Hu X, & Lazar MA (2000). Transcriptional repression by nuclear hormone receptors. Trends Endocrinol Metab, 11(1), 6–10. [DOI] [PubMed] [Google Scholar]
- Hudson GM, Watson PJ, Fairall L, Jamieson AG, & Schwabe JWR (2015). Insights into the Recruitment of Class IIa Histone Deacetylases (HDACs) to the SMRT/NCoR Transcriptional Repression Complex. Journal of Biological Chemistry, 290(29), 18237–18244. doi: 10.1074/jbc.M115.661058 [DOI] [PMC free article] [PubMed] [Google Scholar]
- Imai Y, Ibata I, Ito D, Ohsawa K, & Kohsaka S (1996). A novel gene iba1 in the major histocompatibility complex class III region encoding an EF hand protein expressed in a monocytic lineage. Biochem Biophys Res Commun, 224(3), 855–862. doi: 10.1006/bbrc.1996.1112 [DOI] [PubMed] [Google Scholar]
- Ito D, Imai Y, Ohsawa K, Nakajima K, Fukuuchi Y, & Kohsaka S (1998). Microglia-specific localisation of a novel calcium binding protein, Iba1. Molecular Brain Research, 57(1), 1–9. doi:Doi 10.1016/S0169-328x(98)00040-0 [DOI] [PubMed] [Google Scholar]
- Jacque CM, Vinner C, Kujas M, Raoul M, Racadot J, & Baumann NA (1978). Determination of glial fibrillary acidic protein (GFAP) in human brain tumors. J Neurol Sci, 35(1), 147–155. [DOI] [PubMed] [Google Scholar]
- Jepsen K, Hermanson O, Onami TM, Gleiberman AS, Lunyak V, McEvilly RJ, … Rosenfeld MG (2000). Combinatorial roles of the nuclear receptor corepressor in transcription and development. Cell, 102(6), 753–763. [DOI] [PubMed] [Google Scholar]
- Jepsen K, & Rosenfeld MG (2002). Biological roles and mechanistic actions of co-repressor complexes. J Cell Sci, 115(Pt 4), 689–698. [DOI] [PubMed] [Google Scholar]
- Jepsen K, Solum D, Zhou T, McEvilly RJ, Kim HJ, Glass CK, … Rosenfeld MG (2007). SMRT-mediated repression of an H3K27 demethylase in progression from neural stem cell to neuron. Nature, 450(7168), 415–419. doi: 10.1038/nature06270 [DOI] [PubMed] [Google Scholar]
- Kalambogias J, Chen CC, Khan S, Son T, Wercberger R, Headlam C, … Brumberg JC (2019). Development and sensory experience dependent regulation of microglia in barrel cortex. J Comp Neurol. doi: 10.1002/cne.24771 [DOI] [PMC free article] [PubMed] [Google Scholar]
- Kruusvee V, Lyst MJ, Taylor C, Tarnauskaite Z, Bird AP, & Cook AG (2017). Structure of the MeCP2-TBLR1 complex reveals a molecular basis for Rett syndrome and related disorders. Proceedings of the National Academy of Sciences of the United States of America, 114(16), E3243–E3250. doi: 10.1073/pnas.1700731114 [DOI] [PMC free article] [PubMed] [Google Scholar]
- Lee ML, Martinez-Lozada Z, Krizman EN, & Robinson MB (2017). Brain endothelial cells induce astrocytic expression of the glutamate transporter GLT-1 by a Notch-dependent mechanism. J Neurochem, 143(5), 489–506. doi: 10.1111/jnc.14135 [DOI] [PMC free article] [PubMed] [Google Scholar]
- Legrand N, Bretscher CL, Zielke S, Wilke B, Daude M, Fritz B, … Adhikary T (2019). PPARbeta/delta recruits NCOR and regulates transcription reinitiation of ANGPTL4. Nucleic Acids Res, 47(18), 9573–9591. doi: 10.1093/nar/gkz685 [DOI] [PMC free article] [PubMed] [Google Scholar]
- Leng L, Zhuang K, Liu Z, Huang C, Gao Y, Chen G, … Zhang J (2018). Menin Deficiency Leads to Depressive-like Behaviors in Mice by Modulating Astrocyte-Mediated Neuroinflammation. Neuron, 100(3), 551–563 e557. doi: 10.1016/j.neuron.2018.08.031 [DOI] [PubMed] [Google Scholar]
- Li JM, Cai Y, Liu F, Yang L, Hu X, Patrylo PR, … Yan XX (2015). Experimental microembolism induces localized neuritic pathology in guinea pig cerebrum. Oncotarget, 6(13), 10772–10785. doi: 10.18632/oncotarget.3599 [DOI] [PMC free article] [PubMed] [Google Scholar]
- Li JW, Wang J, Wang JX, Nawaz Z, Liu JM, Qin J, & Wong JM (2000). Both corepressor proteins SMRT and N-CoR exist in large protein complexes containing HDAC3. Embo Journal, 19(16), 4342–4350. doi:DOI 10.1093/emboj/19.16.4342 [DOI] [PMC free article] [PubMed] [Google Scholar]
- Li P, Spann NJ, Kaikkonen MU, Lu M, Oh DY, Fox JN, … Olefsky JM (2013). NCoR repression of LXRs restricts macrophage biosynthesis of insulin-sensitizing omega 3 fatty acids. Cell, 155(1), 200–214. doi: 10.1016/j.cell.2013.08.054 [DOI] [PMC free article] [PubMed] [Google Scholar]
- Li PP, Fan WQ, Xu JF, Lu M, Yamamoto H, Auwerx J, … Olefsky JM (2011). Adipocyte NCoR Knockout Decreases PPAR gamma Phosphorylation and Enhances PPAR gamma Activity and Insulin Sensitivity. Cell, 147(4), 815–826. doi: 10.1016/j.cell.2011.09.050 [DOI] [PMC free article] [PubMed] [Google Scholar]
- Lyst MJ, Ekiert R, Ebert DH, Merusi C, Nowak J, Selfridge J, … Bird A (2013). Rett syndrome mutations abolish the interaction of MeCP2 with the NCoR/SMRT co-repressor. Nature Neuroscience, 16(7), 898–U268. doi: 10.1038/nn.3434 [DOI] [PMC free article] [PubMed] [Google Scholar]
- Malartre M, Short S, & Sharpe C (2004). Alternative splicing generates multiple SMRT transcripts encoding conserved repressor domains linked to variable transcription factor interaction domains. Nucleic Acids Res, 32(15), 4676–4686. doi: 10.1093/nar/gkh786 [DOI] [PMC free article] [PubMed] [Google Scholar]
- Matsuda T, Irie T, Katsurabayashi S, Hayashi Y, Nagai T, Hamazaki N, … Nakashima K (2019). Pioneer Factor NeuroD1 Rearranges Transcriptional and Epigenetic Profiles to Execute Microglia-Neuron Conversion. Neuron, 101(3), 472–485 e477. doi: 10.1016/j.neuron.2018.12.010 [DOI] [PubMed] [Google Scholar]
- Meng XL, McGraw CM, Wang W, Jing JZ, Yeh SY, Wang L, … Zoghbi HY (2019). Neurexophilin4 is a selectively expressed alpha-neurexin ligand that modulates specific cerebellar synapses and motor functions. Elife, 8. doi:ARTN e46773 10.7554/eLife.46773 [DOI] [PMC free article] [PubMed] [Google Scholar]
- Mengeling BJ, Goodson ML, Bourguet W, & Privalsky ML (2012). SMRTepsilon, a corepressor variant, interacts with a restricted subset of nuclear receptors, including the retinoic acid receptors alpha and beta. Mol Cell Endocrinol, 351(2), 306–316. doi: 10.1016/j.mce.2012.01.006 [DOI] [PMC free article] [PubMed] [Google Scholar]
- Mo A, Mukamel EA, Davis FP, Luo C, Henry GL, Picard S, … Nathans J (2015). Epigenomic Signatures of Neuronal Diversity in the Mammalian Brain. Neuron, 86(6), 1369–1384. doi: 10.1016/j.neuron.2015.05.018 [DOI] [PMC free article] [PubMed] [Google Scholar]
- Mottis A, Mouchiroud L, & Auwerx J (2013). Emerging roles of the corepressors NCoR1 and SMRT in homeostasis. Genes Dev, 27(8), 819–835. doi: 10.1101/gad.214023.113 [DOI] [PMC free article] [PubMed] [Google Scholar]
- Murru S, Hess S, Barth E, Almajan ER, Schatton D, Hermans S, … Rugarli EI (2019). Astrocyte-specific deletion of the mitochondrial m-AAA protease reveals glial contribution to neurodegeneration. Glia, 67(8), 1526–1541. doi: 10.1002/glia.23626 [DOI] [PMC free article] [PubMed] [Google Scholar]
- Nayak D, Roth TL, & McGavern DB (2014). Microglia development and function. Annu Rev Immunol, 32, 367–402. doi: 10.1146/annurev-immunol-032713-120240 [DOI] [PMC free article] [PubMed] [Google Scholar]
- Nellessen A, Nyamoya S, Zendedel A, Slowik A, Wruck C, Beyer C, … Clarner T (2019). Nrf2 deficiency increases oligodendrocyte loss, demyelination, neuroinflammation and axonal damage in an MS animal model. Metab Brain Dis. doi: 10.1007/s11011-019-00488-z [DOI] [PubMed] [Google Scholar]
- Nofsinger RR, Li P, Hong SH, Jonker JW, Barish GD, Ying H, … Evans RM (2008). SMRT repression of nuclear receptors controls the adipogenic set point and metabolic homeostasis. Proceedings of the National Academy of Sciences of the United States of America, 105(50), 20021–20026. doi: 10.1073/pnas.0811012105 [DOI] [PMC free article] [PubMed] [Google Scholar]
- Octeau JC, Chai H, Jiang RT, Bonanno SL, Martin KC, & Khakh BS (2018). An Optical Neuron-Astrocyte Proximity Assay at Synaptic Distance Scales. Neuron, 98(1), 49-+. doi: 10.1016/j.neuron.2018.03.003 [DOI] [PMC free article] [PubMed] [Google Scholar]
- Ogawa S, Lozach J, Jepsen K, Sawka-Verhelle D, Perissi V, Sasik R, … Glass CK (2004). A nuclear receptor corepressor transcriptional checkpoint controlling activator protein 1-dependent gene networks required for macrophage activation. Proc Natl Acad Sci U S A, 101(40), 14461–14466. doi: 10.1073/pnas.0405786101 [DOI] [PMC free article] [PubMed] [Google Scholar]
- Ordentlich P, Downes M, & Evans RM (2001). Corepressors and nuclear hormone receptor function. Curr Top Microbiol Immunol, 254, 101–116. [DOI] [PubMed] [Google Scholar]
- Orefice LL, Mosko JR, Morency DT, Wells MF, Tasnim A, Mozeika SM, … Ginty DD (2019). Targeting Peripheral Somatosensory Neurons to Improve Tactile-Related Phenotypes in ASD Models. Cell, 178(4), 867-+. doi: 10.1016/j.cell.2019.07.024 [DOI] [PMC free article] [PubMed] [Google Scholar]
- Pascual G, Fong AL, Ogawa S, Gamliel A, Li AC, Perissi V, … Glass CK (2005). A SUMOylation-dependent pathway mediates transrepression of inflammatory response genes by PPAR-gamma. Nature, 437(7059), 759–763. doi: 10.1038/nature03988 [DOI] [PMC free article] [PubMed] [Google Scholar]
- Perissi V, Jepsen K, Glass CK, & Rosenfeld MG (2010). Deconstructing repression: evolving models of co-repressor action. Nat Rev Genet, 11(2), 109–123. doi: 10.1038/nrg2736 [DOI] [PubMed] [Google Scholar]
- Pinal CS, & Tobin AJ (1998). Uniqueness and redundancy in GABA production. Perspectives on Developmental Neurobiology, 5(2–3), 109–118. [PubMed] [Google Scholar]
- Poulin JF, Tasic B, Hjerling-Leffler J, Trimarchi JM, & Awatramani R (2016). Disentangling neural cell diversity using single-cell transcriptomics. Nature Neuroscience, 19(9), 1131–1141. doi: 10.1038/nn.4366 [DOI] [PubMed] [Google Scholar]
- Privalsky ML, Snyder CA, & Goodson ML (2016). Corepressor diversification by alternative mRNA splicing is species specific. BMC Evol Biol, 16(1), 221. doi: 10.1186/s12862-016-0781-2 [DOI] [PMC free article] [PubMed] [Google Scholar]
- Rosenfeld MG, Lunyak VV, & Glass CK (2006). Sensors and signals: a coactivator/corepressor/epigenetic code for integrating signal-dependent programs of transcriptional response. Genes Dev, 20(11), 1405–1428. doi: 10.1101/gad.1424806 [DOI] [PubMed] [Google Scholar]
- Schafer DP, & Stevens B (2015). Microglia Function in Central Nervous System Development and Plasticity. Cold Spring Harb Perspect Biol, 7(10), a020545. doi: 10.1101/cshperspect.a020545 [DOI] [PMC free article] [PubMed] [Google Scholar]
- Sengupta S, Peterson TR, Laplante M, Oh S, & Sabatini DM (2010). mTORC1 controls fasting-induced ketogenesis and its modulation by ageing. Nature, 468(7327), 1100–1104. doi: 10.1038/nature09584 [DOI] [PubMed] [Google Scholar]
- Sharma N, Pollina EA, Nagy MA, Yap EL, DiBiase FA, Hrvatin S, … Greenberg ME (2019). ARNT2 Tunes Activity-Dependent Gene Expression through NCoR2-Mediated Repression and NPAS4-Mediated Activation. Neuron, 102(2), 390–406 e399. doi: 10.1016/j.neuron.2019.02.007 [DOI] [PMC free article] [PubMed] [Google Scholar]
- Simons M, & Nave KA (2015). Oligodendrocytes: Myelination and Axonal Support. Cold Spring Harb Perspect Biol, 8(1), a020479. doi: 10.1101/cshperspect.a020479 [DOI] [PMC free article] [PubMed] [Google Scholar]
- Sinha RA, You SH, Zhou J, Siddique MM, Bay BH, Zhu X, … Yen PM (2012). Thyroid hormone stimulates hepatic lipid catabolism via activation of autophagy. J Clin Invest, 122(7), 2428–2438. doi: 10.1172/JCI60580 [DOI] [PMC free article] [PubMed] [Google Scholar]
- Sofroniew MV, & Vinters HV (2010). Astrocytes: biology and pathology. Acta Neuropathologica, 119(1), 7–35. doi: 10.1007/s00401-009-0619-8 [DOI] [PMC free article] [PubMed] [Google Scholar]
- Stewart MD, & Wong JM (2009). Nuclear Receptor Repression: Regulatory Mechanisms and Physiological Implications. Regulatory Mechanisms in Transcriptional Signaling, 87, 235–259. doi: 10.1016/S1877-1173(09)87007-5 [DOI] [PubMed] [Google Scholar]
- Sutanto MM, Ferguson KK, Sakuma H, Ye H, Brady MJ, & Cohen RN (2010). The silencing mediator of retinoid and thyroid hormone receptors (SMRT) regulates adipose tissue accumulation and adipocyte insulin sensitivity in vivo. Journal of Biological Chemistry, 285(24), 18485–18495. doi: 10.1074/jbc.M110.107680 [DOI] [PMC free article] [PubMed] [Google Scholar]
- Takamori S, Rhee JS, Rosenmund C, & Jahn R (2000). Identification of a vesicular glutamate transporter that defines a glutamatergic phenotype in neurons. Nature, 407(6801), 189–194. doi:Doi 10.1038/35025070 [DOI] [PubMed] [Google Scholar]
- Takebayashi H, Nabeshima Y, Yoshida S, Chisaka O, Ikenaka K, & Nabeshima Y (2002). The basic helix-loop-helix factor Olig2 is essential for the development of motoneuron and oligodendrocyte lineages. Current Biology, 12(13), 1157–1163. doi:Pii S0960–9822(02)00926–0 Doi 10.1016/S0960-9822(02)00926-0 [DOI] [PubMed] [Google Scholar]
- Tasic B, Menon V, Nguyen TN, Kim TK, Jarsky T, Yao Z, … Zeng H (2016). Adult mouse cortical cell taxonomy revealed by single cell transcriptomics. Nature Neuroscience, 19(2), 335–346. doi: 10.1038/nn.4216 [DOI] [PMC free article] [PubMed] [Google Scholar]
- Tasic B, Yao Z, Graybuck LT, Smith KA, Nguyen TN, Bertagnolli D, … Zeng H (2018). Shared and distinct transcriptomic cell types across neocortical areas. Nature, 563(7729), 72–78. doi: 10.1038/s41586-018-0654-5 [DOI] [PMC free article] [PubMed] [Google Scholar]
- Tatti R, Haley MS, Swanson OK, Tselha T, & Maffei A (2017). Neurophysiology and Regulation of the Balance Between Excitation and Inhibition in Neocortical Circuits. Biological Psychiatry, 81(10), 821–831. doi: 10.1016/j.biopsych.2016.09.017 [DOI] [PMC free article] [PubMed] [Google Scholar]
- Tekki-Kessaris N, Woodruff R, Hall AC, Gaffield W, Kimura S, Stiles CD, … Richardson WD (2001). Hedgehog-dependent oligodendrocyte lineage specification in the telencephalon. Development, 128(13), 2545–2554. [DOI] [PubMed] [Google Scholar]
- Telese F, Ma Q, Perez PM, Notani D, Oh S, Li WB, … Rosenfeld MG (2015). LRP8-Reelin-Regulated Neuronal Enhancer Signature Underlying Learning and Memory Formation. Neuron, 86(3), 696–710. doi: 10.1016/j.neuron.2015.03.033 [DOI] [PMC free article] [PubMed] [Google Scholar]
- Truett GE, Heeger P, Mynatt RL, Truett AA, Walker JA, & Warman ML (2000). Preparation of PCR-quality mouse genomic DNA with hot sodium hydroxide and tris (HotSHOT). Biotechniques, 29(1), 52-+ doi:DOI 10.2144/00291bm09 [DOI] [PubMed] [Google Scholar]
- Tulloch AJ, Teo S, Carvajal BV, Tessier-Lavigne M, & Jaworski A (2019). Diverse spinal commissural neuron populations revealed by fate mapping and molecular profiling using a novel Robo3(Cre) mouse. J Comp Neurol, 527(18), 2948–2972. doi: 10.1002/cne.24720 [DOI] [PMC free article] [PubMed] [Google Scholar]
- van der Laan S, Lachize SB, Schouten TG, Vreugdenhil E, de Kloet ER, & Meijer OC (2005). Neuroanatomical distribution and colocalisation of nuclear receptor corepressor (N-CoR) and silencing mediator of retinoid and thyroid receptors (SMRT) in rat brain. Brain Res, 1059(2), 113–121. doi: 10.1016/j.brainres.2005.08.011 [DOI] [PubMed] [Google Scholar]
- van Tilborg E, de Theije CGM, van Hal M, Wagenaar N, de Vries LS, Benders MJ, … Nijboer CH (2018). Origin and dynamics of oligodendrocytes in the developing brain: Implications for perinatal white matter injury. Glia, 66(2), 221–238. doi: 10.1002/glia.23256 [DOI] [PMC free article] [PubMed] [Google Scholar]
- VanRyzin JW, Marquardt AE, Argue KJ, Vecchiarelli HA, Ashton SE, Arambula SE, … McCarthy MM (2019). Microglial Phagocytosis of Newborn Cells Is Induced by Endocannabinoids and Sculpts Sex Differences in Juvenile Rat Social Play. Neuron, 102(2), 435-+. doi: 10.1016/j.neuron.2019.02.006 [DOI] [PMC free article] [PubMed] [Google Scholar]
- Xiong W, Cao X, Zeng Y, Qin X, Zhu M, Ren J, … Zhu X (2019). Astrocytic Epoxyeicosatrienoic Acid Signaling in the Medial Prefrontal Cortex Modulates Depressive-like Behaviors. Journal of Neuroscience, 39(23), 4606–4623. doi: 10.1523/JNEUROSCI.3069-18.2019 [DOI] [PMC free article] [PubMed] [Google Scholar]
- Yamamoto H, Williams EG, Mouchiroud L, Canto C, Fan WW, Downes M, … Auwerx J (2011). NCoR1 Is a Conserved Physiological Modulator of Muscle Mass and Oxidative Function. Cell, 147(4), 827–839. doi: 10.1016/j.cell.2011.10.017 [DOI] [PMC free article] [PubMed] [Google Scholar]
- Yang F, Ma Q, Liu Z, Li W, Tan Y, Jin C, … Rosenfeld MG (2017). Glucocorticoid Receptor:MegaTrans Switching Mediates the Repression of an ERalpha-Regulated Transcriptional Program. Molecular Cell, 66(3), 321–331 e326. doi: 10.1016/j.molcel.2017.03.019 [DOI] [PMC free article] [PubMed] [Google Scholar]
- Yokoo H, Nobusawa S, Takebayashi H, Ikenaka K, Isoda K, Kamiya M, … Nakazato Y (2004). Anti-human olig2 antibody as a useful immunohistochemical marker of normal oligodendrocytes and gliomas. American Journal of Pathology, 164(5), 1717–1725. doi:Doi 10.1016/S0002-9440(10)63730-3 [DOI] [PMC free article] [PubMed] [Google Scholar]
- Yoon HG, Chan DW, Huang ZQ, Li JW, Fondell JD, Qin J, & Wong JM (2003). Purification and functional characterization of the human N-CoR complex: the roles of HDAC3, TBL1 and TBLR1. Embo Journal, 22(6), 1336–1346. doi:DOI 10.1093/emboj/cdg120 [DOI] [PMC free article] [PubMed] [Google Scholar]
- Zeisel A, Munoz-Manchado AB, Codeluppi S, Lonnerberg P, La Manno G, Jureus A, … Linnarsson S (2015). Cell types in the mouse cortex and hippocampus revealed by single-cell RNA-seq. Science, 347(6226), 1138–1142. doi: 10.1126/science.aaa1934 [DOI] [PubMed] [Google Scholar]
- Zeng HK, & Sanes JR (2017). Neuronal cell-type classification: challenges, opportunities and the path forward. Nature Reviews Neuroscience, 18(9), 530–546. doi: 10.1038/nrn.2017.85 [DOI] [PubMed] [Google Scholar]
- Zhang JS, Kalkum M, Chait BT, & Roeder RG (2002). The N-CoR-HDAC3 nuclear receptor corepressor complex inhibits the JNK pathway through the integral subunit GPS2. Molecular Cell, 9(3), 611–623. doi:Doi 10.1016/S1097-2765(02)00468-9 [DOI] [PubMed] [Google Scholar]
- Zhang SB, Lin SY, Liu M, Liu CC, Ding HH, Sun Y, … Xin WJ (2019). CircAnks1a in the spinal cord regulates hypersensitivity in a rodent model of neuropathic pain. Nat Commun, 10(1), 4119. doi: 10.1038/s41467-019-12049-0 [DOI] [PMC free article] [PubMed] [Google Scholar]
- Zhou WJ, He YL, Rehman AU, Kong Y, Hong SG, Ding GL, … Study D (2019). Loss of function of NCOR1 and NCOR2 impairs memory through a novel GABAergic hypothalamus-CA3 projection. Nature Neuroscience, 22(2), 205-+. doi: 10.1038/s41593-018-0311-1 [DOI] [PMC free article] [PubMed] [Google Scholar]
- Zoghbi HY, Amir RE, Wan M, Lee SS, Van den Veyver IB, Tran CQ, … Francke U (2000). Rett syndrome is caused by mutations in the X-linked MECP2 gene encoding methyl-CpG-binding protein. American Journal of Human Genetics, 66(5), 1723–1723. [Google Scholar]