Abstract
The human gut microbiome is linked to many states of human health and disease.1 The metabolic repertoire of the gut microbiome is vast, but the health implications of these bacterial pathways are poorly understood. In this study, we identify a link between members of the genus Veillonella and exercise performance. We observed an increase Veillonella relative abundance in marathon runners post-marathon and isolated a strain of Veillonella atypica from stool samples. Inoculation of this strain into mice significantly increased exhaustive treadmill runtime. Veillonella utilize lactate as their sole carbon source, which prompted us to perform shotgun metagenomic analysis in a cohort of elite athletes, finding that every gene in a major pathway metabolizing lactate to propionate is at higher relative abundance post-exercise. Using 13C3-labeled lactate in mice we demonstrate that serum lactate crosses the epithelial barrier into the lumen of the gut. We also show that intrarectal instillation of propionate is sufficient to reproduce the increased treadmill runtime performance observed with V. atypica gavage. Taken together, these studies reveal that V. atypica improves runtime via its metabolic conversion of exercise-induced lactate into propionate, thereby identifying a natural, microbiome-encoded enzymatic process that enhances athletic performance.
Human microbiome studies have generally examined individuals who are “healthy” or diseased and identified features of the microbiome associated with these states.2–4 Athlete microbiomes have been found to contain distinct microbial compositions defined by elevated abundances of Veillonella, Bacteroides, Prevotella, Methanobrevibacter or the Akkermansiaceae.5,6 These studies show exercise is associated with changes in microbiome composition, though the effects of these microbial genera on phenotype remains unknown.
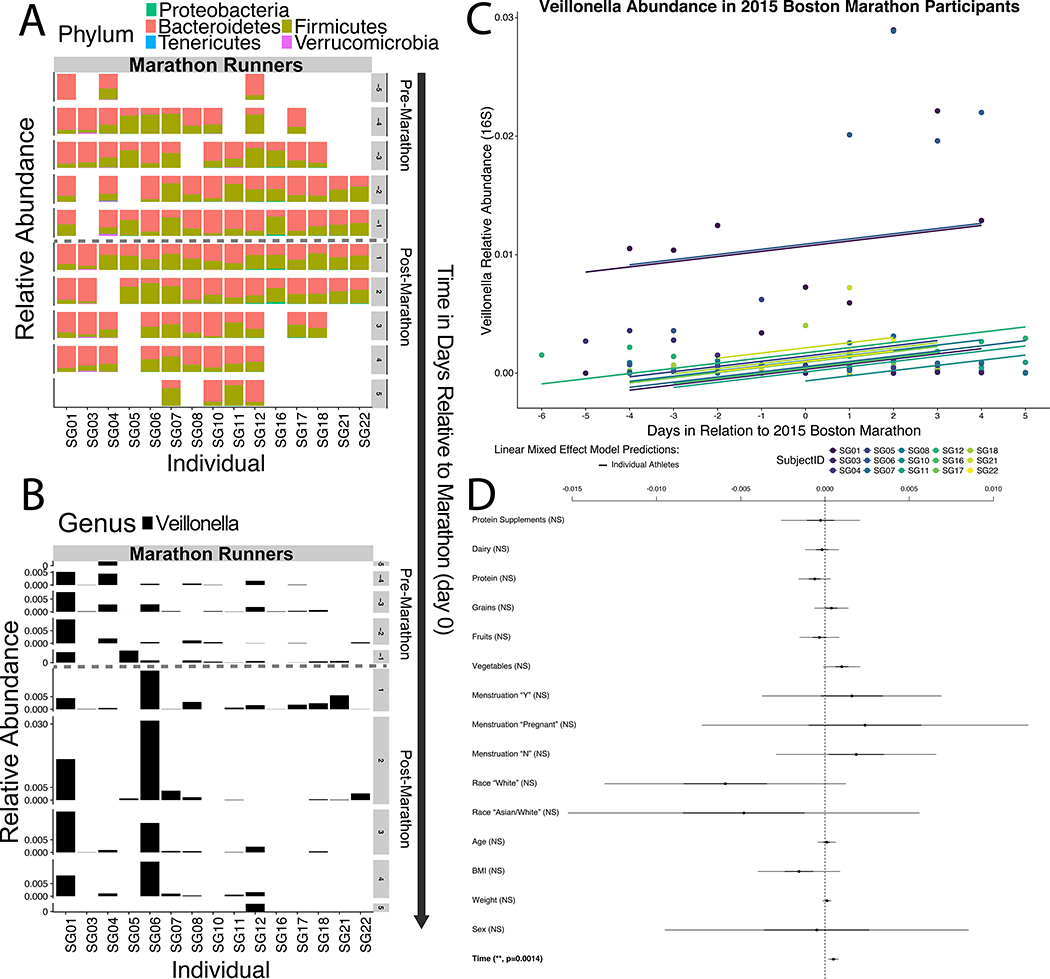
To identify gut bacteria associated with athletic performance and recovery states, we recruited athletes (n=15) who ran in the 2015 Boston Marathon along with a set of sedentary controls (n=10) and conducted 16S rDNA sequencing on approximately daily samples collected up to one week before and one week after marathon day (n=209 samples, Supplementary Tables 1 and 2). Phylum-level relative abundance partitioned by individual, time (−5 to +5 days in relation to running the Marathon), and whether the participant was an athlete (Figure 1A) shows that, at this high-level taxonomic view, any orthogonal differences are likely due to variation at the level of the individual. The bacterial genus Veillonella is the most differentially abundant microbiome feature between pre- and post-exercise states (Supplementary Table 2). Veillonella has a significant difference in relative abundance (P = 0.02; Wilcoxon rank sum test with continuity correction) between samples collected before and after exercise (Figure 1B). To validate the significance of the association between Veillonella and post-marathon state, we constructed a series of generalized linear mixed effect models (GLMMs) to predict Veillonella relative abundance in the marathon participants (Figure 1C, methods). Subsequently, significance was calculated for all coefficients included in the GLMM (Figure 1D, Wald Z-tests); revealing no coefficients were significant except time in relation to the marathon in days (P = 0.0014, Wald Z-test, n=15). Both leave-one-out cross-validation (LOOCV) and iterative permutation of labels were conducted as part of the GLMM analysis (Extended Data 1, methods). Additionally, it appears that Veillonella is more prevalent among runners than non-runners (Extended Data 2), though this is not statistically significant. These correlations raise the question whether there is a causal link between Veillonella and marathon runner’s performance, but no conclusions can be made without proper validation.
Figure 1: Gut Veillonella abundance is significantly associated with marathon running.
A: Phylum level relative abundance partitioned by individual and time (−5 to +5 days in relation to running the Marathon) shows few global differences in composition. B: Veillonella relative abundance at the Genus level partitioned by individual and time (−5 to +5 days in relation to running the Marathon) shows that Veillonella has a significant difference in relative abundance (P = 0.02; two-sided Wilcoxon rank sum test with continuity correction; n = 15 individuals) between samples collected before and after exercise. C: Generalized linear mixed effect models (GLMMs) predicting longitudinal Veillonella relative abundance in the marathon participants. Differences in intercept between fits for different marathoners represent random effects. D: 95% confidence intervals for all fixed effects (coefficients) included in the GLMMs. The Y-axis represents represents Veillonella relative abundance and the X-axis represents (time days in relation to running the Marathon). All coefficients except time (P = 0.0014, Wald Z-test, post-marathon time points correspond with increased Veillonella relative abundance) are not significant, suggesting that Veillonella blooms in runners correspond with exercise state and not other fixed effects (n = 15 individuals).
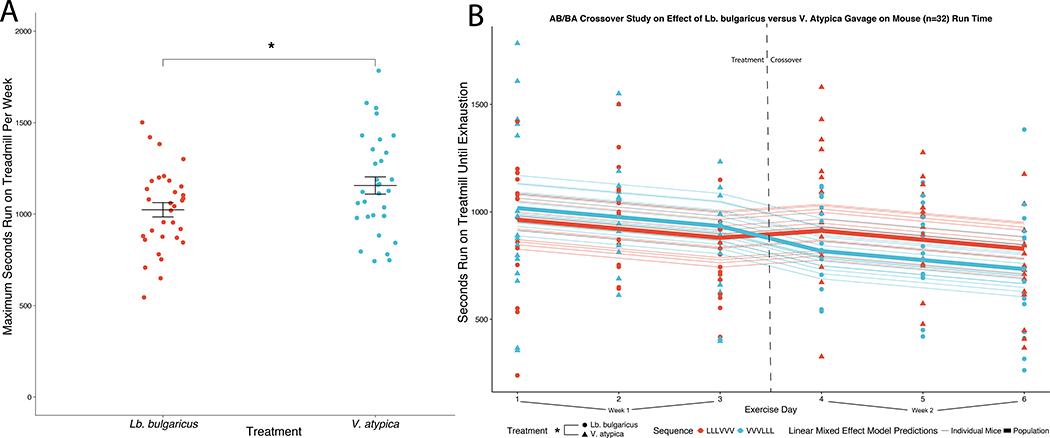
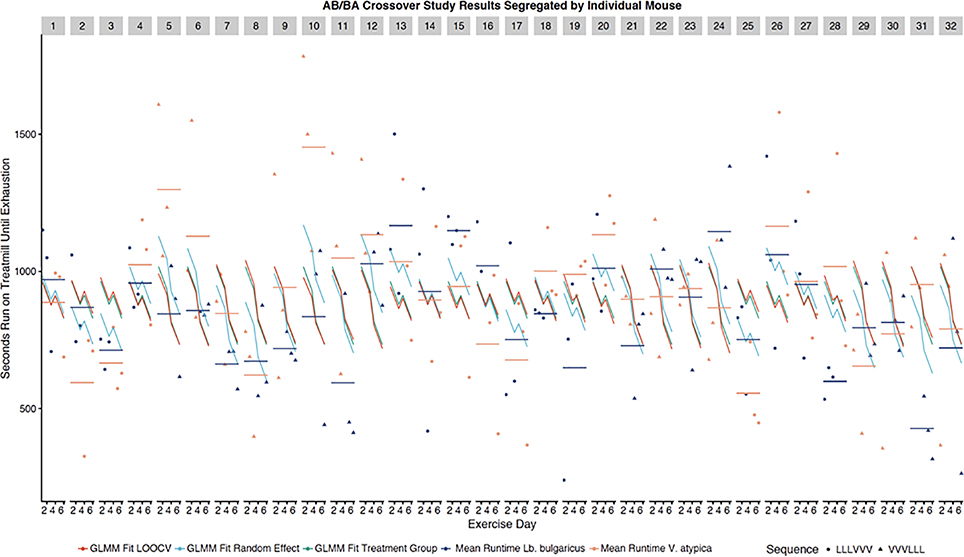
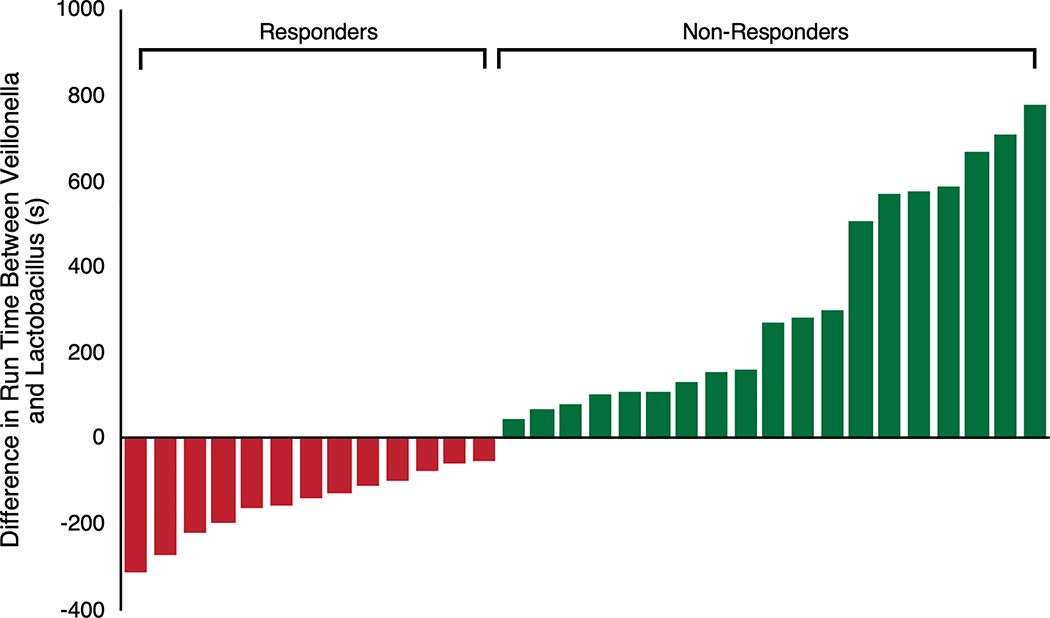
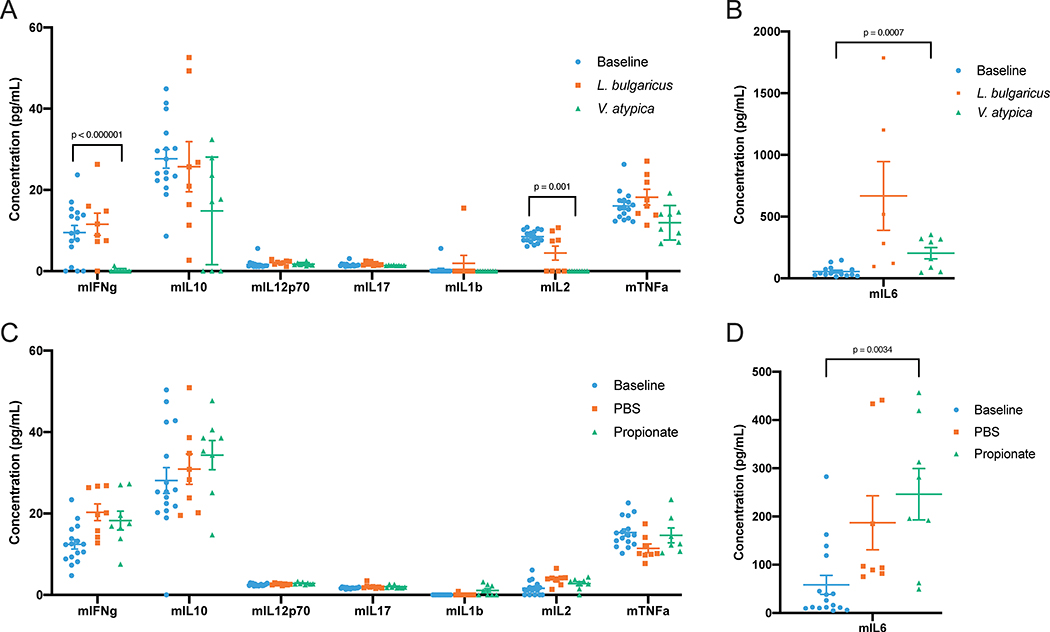
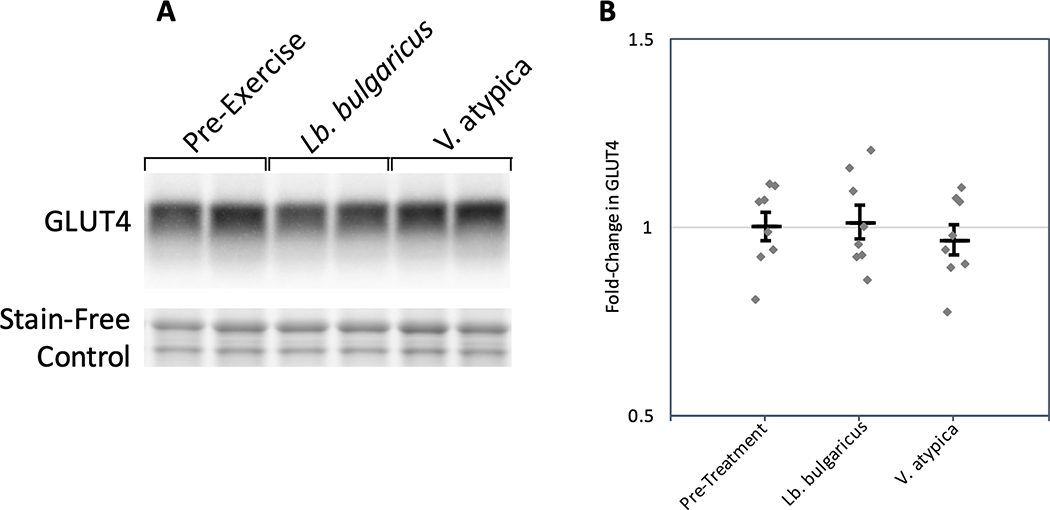
To assess whether there are any potential benefits of Veillonella on performance in an animal exercise model, we designed an AB/BA crossover mouse experiment spanning two weeks consisting of a control group (Lactobacillus bulgaricus gavage, n=16) and a treatment group (Veillonella gavage, n=16) with a treatment/control crossover happening between weeks (n=32 total mice). Lactobacillus bulgaricus was chosen as a control due its inability to catabolize lactate, mimicking bacterial load without impacting lactate metabolism.7 The Veillonella strain used, Veillonella atypica, was directly isolated from one of the marathon runners. Mice were administered either Veillonella atypica or Lactobacillus bulgaricus and run to exhaustion five hours later (methods). In aggregate, on both sides of the crossover, mice gavaged with Veillonella atypica have statistically significant longer maximum runtimes than mice gavaged with Lactobacillus bulgaricus (P = 0.02 paired t-test, Figure 2A, Supplementary Table 3, Extended Data 3). Both leave-one-out cross-validation (LOOCV) and iterative permutation of labels were conducted as part of the GLMM analysis (Extended Data 3, methods). Per-mouse run times overlaid on the GLMM fits (Extended Data 4) and the difference between max run time in Lb. Bulgaricus versus V. atypica gavage show a distinction between “responders” and “non-responders” to V. atypica gavage (Extended Data 5). Mice treated with Veillonella atypica run on average 13% longer than the control group (Figure 2A). Testing the significance of coefficients in the GLMM for their contribution to treadmill runtime (Wald-Z test) shows that sequence effect is not significant (P = 0.758) while treatment day (P = 0.031, negative effect on runtime) and Veillonella treatment (P = 0.016, positive effect on runtime) are significant (Figure 2B; Extended Data 3). In a separate experiment, levels of inflammatory cytokines were quantified post exercise and were significantly reduced in Veillonella-treated animals compared to Lb. bulgaricus or PBS (Extended Data 6, Supplementary Table 4). To assess changes in muscle physiology, the glucose transporter GLUT4 was quantified via western blot, but we observed no changes regardless of treatment (Extended Data 7).
Figure 2: Veillonella atypica gavage improves treadmill runtime in mice.
A: Mice gavaged with Veillonella atypica have greater maximum run time per week than mice gavaged with Lactobacillus bulgaricus in an AB/BA crossover trial. Data shown are the maximum run time out of 3 days of consecutive treadmill running for a given treatment (all mice switched treatments second week). The jitter plot shows each mouse as an individual point, with the central bar representing the mean and error bars representing s.e.m. (n = 32). (*P = 0.02, using two-sided paired t-test). B: Generalized linear mixed effect models (GLMMs) predicting runtime in the 2 week AB/BA crossover trial. The Y-axis shows seconds run on treadmill until exhaustion and the X-axis shows days which the mice were run in the 2 week crossover. Color of lines (GLMM fits) and points (runs by an arbitrary mouse) represents treatment sequence; shape of points represents treatment at a given time point. These models incorporate both random effects (individual variation per mouse that manifests longitudinally) and fixed effects (treatment day, treatment sequence, and treatment given). Visualization of all longitudinal data points with the GLMM predictions overlayed show both the effect of Veillonella atypica increasing performance on both sides of the crossover when aggregated by treatment group (thick lines) as well as the trends for each of the 32 individual mice (thin lines). (*P=0.016, Wald-Z test on model coefficients).
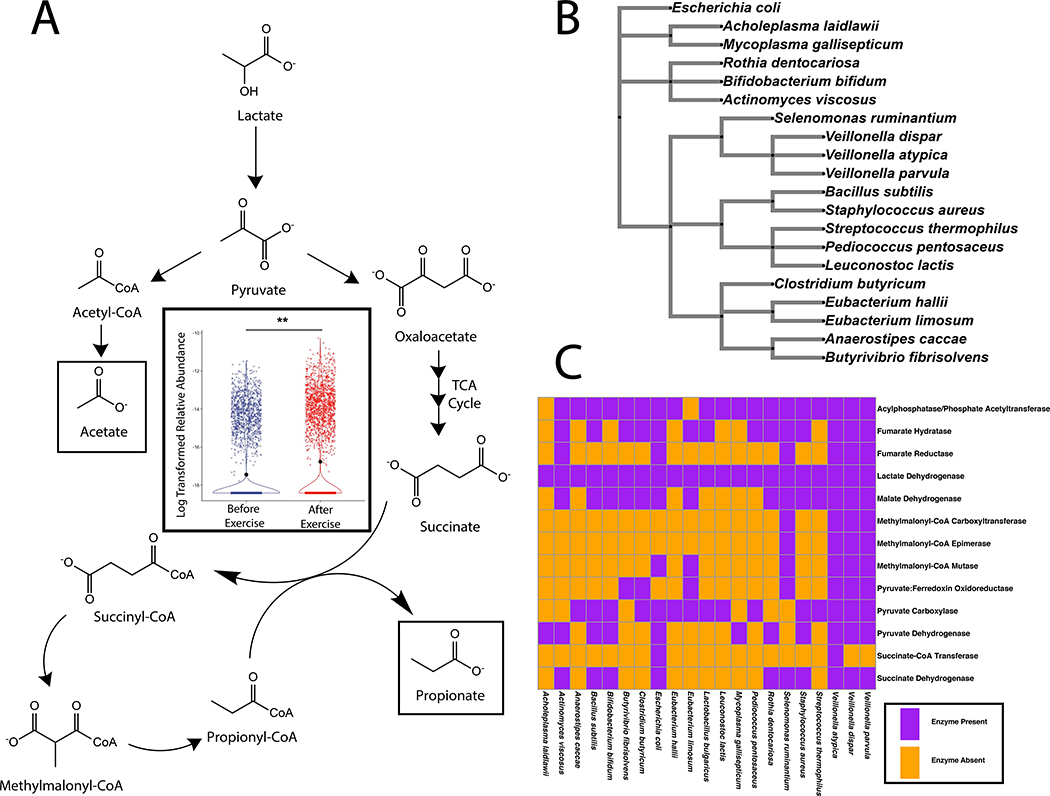
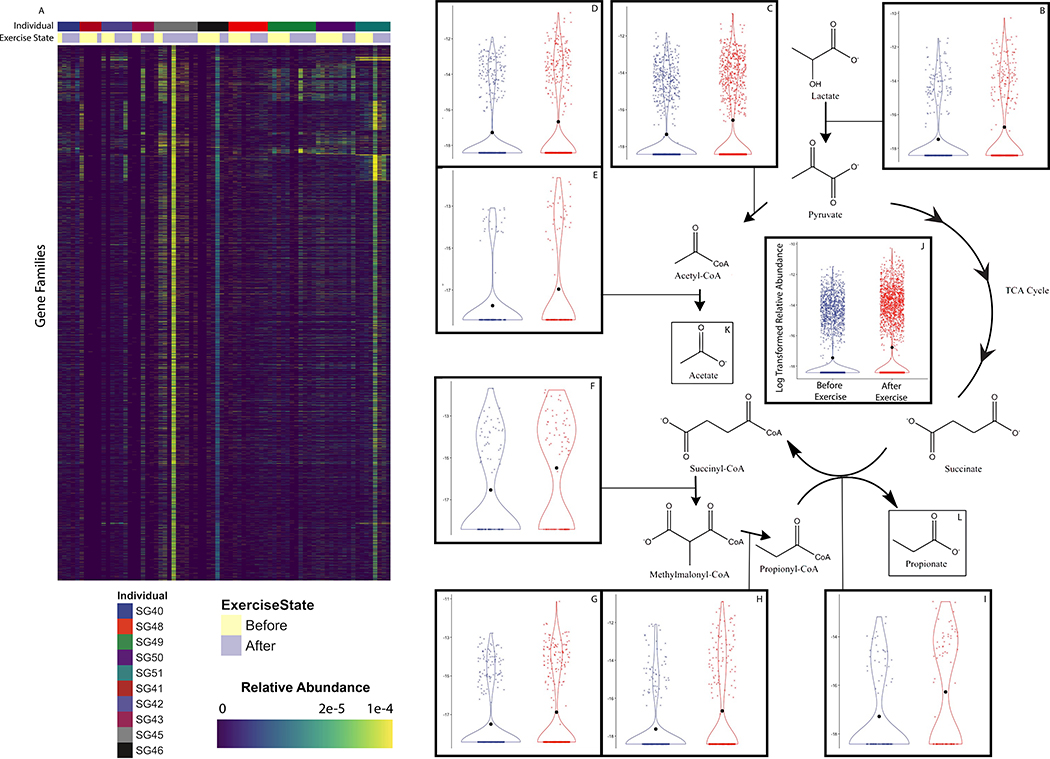
To test whether our results would be replicated in an independent cohort of human athletes, we performed shotgun metagenomic sequencing of stool samples (n=87) from ultra-marathoners and Olympic trial rowers both before and after exercise (Supplementary Table 5). Putative taxonomic abundances reproduced the previous 16S sequencing-based association with Veillonella (Extended Data 8).8 By utilizing novel algorithms that allow for cheap construction of metagenomic gene catalogs at massive scale through efficient use of cloud computing, we investigated phenotypic modulating effects of millions of microbial genes on athletes by building a sample (n=87) by gene (n=2,288,155) relative abundance matrix (Extended Data 8 and 9; methods).9–13 The inability of Veillonella to ferment carbohydrates, coupled with high observed abundance of the lactate import permease in previously sequenced isolates, suggests that metabolic enzymes facilitating lactate breakdown are likely conserved.14 Across the entire ultramarathon and rower cohorts, there exist a group of gene families with differential relative abundance pre and post exercise (Extended Data 9) representing every step of the enriched methylmalonyl-CoA pathway (P = 0.00147; methods) degrading lactate into propionate as assigned by EC IDs (Figure 3A). Given the limited prevalence of the methylmalonyl-CoA pathway across lactate-utilizing microbes, this enrichment post-exercise may implicate Veillonella in causing functional change in the metabolic repertoire of the gut microbiome. We verified strong production of acetate and propionate by performing mass spectrometry on spent media collected after growing three Veillonella strains isolated from the human athletes (V. parvula, V. dispar, and V. atypica) in lactate-supplemented BHI media and semi-synthetic lactate media (Figure 4A and Supplementary Table 6; methods).
Figure 3: The athlete gut microbiome is functionally enriched for the metabolism of lactate to propionate post-exercise.
A: methylmalonyl-CoA pathway and inset showing significant differentially expressed gene families pathway wide in a pair of non-redundant gene catalogs created from metagenomic sequencing of athlete stool samples. Log transformed relative abundance increases after exercise for every enzyme in the methylmalonyl-CoA pathway. (**P = 0.00147; two-sided Fisher’s exact test; n = 8, contingency table constructed for enzymes in pathway). Data represented as a violin plot, which displays the distribution of data as a rotated kernel density distribution. B: Bacterial phylogenetic tree showing diversity of microbes that have the ability to utilize Lactate as a carbon source. C: Prevalence of enzymes in the methylmalonyl-CoA pathway that breaks down lactate into acetate and propionate in reference genomes from this represent subset of lactate processing microbes.
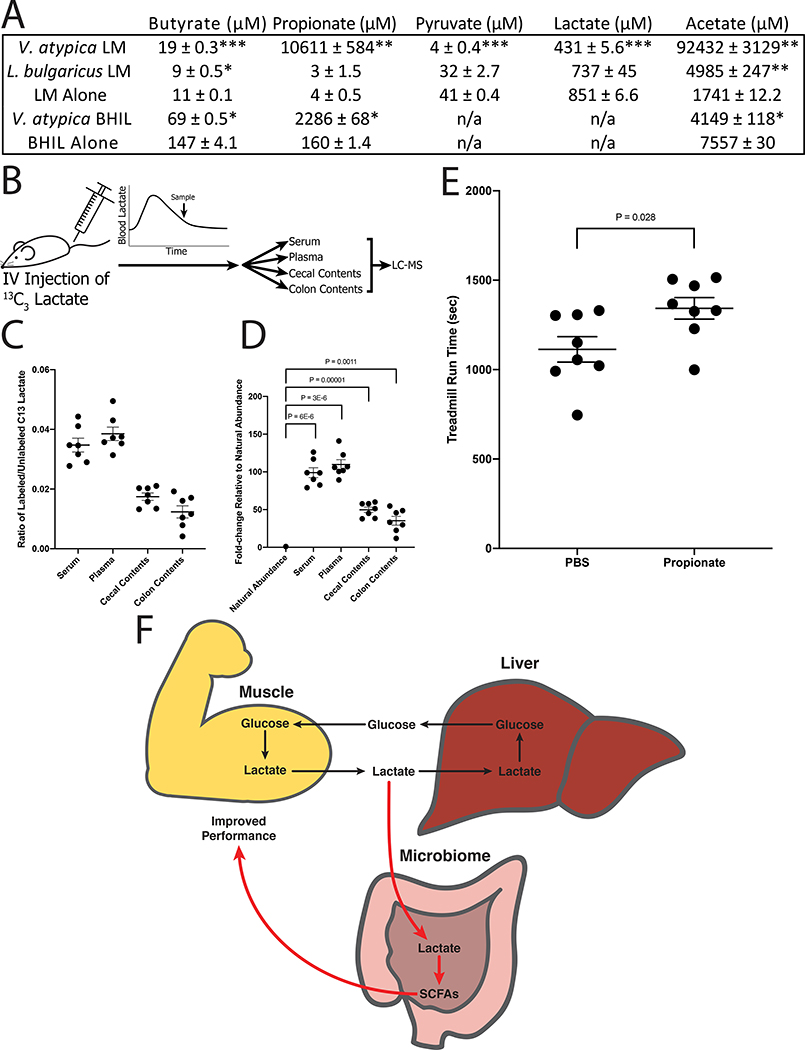
Figure 4: Serum lactate crosses the epithelial barrier into the gut lumen and colorectal propionate instillation is sufficient to enhance treadmill runtime.
A: SCFAs detected in spent media after 48 hours of growth with the indicated strain. LM = semi-synthetic lactate media; BHIL = brain-heart infusion media supplemented with sodium lactate; n/a = not quantified. Each table entry shows the mean ± s.e.m. (BHIL, n = 2; LM, n = 3). (p values from left to right, top to bottom: .0008, .003, 4.4E-7, 1.4E-6, .001, .023, .006, .03, .02, .015; compared with media control using two-sided Welch’s t-test). B: Schematic of the 13C3 flux tracing experimental design. Mice were injected with 13C3 sodium lactate, then sacrificed after 12 minutes. Serum and plasma were collected via cardiac puncture. Cecum and colon contents were collected by dissection. C: Abundance of 13C3 lactate quantified relative to abundance of unlabeled lactate. Each mouse sample is represented as an individual point, with the central bar representing the mean and error bars representing s.e.m. (n = 7). D: 13C3 lactate abundance normalized to the expected natural abundance of 13C3 lactate. Ratio of labeled/unlabeled lactate was quantified for experimental samples as well as for unlabeled lactate standard. Experimental samples are represented as fold-change relative to unlabeled standard. Each mouse sample is represented as an individual point, with the central bar representing the mean and error bars representing s.e.m. (n = 7). (p values are from two-sided one sample t-test vs natural abundance). E: Intracolonic infusion of propionate improves maximum run time in mice. Data shown are the maximum run time out of 3 days of consecutive treadmill running. The jitter plot shows each mouse as an individual point, with the central bar representing the mean and error bars representing s.e.m. (n = 8). (p value from two-sided unpaired t-test). F: Proposed model of the microbiome-exercise interaction. Black arrows represent the well-known steps of the Cori cycle, where glucose is converted to lactate in the muscle, enters the liver via blood circulation, then is converted back to glucose in the liver via gluconeogenesis. Red arrows represent the steps proposed in this work. First, lactate produced in the muscle enters the intestinal lumen via blood circulation. In the intestine it acts as a carbon source for specific microbes, including Veillonella species. This causes the observed bloom in intestinal Veillonella, as well as production of SCFA byproducts (predominantly propionate), which are taken up by the host via the intestinal epithelium. Presence of microbiome-sourced SCFAs in the blood improves athletic performance via an unknown mechanism. Together, this creates an addendum to the Cori cycle by converting an exercise byproduct into a performance-enhancing molecule, mediated by naturally occurring members of the athlete gut microbiome.
Veillonella species metabolize lactate into the SCFAs acetate and propionate via the methylmalonyl-CoA pathway.15 Lactate dehydrogenase (LDH), the enzyme responsible for the first step of lactate metabolism, is present in a phylogenetically diverse group of bacteria (Figure 3B). Querying microbial isolate strain genome annotations from NCBI show that unlike Veillonella atypica, many other microbes are theoretically capable of utilizing lactate through LDH, but do not possess the full pathway to convert lactate into propionate (Figure 3C). Other obligate anaerobes such as Anaerostipes caccae and Eubacterium hallii commonly ferment lactate into butyrate via different pathways (Figure 3C). Eubacterium hallii can also produce propionate, however this has been demonstrated as a biotransformation of 1,2-propanediol, rather than a complete pathway from lactate to propionate. Of note, both the reference genomes on NCBI for Veillonella dispar and Veillonella parvula are not annotated to have the succinate-CoA transferase needed for propionate production to occur; this is likely an annotation error as we validated production of propionate via mass spectrometry on isolates of these species (Supplementary Table 6).
Taken together, these results show that not only is the genus Veillonella enriched in athletes after exercise but the metabolic pathway that Veillonella species utilize for lactate metabolism is also enriched. This result raised the possibility that systemic lactate resulting from muscle activity during exercise may enter the gastrointestinal lumen and become metabolized by Veillonella.
We next sought to determine whether systemic lactate is capable of crossing the epithelial barrier into the gut lumen, as this has not been demonstrated before to our knowledge. To investigate this, we performed tail-vein injection of 13C3 sodium lactate into mice colonized with either Veillonella atypica or Lactobacillus bulgaricus and sacrificed 12 minutes after injection. This time-point was chosen because it was the earliest time at which we observed serum lactate levels return to baseline levels after tail-vein injection in pilot experiments. At sacrifice, we immediately collected serum and plasma following cardiac puncture and collected intestinal luminal contents by removing the colon and cecum from the mice and gently sampling the inner surface of the tissue. By performing liquid-chromatography and mass spectrometry (LC-MS) on these tissues, we were able to identify 13C3-labelled lactate present in both the serum and plasma as well as in the lumen of the colons and ceca (Figure 4B–D, Supplementary Table 7). We were unable to detect any 13C3-labelled propionate in these tissues, however the 12-minute time-point from tail-vein injection to sacrifice is likely insufficient time for labelled lactate crossing the gut barrier to be metabolized into propionate by gut Veillonella.
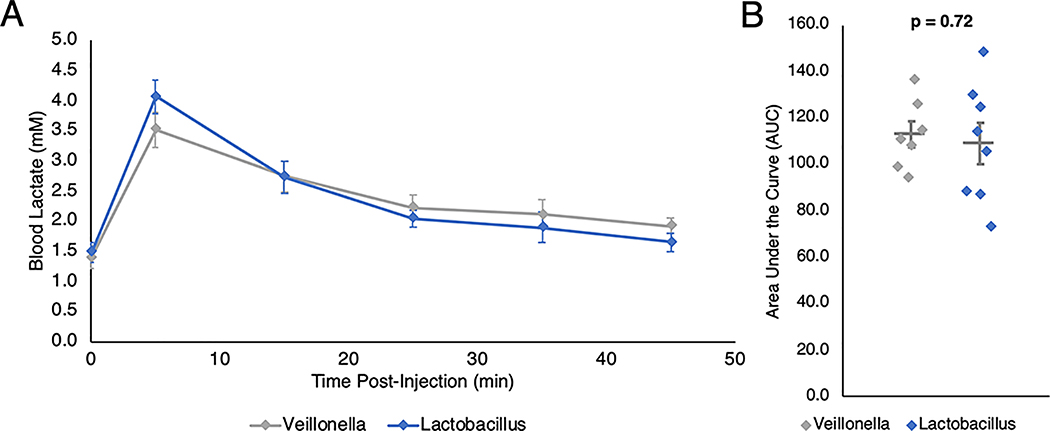
As we have shown that serum lactate is capable of entering the intestinal lumen, we sought to determine whether Veillonella colonization may actively limit blood lactate levels by serving as a metabolic “sink.” To test the capability of Veillonella to accelerate blood lactate clearance in vivo, we performed intraperitoneal injections of sodium lactate in mice colonized with either V. atypica or L. bulgaricus and monitored blood lactate over time. Neither the basal nor the peak lactate levels between the treatment groups were significantly different (Extended Data 10, Supplementary Table 8). The vast majority of lactate processing occurs in the liver16, and although systemic lactate infiltrates the intestinal lumen, we did not observe a change in overall lactate clearance upon inoculation with Veillonella.
Propionate has been shown to increase heart rate, VO2 max, and affect blood pressure in mice17–19 as well as raise the resting energy expenditure and lipid oxidation in fasted humans.20 To test whether the exercise-enhancing effects of Veillonella may be attributable at least in part to propionate, we performed intrarectal instillation of propionate in our mouse treadmill model. Propionate was introduced intrarectally rather than orally because colonic absorption provides a more direct route for propionate to reach systemic circulation, mirroring the location of Veillonella-sourced propionate. Intrarectal propionate instillation (n=8) compared with saline vehicle (n=8) resulted in increased treadmill runtime similar to that of Veillonella atypica gavage (P = 0.03, Figure 4E). As in the Veillonella gavage experiments, we ran the same panel of inflammatory cytokines on serum taken 40 minutes after treadmill running but found no significant differences in cytokine levels (Extended Data 6, Supplementary Table 4). Therefore, introduction of propionate into the colon is sufficient to result in an enhanced exercise phenotype via a mechanism that does not impact the inflammatory cytokines measured.
Coupling computational approaches, multi`omic data collection approaches, and experimental validation looks promising as a method to approach unvalidated metagenomic associations that have been proposed in the past decade. Acting on this principle, we observe: 1) Veillonella abundance increases in the gut microbiome post-exercise in two independent cohorts of athletes; 2) the Veillonella methylmalonyl-CoA pathway is overrepresented in athlete metagenomic samples post exercise; 3) systemic lactate can cross the gut barrier into the lumen of the gut; 4) in a longitudinal AB/BA crossover study in mice, Veillonella inoculation improves treadmill performance; and 5) treadmill performance is improved in mice administered propionate via intracolonic infusion.
These data illustrate a model in which systemic lactate produced during exercise crosses to the gut lumen and is metabolized by Veillonella into propionate in the colon, which in-turn serves to promote performance. Gut colonization of Veillonella may be augmenting the Cori cycle by providing an alternate lactate processing method where systemic lactate is converted into SCFAs that re-enter circulation (Figure 4F). SCFAs are absorbed in the sigmoid and rectal region of the colon as it enters the pelvic plexus, bypassing the liver and draining via the vena cava to reach systemic circulation directly.21 Microbiome-derived SCFAs then augment performance directly and acutely, suggesting that lactate generated during sustained bouts of exercise could be accessible to the microbiome and converted to these SCFAs that improve athletic performance.
In conclusion, we demonstrate for the first time that the microbiome may be a critical component of physical performance and the benefit derived from it. An important question is how this performance-facilitating organism has come to be more prevalent amongst athletes in the first place. We propose that the high-lactate environment of the athlete provides a selective advantage for colonization by lactate metabolizing organisms such as Veillonella. Future studies are needed to help explain why there is an apparent preference for Veillonella and not one of the many other lactate-metabolizing organisms. Veillonella in the physically active host therefore serves as a potential example of a symbiotic relationship in the human microbiome.
Methods
Code Availability Statement
Unless otherwise noted, all plots were generated in R version 3.4.1 with the ggplot2, dplyr, scales, grid, and reshape2 packages.22–26 Large scale data analysis was done on AWS utilizing machines running Ubuntu 16.04. Data curation methods were coded in python version 2.7.12. The Aether package utilized for analysis is available at https://github.com/kosticlab/aether.
Participation recruitment
All study participants were recruited following an IRB approved Sports Genomics protocol (#IRB15–0869), conducted at the Wyss Institute for Biologically Inspired Engineering. Each participant read and signed a consent form prior to study enrollment. We have complied with all relevant ethical regulations.
Sample collection, extraction, and library preparation
As collection materials, study participants were provided a 15ml falcon tube with a 1ml pipette tip inserted inside. Participants were instructed to dip pipette tips into soiled toilet tissue then place back into tubes and label with date and time of collection. Samples were kept at 4°C for short term storage until sample pickup, at which time they were immediately placed onto dry ice, then transferred to a −80°C freezer for long term storage.
Fecal samples were thawed on ice and resuspended into 2–5ml of Phosphate Buffered Saline, of which 250μl was used for DNA extraction using the MOBIO Power Soil high throughput DNA extraction kit, following manufacturer’s protocol. For 16s rDNA library construction, 1–5μl of purified DNA was used for PCR amplification of the V4 variable region using the Q5 hotstart polymerase (NEB). Primers were adapted from the Earth Microbiome Project (http://www.earthmicrobiome.org/), attaching illumina PE adaptors (Forward: CTT TCC CTA CAC GAC GCT CTT CCG ATC TGT GCC AGC MGC CGC GGT AA, Reverse: GGA GTT CAG ACG TGT GCT CTT CCG ATC TGG ACT ACH VGG GTW TCT AAT). illumina barcodes were added to libraries during a second PCR step (Forward: AAT GAT ACG GCG ACC ACC GAG ATC TAC ACT CTT TCC CTA CAC GAC GCT C, Reverse: CAA GCA GAA GAC GGC ATA CGA GAT GTG ACT GGA GTT CAG ACG TGT GCT C) and end products were purified via column (Zymo Research). Individual libraries were quantified and normalized for sequencing using the Quant-It Picogreen reagent (Thermo Fisher). For whole genome shotgun library construction, 1ng of purified DNA was used for illumina’s Nextera XT Tagmentation kit, following manufacturer’s protocol. Libraries were submitted to the Harvard Biopolymers core sequencing facility for bioanalyzer QC and 150 b.p. paired-end sequencing reads using either illumina miseq or Hiseq 2500 (high output mode) for 16s rDNA and shotgun analysis, respectively.
Metadata collection
Each study participant was provided a questionnaire to collect health, dietary, and athletic background information (adapted from The American Gut, http://americangut.org/). Additionally, for each sample collection, study participants filled out a daily annotation sheet to collect dietary, exercise, and sleep information.
16S Analysis
Each subject in our study provided us with fecal samples on a daily basis, up to one week before and one week after the marathon (controls did not run in the marathon but provided fecal samples). We next extracted genomic DNA from these samples and performed 16S rDNA amplicon sequencing followed by bioinformatic analysis to obtain genus level resolution of bacteria in each individual’s microbiome (Supplementary Tables 1 and 2).
16S reads were processed with the dada2 pipeline and phyloseq.27,28 Default settings were used for filtering and trimming. Built in training models were utilized to learn error rates for the amplicon dataset. Identical sequencing reads were combined through dada2’s dereplication functionality and the dada2 sequence-variant inference algorithm was applied to each dataset. Subsequently, paired end reads were merged, a sequence table was constructed, taxonomy was assigned, and abundance was calculated at all possible taxonomic levels.
16S Mixed Effect Modeling in Human Cohort
We constructed a series of generalized linear mixed effect models (GLMMs) to predict Veillonella relative abundance in the marathon participants from both random effects (individual variation per athlete that manifests longitudinally) and fixed effects (USDA MyPlate consumption categories, protein powder supplementation, menstruation status, race, time, BMI, weight, gender, and age).
The longitudinal nature of the microbiome sampling coupled with the unique lifestyles of athletes means that diet, physical characteristics, age, gender, ethnicity, and the menstrual cycle could potentially confound the association between post-marathon state and Veillonella relative abundance.29,30 As some food compounds can selectively increase relative abundance of Veillonella, 1,267 meal records logging every instance of food consumption over the course of the study (Supplementary Table 1) were quantified according to USDA MyPlate and associated with daily microbiome samples. Leave-one-out cross-validation (LOOCV) was performed for the GLMM analysis where the p-value for the time coefficient was calculated for all permutations of eliminating one athlete, which revealed a general trend of no individual athlete driving significance, with one minor outlier (Supplementary Figure 1, Wald Z-tests). To ensure that an arbitrary shuffling of participant labeling would not yield significant results, the GLMM was trained 1000 times on input data with permuted labels, which generated uniformly distributed p-values and shows the significance of the original labeling (Supplementary Figure 1, Wald Z-tests). Thus, the observed significance of the association between Veillonella relative abundance and pre- and post-marathon state is likely not confounded by any fixed effects. To test whether Veillonella has any phenotypic impact on running ability, we next introduced Veillonella to mice in a treadmill experiment.
16S Veillonella relative abundance modeling for athletes participating in the marathon was done with the R nlme package.31 1,267 meal records logging every instance of food consumption over the course of the study were quantified according to USDA MyPlate and associated with daily 16S samples by a nutritionist. Relative abundance was first modeled as:
Abundance = β0 + βTime + βSex + βWeight + βBMI + βAge + βRace + βMenstruation + βVegetables + βFruits + βGrains + βProtein + βDairy + βDietary Protein Supplementation
Subsequently, a second model was generated that included interaction terms of Time:Vegetables and Time:Menstruation. Significance was calculated for all coefficients included in the GLMM with Wald Z-tests (default calculation in the library utilized). Coefficients were were created with the coefplot2 package.32
The code for the two models is provided below.
model_1<-lme(Veillonella~Time+Sex+Weight+BMI+Age+Race+Menstruation+vegetables+fruits+grains+protein+dairy+dietary_protein_supp,random=~1|SubjectID,data=marathon16S)
model_2<-lme(Veillonella~Time+Sex+Weight+BMI+Race+Menstruation+vegetables+fruits+grains+protein+dairy+dietary_protein_supp+Time:vegetables+Time:Menstruation,random=~1|SubjectID, data=marathon16S)
Model predictions overlayed on the underlying data were visualized with the ggplot2 R package.23
Model results were validated with both leave-one-out cross-validation (LOOCV) and permutation testing on shuffled labels.
Preparation of bacteria for gavage
Veillonella atypica and Lactobacillus bulgaricus were grown in 250mL BHI broth supplemented with lactate (10mL 60% sodium lactate/L) and MRS broth, respectively. OD600 was monitored and at OD 0.4–0.6, cells were pelleted by refrigerated centrifugation at 5,000g for 10 min. The pellet was washed in PBS and resuspended in 2mL residual PBS. 100μL aliquots were frozen at −80˚C and CFU/mL measured by serial dilution onto BHI lactate agar plates. Veillonella atypica was gavaged in wild-type C57BL/6 mice to determine viability and transit time through the GI tract, observing peak viable bacterial CFU counts in fecal pellets 5h after gavage.
Treadmill crossover experiment
Animal research was approved by the Joslin Diabetes Center IACUC. We have complied with all relevant ethical regulations. For treadmill experiments, 8–12 week old CL57BL/6 mice (n=32) were acclimated to treadmilling with 2 bouts of 30 minutes of 5 m/min walking, split over 2 consecutive days. For exhaustion measurements, mice were fasted for 7 hours prior to exercise. 6 hours prior to exercise, mice were gavaged with 200μL of 2.5% sodium bicarbonate to neutralize stomach contents, then 20 minutes after the first gavage, mice were gavaged 200μL of either V. atypica or Lb. bulgaricus, prepared as above and normalized to 5×10⁹ CFU/mL. 5 hours post gavage, mice were run on the treadmill, starting at 5 m/min and increasing speed by 1 m/min every minute until exhaustion. Time of exhaustion was recorded for every animal, defined as a mouse failing to return the treadmill from the rest platform after three consecutive attempts to continue running. This protocol was repeated for 2 more days, followed by 4 days of rest and 3 days of crossover treatment. On the first day of treatment, serum was collected 40 minutes post-exhaustion via tail-vein bleed and measured using the Ciraplex multiplex mouse cytokine assay (Aushon BioSystems).
Treadmill Runtime Mixed Effect Modeling
Despite the high number of mice utilized in the AB/BA crossover experiment, comparisons of raw runtime in this context could be confounded both by carryover effect (modeled as a sequence effect) inherent in the longitudinal study design as well as unavoidably high inter-mouse variation. To account for this, we constructed a series of GLMMs predicting runtime (methods). These models incorporate both random effects (individual variation per mouse that manifests longitudinally) and fixed effects (treatment day, treatment sequence, and treatment given). Modeling was conducted with the R nlme package.31 Visualization of coefficients was conducted using the coef2plot R package.32 Visualization of predictions overlayed on data was conducted using the R ggplot2 package.23
Visualization of all longitudinal data points with the GLMM predictions overlayed show both the effect of Veillonella atypica increasing performance on both sides of the crossover when aggregated by treatment group (thick lines) as well as the trends for each of the 32 individual mice (thin lines) (Figure 2B). LOOCV was performed for the GLMM analysis where the p-value for the V. atypica treatment coefficient was calculated for all permutations of eliminating one mouse, which revealed that no individual mice are driving significance (Supplementary Figure 3, Wald Z-tests). To ensure that an arbitrary shuffling of mouse labeling would not yield significant results, the GLMM was trained 1000 times on input data with permuted labels, which generated uniformly distributed p-values and shows the significance of the original labeling (Supplementary Figure 3, Wald Z-tests). This longitudinal modeling approach allows us to interpret that as the treadmill runs are conducted back-to-back each week on subsequent days, the mice in aggregate have decreasing runtimes as time to exhaustion decreases (visible as slope of predictions in Figure 2B), while Veillonella atypica treatment independently increases runtime (visible as crossover of predictions showing Veillonella treatment group having longer time to exhaustion on both sides of the crossover in Figure 2B). To identify possible biological mechanisms of Veillonella effect, we quantified levels of various inflammatory cytokines in the blood immediately following treadmill run. We observed several pro-inflammatory cytokines, including TNFa and IFNg, were significantly reduced in V. atypica-treated mice compared to both baseline and control treatment (Supplementary Figure 6, Supplementary Tables 4 and 13). In a separate experiment, we quantified levels of the muscle glucose transporter GLUT4 to assess effects on muscle physiology but found no difference between V. atypica-treatment and control (Supplementary Figure 7). Altogether, taking into account inter-mouse variation, longitudinal study design, and possible carryover effect in an AB/BA crossover trial, Veillonella atypica treatment causes substantial increases in treadmill runtime in mice.
Models were constructed to predict treadmill runtime in the AB/BA crossover experiment to include treatment effect of Veillonella, period effects (time of treatment), carry-over effects due to the treatment crossover, and effects for naturally occurring mouse variation. In general, we can model expected runtime as:
Sequence: V. atypica → L. bulgaricus Week 1: μ + π1 + αA Week 2: μ + π2 + αB + λA
Sequence: L. bulgaricus → V. atypica Week 1: μ + π1 + αB Week 2: μ + π2 + αA + λB
Where αA and αB are treatment effects, λA and λB are carry-over effects, and π1 and π2 are period effects.
We initially attempted to model carry-over effect as a sequence effect or a period-specific treatment effect (interaction term). The R code for the models is provided below:
model_1<-lme(seconds_run~treatment+sequence+period,random=~1|subject,data=datain)
model_2 <- lme(seconds_run~ Treatment*period,random=~1|subject,data=datain)
By gauging correlation of coefficients, we selected model_1 for the figure in the paper.
Metagenomic Analysis
All steps in the the processing of raw metagenomic data were done utilizing the Aether package.33 Raw reads were de novo assembled using megahit.34 Open reading frames and annotations were generated using prokka35. A gene family catalog was generated from the called open reading frames at 95% identity utilizing the CD-HIT software package.36 A raw abundance count matrix was generated utilizing the gene family catalog, bowtie2, and samtools.37,38 The raw abundance count matrix was normalized both by sample and by gene length.39 Metabolic pathways were queried using MetaCyc and EC IDs were pulled from prokka annotations.35,40 R was utilized to perform the majority of statistical tests with the exception of pairwise ANOVA tests, for which the SciPy library in python was used.41 Root mean square error calculations were performed using the plotrix package.42
Metaphlan2 Taxonomy in Metagenomics Data
Putative taxonomic abundances were calculated with Metaphlan243 and found to have the same association between Veillonella and exercise status as the previous marathon runner results (p=0.03; Supplementary Figure 8)
Annotations
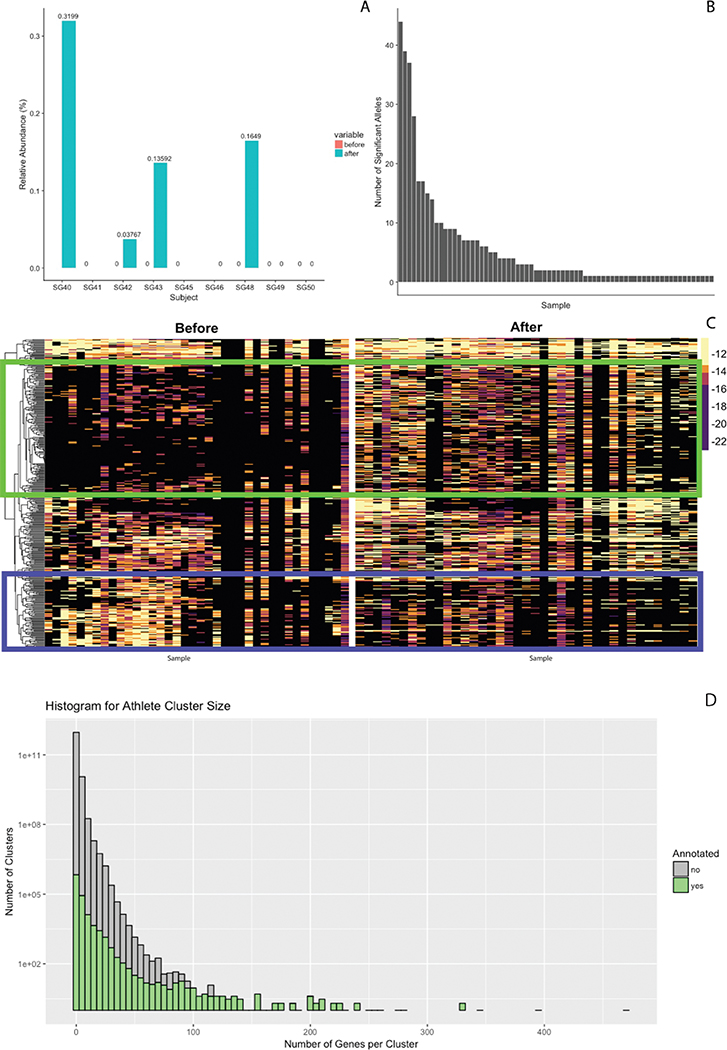
To compare trends in the aggregate microbiome with the metabolic processes of microbes that had elevated 16S abundance in the prior experiment, a pairwise ANOVA was performed on all ~2.3M genes in the catalog to look for significant differences before and after exercise. 396 gene families with unique annotations showed statistically different relative abundance (p < 0.005). While FDR correction did not yield significant individual genes, of these 396 gene families, 391 share functional annotations with the reference assemblies of the V. atypica type strain on NCBI. Of the significant genus level results from the 16S data, Veillonella has extremely high quality assemblies of cultured isolates.
Significant alleles are present in each of the 87 samples (Supplementary Figure 8). Interestingly, when all 396 significant alleles are segregated by exercise state and sample, discordant shifts of relative abundance are observed (Supplementary Figure 8). This suggests changes in global microbiome function associated with Veillonella abundance, and that conserved Veillonella genes may generally play metabolic roles.
Comparative Genomics
Genome annotations were retrieved from NCBI reference genomes. Phylogenetic trees were generated from NCBI taxonomy and visualized with phylo.io.44 Heatmaps were generated with the pheatmap package in R.45
Gene Catalog Creation
Raw reads were processed and de novo assembled into 4,802,186 contigs.33,34 4,792,638 total Open Reading Frames were called, which were subsequently clustered into 2,288,155 gene families with a threshold of 95% identity to create a gene catalog alongside putative annotations assigned by homology.35,36 Of these gene families, 801,307 were assigned annotations and 1,486,948 were putatively classified as hypothetical proteins. Comparing annotation state versus gene family size yields the expected result that larger families, which are likely to be present in more microbes, tend to have many more annotations (Supplementary Figure 8). Raw reads were then aligned back to the gene catalog to create a raw count abundance matrix.37,38 This matrix was normalized both per sample and by gene length to create a relative abundance matrix.39
Pathway Elucidation
Reactions involved with the breakdown of lactate to both propionate and acetate were manually associated with EC IDs using MetaCyc.40
In vitro growth and SCFA analysis
Veillonella species (V. dispar, V. parvula, and V. atypica) were isolated and purified from several study participants and grown in three different media compositions: 1) Brain Heart Infusion Broth (BHI) supplemented with lactate (10mL 60% sodium lactate/L) 2) MRS broth (BD) supplemented with lactate (10ml 60% sodium lactate/L) 3) Semi-synthetic lactate medium (per liter: 5g bacto yeast extract, 0.75g sodium thioglycolate, 25ml basic fuchsin, 21ml 60% sodium lactate, pH 7.5). Veillonella species were inoculated into each medium, under anaerobic conditions, and allowed to grow for 48h to reach stationary phase. After 48h, bacteria were pelleted and supernatants were collected for lactate and SCFA measurements. Approximately 10μl of supernatant was used to measure lactate via the Lactate Scout (Lactate.com). The remaining supernatants were frozen at −80°C and then submitted to the Harvard Small Molecule Mass Spectrometry core facility for butyrate, propionate, and acetate quantitative analysis.
SCFAs identified from the mass spectrometry in all three media conditions corresponded with the propionate end product suggested by the metagenomic results. Acetate was not observed in MRS or BHI, likely due to high existing concentrations in the media making the forward reaction thermodynamically unfavorable. However, acetate production was observed in semi-synthetic lactate media (Supplementary Table 7).
13C3-lactate flux tracing
10 week old C57BL/6 mice were treated with sodium bicarbonate followed by 109 CFU of either Veillonella atypica (n=4) or Lactobacillus bulgaricus (n=4), prepared as above. 20% w/w 13C3 sodium lactate (Cambridge Isotope Laboratories) was diluted with PBS to a concentration of 400mM in PBS. Mice were injected with 100μL intravenously via the tail vein and after 9 minutes anaesthetized with isoflurane. One mouse treated with with Veillonella atypica was unable to be injected due to vein clamping and had to be removed. 10 minutes post-injection, anesthetic was confirmed via foot pinch and mice were sacrificed via cardiac puncture. Whole blood was divided into two samples to obtain both serum and plasma, which was flash frozen in liquid nitrogen at 12 minutes post-injection and stored at −80˚C.
Immediately following cardiac puncture, mice were dissected to remove colon and cecum and the contents were removed by squeezing with sterilized forceps into pre-weighed tubes. Contents were immediately flash frozen in liquid nitrogen. Timing varied slightly, between 17 and 19 minutes post-injection.
Samples were analyzed for lactate and propionate by the Broad Institute Metabolomics Platform. LC-MS metabolomics were performed as previously described.46 LC-MS traces were identified and integrated to quantify presence of 13C0- and 13C3- lactate isotopes.
Colorectal propionate instillation
Treadmilling followed the same protocol as above. Mice were fasted 7 hours prior to exercise, to normalize metabolic profiles. 30 minutes prior to exercise, mice were treated with 200μL of either PBS vehicle alone (n=8) or 150mM sodium propionate in PBS (n=8) using a flexible gavage needle to introduce 200μL of solution into the colon. Mice were run to exhaustion as above. This protocol was repeated for 3 consecutive days. On the first day of treatment, serum was collected 40 minutes post-exhaustion via tail-vein bleed and measured using the Ciraplex multiplex mouse cytokine assay (Aushon BioSystems).
Lactate clearance
To measure lactate clearance rate, mice were first fasted for 7 hours prior to measurement to stabilize basal lactate levels. 5 hours prior to measurement, mice were treated with sodium bicarbonate followed by 109 CFU of either Veillonella atypica or Lactobacillus bulgaricus, prepared as above (n=8). 30 minutes prior to measurement, mice were weighed, individually caged, and a baseline blood lactate reading was taken using a Lactate Scout meter. Mice were administered sodium lactate via IP injection with a dosage of 750mg/kg, prepared as a 75mg/mL solution of sodium lactate in pH7.0 PBS. Blood lactate was monitored with a Lactate Scout meter at 5, 15, 25, 35, and 45 minutes post-injection.
Statistics
Figures 1A and 1B:
Wilcoxon rank sum test with continuity correction were used to look at differences in taxonomic composition before and after exercise. Mean Veillonella abundance is 0.9 orders of magnitude greater 1 day post exercise compared to one hour prior to exercise.
Longitudinal data was modeled with a GLMM approach. In our model, the random effect is individual variation per marathon runner. Fixed effects are shown in Figure 1D. An advantage of this type of statistical analysis is that it can account for the large variation between marathon participants in this type of study.
To determine statistical significance, a Wald Z-test was used to assign p-values to coefficients in the GLMM. No outliers were removed in this analysis.
Each animal was treated with both Veillonella atypica and Lactobacillus bulgaricus as part of the AB/BA crossover. Because all 32 animals were treated twice and compared between treatments, p-value was generated using a paired t-test (p=0.022). The normality assumption was assessed via Shapiro-Wilk’s normality test (p = 0.67), validating the use of the t-test.
Longitudinal data was modeled with a GLMM approach. In our model, the random effect is individual variation per mouse. Fixed effects are treatment effect, period effect (at what time point measurements are made), and carryover/sequence effect (if the order of treatments in the crossover affects later results). An advantage of this type of statistical analysis is that it can account for the large variation between mice in this type of study.
The figure shows seconds run until exhaustion at 6 timepoints, with each of the 32 mice having one measurement per time point. For each treatment order (LLLVVV and VVVLLL) the GLMM is fitted both to each individual mouse (skinny blue and red lines; note that these are all parallel for mice in the same treatment order—the space between these lines represents the “random effect” of natural variation between mice) and all mice (Population) with the same treatment order (thick blue and red lines).
To determine statistical significance, a Wald Z-test was used to assign p-values to coefficients in the GLMM. No outliers were removed in this analysis.
Figure 3A and Supplementary Figure 9:
p-values for individual genes were generated utilizing pairwise ANOVA comparing before and after exercise relative abundance. Non-significant families are associated with homologs common in other microbes that do not change in abundance. To determine the significance of potential overrepresentation, 1,000 global EC IDs were randomly selected and mean difference in relative abundance between samples taken before and after exercise. These EC IDs were used to construct an odds table to determine the probability of having a set of 8 selected EC IDs with increases in mean gene-level relative abundance after exercise. This calculation determined that the relative abundances changes in Figures 3B–3I are significant (p=0.00147 using a Fisher’s Exact Test for count data).
Table 1:
p-values were generated using Welch’s t-test (unequal variances t-test).
p-value was generated using a one-sample t-test. Ratios of labeled/unlabeled lactate from samples were compared to the expected ratio determined mathematically. Each sample was independently compared to the expected ratio, then multiple hypothesis correction was performed using the FDR correction method of Benjamini & Hochberg (1995). (Serum p=0.00001; plasma p=0.00001; cecum content p=0.00001; colon content p=0.001).
p-value was generated using Welch’s t-test (unequal variances t-test). (p=0.028).
Data Availability Statement
All raw sequencing data has been uploaded to NCBI and SRA in the form of the BioProjects PRJNA472785 (16S) and PRJNA472768 (MGX) which are linked to associated BioSamples which are in turn linked to the paired end read files on SRA and correspond to the metadata in the supplement.
Extended Data
Extended Data 1:
A: Histogram of two-sided p-values (Wald-Z tests) for time coefficient from LOOCV models predicting 16S Veillonella abundance. Red line represents p value for model trained without any hold outs. B: Histogram of two-sided p-values for time coefficient from 1000 label permutations in GLMM models predicting Veillonella relative abundance. Red line represents p value for model trained without any label permutation.
Extended Data 2:
A:16S composition in control subjects B:Veillonella relative abundance in control subjects.
Extended Data 3:
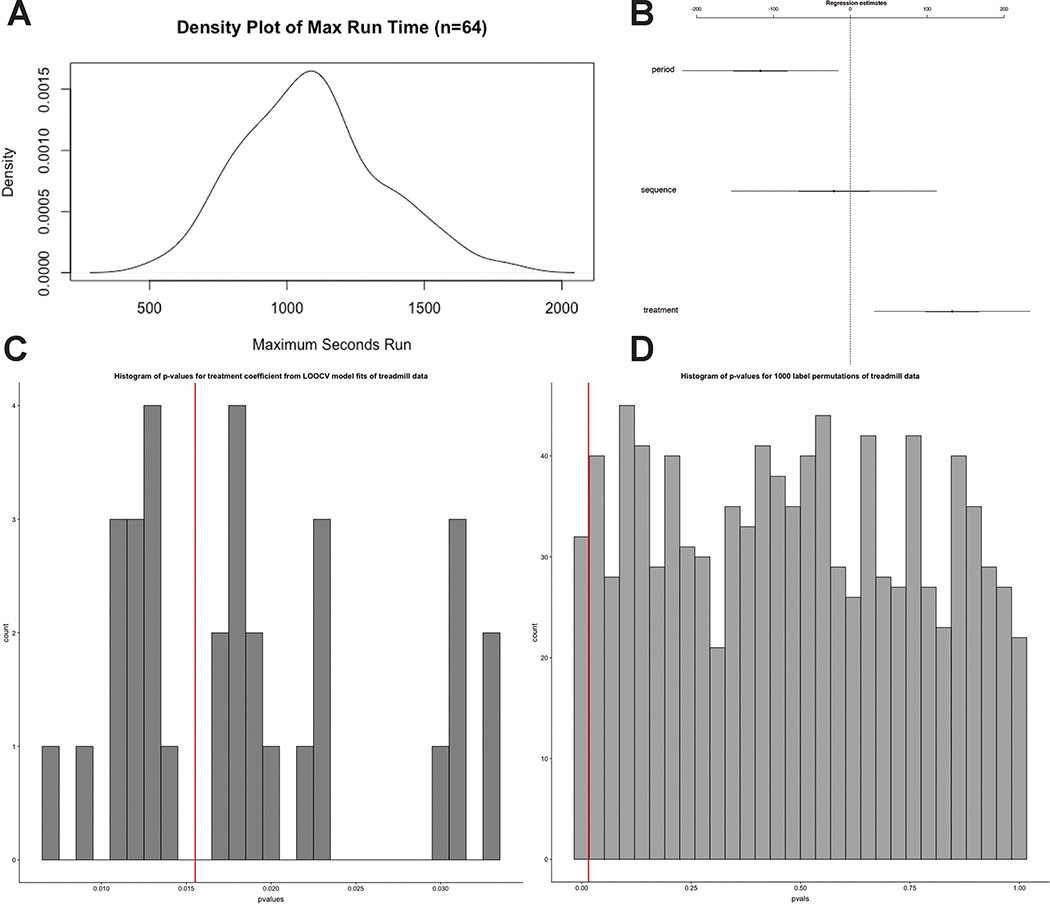
A: Density plot of Max Run Times in AB/BA crossover study. Two-sided Shapiro-Wilk normality test on the max run times for each mouse in each treatment group results in p = 0.67 with a null hypothesis that the distribution of the data is normal (n = 64). B: 95% confidence intervals for coefficient effect on treadmill runtime in AB/BA crossover (Wald-Z tests, n=64). Center values are the regression estimate for each coefficient. Error bars represent the 95% confidence interval. C: Histogram of p-values for treatment coefficient from LOOCV models predicting treadmill runtime. Red line represents p value for model trained without any hold outs (Wald-Z tests, n=64). D: Histogram of p-values for treatment coefficient from 1000 label permutations in GLMM models predicting treadmill runtime. Red line represents p value for model trained without any label permutation (Wald-Z tests, n=64 per permutation).
Extended Data 4:
AB/BA Crossover Study Results Segregated by Individual Mouse. Each of the 32 facets (each representing an individual mouse) has 6 longitudinal treadmill run times plotted (3 pre and 3 post treatment crossover). Shape of points represent treatment sequence. Each mouse facet has two horizontal lines showing mean runtime when dosed Lb. bulgaricus (light blue) and when dosed V. atypica (light red). Each facet has a GLMM fit to all data in a treatment sequence (green), a LOOCV GLMM fit trained on all mice except for the mouse the facet represents (red) and a GLMM fit showing change in intercept related to random effect for each mouse (blue).
Extended Data 5:
Difference in Maximum Run Time between V. atypica gavage periods and L. Bulgaricus gavage treatment periods segregated into “responders” and “non-responders” to V. atypica treatment (n = 32).
Extended Data 6:
A, B: Cytokines after V. atypica and L. bulgaricus gavage. Each mouse sample is represented as an individual point, with the central bar representing the mean and error bars representing s.e.m. (n = 64, 32, and 32, for baseline, L. bulgaricus, and V. atypica, respectively). C, D: Cytokines after intra-rectal propionate instillation. Each mouse sample is represented as an individual point, with the central bar representing the mean and error bars representing s.e.m. (n = 32, 16, and 16, for baseline, L. bulgaricus, and V. atypica, respectively). P values determined using one-way ANOVA followed by Tukey’s post-hoc test.
Extended Data 7:
A: Representative section of western blot showing GLUT4 abundance in pre-exercise states as well as following Lb. bulgaricus and V. atypica gavage. Stain-free control used to normalize densitometry analysis shown. Experiment was performed once (n = 8). B: Fold-change in GLUT4 abundance. Each point represents an individual mouse sample, the center bar represents the mean, and error bars represent s.e.m. (n = 8).
Extended Data 8:
A: Fraction of putative Veillonella relative abundance from metagenomics (calculated utilizing metaphlan2) before and after exercise in rowers and runners. B: Significant alleles (calculated from pairwise ANOVA) that are present in each of the 87 samples. C: Aforementioned 396 significant alleles are segregated by exercise state and sample. D: Histogram comparing non-redundant gene family size size and annotation fraction.
Extended Data 9:
Enzyme-resolution log-transformed relative abundances of differentially abundant non-redundant gene families mapped by EC ID to Methylmalonyl-CoA pathway components. Panel A represents the pathway in aggregate and panels B-I represent individual reactions in the pathway (n=8). This data is represented as a violin plot, which displays the distribution of data as a rotated kernel density distribution.
Extended Data 10:
Lactate clearance following IP injection in mice. A: Mice were gavaged either Veillonella atypica or Lactobacillus bulgaricus and 5 hours later injected with sodium lactate (750 mg/kg). Blood lactate was measured 5 minutes post-injection and every subsequent 10 minutes (n = 8). Points are means ± s.e.m. B: Area under the curve (AUC) was determined for each mouse and compared between treatments. Each mouse is represented as an individual point, with the central bar representing the mean and error bars representing s.e.m. (p = 0.72 using two-sided unpaired t-test, n = 8).
Supplementary Material
Acknowledgments
This work was funded by the Synthetic Biology platform at the Wyss Institute for Biologically Inspired Engineering at Harvard University; National Institutes of Health/National Human Genome Research Institute (NIH/NHGRI) Grant T32 HG002295 (J.M.L.;PI: Park, Peter J.); National Institutes of Health/National Institute of Diabetes and Digestive and Kidney Diseases (NIH/NIDDK) Grant T32 DK007260 (T.A.C.;PI: Blackwell, Thomas K.); a National Science Foundation (NSF) Graduate Research Fellowship Program (GRFP) Fellowship (J.M.L.); National Library of Medicine BIRT Grant T15LM007092 (B.T.T.); an AWS Research Credits for Education Grant (J.M.L. and A.D.K.); a Smith Family Foundation Award for Excellence in Biomedical Research (A.D.K.); an American Diabetes Association (ADA) Pathway to Stop Diabetes Initiator Award (A.D.K.), and National Institutes of Health/National Institute of Diabetes and Digestive and Kidney Diseases (NIH/NIDDK) Diabetes Research Center (DRC) Grant P30DK036836-30 (J.M.L, T.A.C, T.M, B.T.T, L.-D.P., Z.Y, M.C.W, S.L, A.D.K; P.I. King, George L.). We acknowledge Chirag. J. Patel and Shayna R. Stein for their statistical advice and Samir Softic for his assistance with tail vein injections.
Footnotes
Competing Interests Statement
J.S. and G.M.C. are co-founders of FitBiomics, Inc. They and A.D.K. hold equity in FitBiomics, Inc.
References
- 1.Gilbert JA et al. Current understanding of the human microbiome. Nat. Med. 24, 392–400 (2018). [DOI] [PMC free article] [PubMed] [Google Scholar]
- 2.Lax S et al. Longitudinal analysis of microbial interaction between humans and the indoor environment. Science 345, 1048–1052 (2014). [DOI] [PMC free article] [PubMed] [Google Scholar]
- 3.Rothschild D et al. Environment dominates over host genetics in shaping human gut microbiota. Nature 555, 210–215 (2018). [DOI] [PubMed] [Google Scholar]
- 4.Dusko Ehrlich S & The MetaHIT Consortium. MetaHIT: The European Union Project on Metagenomics of the Human Intestinal Tract in Metagenomics of the Human Body 307–316 (Springer, New York, NY, 2011). doi: 10.1007/978-1-4419-7089-3_15 [DOI] [Google Scholar]
- 5.Petersen LM et al. Community characteristics of the gut microbiomes of competitive cyclists. Microbiome 5, 98 (2017). [DOI] [PMC free article] [PubMed] [Google Scholar]
- 6.Clarke SF et al. Exercise and associated dietary extremes impact on gut microbial diversity. Gut 63, 1913–1920 (2014). [DOI] [PubMed] [Google Scholar]
- 7.Garvie EI Bacterial lactate dehydrogenases. Microbiol. Rev. 44, 106–139 (1980). [DOI] [PMC free article] [PubMed] [Google Scholar]
- 8.Truong DT et al. MetaPhlAn2 for enhanced metagenomic taxonomic profiling. Nat. Methods 12, 902–903 (2015). [DOI] [PubMed] [Google Scholar]
- 9.Luber JM, Tierney BT, Cofer EM, Patel CJ & Kostic AD Aether: Leveraging Linear Programming For Optimal Cloud Computing In Genomics. Bioinformatics (2017). doi: 10.1093/bioinformatics/btx787 [DOI] [PMC free article] [PubMed] [Google Scholar]
- 10.Li D, Liu C-M, Luo R, Sadakane K & Lam T-W MEGAHIT: an ultra-fast single-node solution for large and complex metagenomics assembly via succinct de Bruijn graph. Bioinformatics 31, 1674–1676 (2015). [DOI] [PubMed] [Google Scholar]
- 11.Seemann T Prokka: rapid prokaryotic genome annotation. Bioinformatics 30, 2068–2069 (2014). [DOI] [PubMed] [Google Scholar]
- 12.Fu L, Niu B, Zhu Z, Wu S & Li W CD-HIT: accelerated for clustering the next-generation sequencing data. Bioinformatics 28, 3150–3152 (2012). [DOI] [PMC free article] [PubMed] [Google Scholar]
- 13.Qin J et al. A metagenome-wide association study of gut microbiota in type 2 diabetes. Nature 490, 55–60 (2012). [DOI] [PubMed] [Google Scholar]
- 14.van den Bogert B, Boekhorst J, Smid EJ, Zoetendal EG & Kleerebezem M Draft Genome Sequence of Veillonella parvula HSIVP1, Isolated from the Human Small Intestine. Genome Announc. 1, (2013). [DOI] [PMC free article] [PubMed] [Google Scholar]
- 15.Ng SKC & Hamilton IR Carbon dioxide fixation by Veillonella parvula M4 and its relation to propionic acid formation. Can. J. Microbiol. 19, 715–723 (1973). [DOI] [PubMed] [Google Scholar]
- 16.Phypers B & Pierce JMT Lactate physiology in health and disease. Continuing Education in Anaesthesia Critical Care & Pain 6, 128–132 (2006). [Google Scholar]
- 17.Kimura I et al. Short-chain fatty acids and ketones directly regulate sympathetic nervous system via G protein-coupled receptor 41 (GPR41). Proc. Natl. Acad. Sci. U. S. A. 108, 8030–8035 (2011). [DOI] [PMC free article] [PubMed] [Google Scholar]
- 18.Pluznick J A novel SCFA receptor, the microbiota, and blood pressure regulation. Gut Microbes 5, 202–207 (2014). [DOI] [PMC free article] [PubMed] [Google Scholar]
- 19.Pluznick JL et al. Olfactory receptor responding to gut microbiota-derived signals plays a role in renin secretion and blood pressure regulation. Proceedings of the National Academy of Sciences 110, 4410–4415 (2013). [DOI] [PMC free article] [PubMed] [Google Scholar]
- 20.Chambers ES et al. Acute oral sodium propionate supplementation raises resting energy expenditure and lipid oxidation in fasted humans. Diabetes Obes. Metab. 20, 1034–1039 (2018). [DOI] [PMC free article] [PubMed] [Google Scholar]
- 21.Araghizadeh F,Abdelnaby A Anatomy and Physiology in Colorectal Surgery (ed. Bailey HR, Billingham RP, Stamos MJ & Snyder MJ) 3–17 (Elsevier Health Sciences, 2012). [Google Scholar]
Methods-Only References
- 22.Team, R. C. & Others. R: A language and environment for statistical computing. (2013).
- 23.Wickham H & Chang W ggplot2: An Implementation of the Grammar of Graphics. 2015. URL http://CRAN.R-project.org/package=ggplot2. R package version 1, (2015).
- 24.Wickham H & Francois R dplyr: A grammar of data manipulation. R package version 0. 4 3, (2015). [Google Scholar]
- 25.Murrell P The grid graphics package. R News 2, 14–19 (2002). [Google Scholar]
- 26.Wickham H reshape2: Flexibly reshape data: a reboot of the reshape package. R package version. 2012; 1. [Google Scholar]
- 27.Callahan BJ et al. DADA2: High-resolution sample inference from Illumina amplicon data. Nat. Methods 13, 581–583 (2016). [DOI] [PMC free article] [PubMed] [Google Scholar]
- 28.McMurdie PJ & Holmes S phyloseq: an R package for reproducible interactive analysis and graphics of microbiome census data. PLoS One 8, e61217 (2013). [DOI] [PMC free article] [PubMed] [Google Scholar]
- 29.Jurkowski JE, Jones NL, Toews CJ & Sutton JR Effects of menstrual cycle on blood lactate, O2 delivery, and performance during exercise. J. Appl. Physiol. 51, 1493–1499 (1981). [DOI] [PubMed] [Google Scholar]
- 30.Pimentel G et al. Blood lactose after dairy product intake in healthy men. Br. J. Nutr. 118, 1070–1077 (2017). [DOI] [PubMed] [Google Scholar]
- 31.Pinheiro J, Bates D, DebRoy S & Sarkar D R Core Team (2014) nlme: linear and nonlinear mixed effects models. R package version 31–117. Available at http://CRAN.R-project.org/package=nlme (2014). [Google Scholar]
- 32.Bolker BM The coefplot2 package. (2012).
- 33.Luber JM, Tierney BT, Cofer EM, Patel CJ & Kostic AD Aether: Leveraging Linear Programming For Optimal Cloud Computing In Genomics. Bioinformatics (2017). doi: 10.1093/bioinformatics/btx787 [DOI] [PMC free article] [PubMed] [Google Scholar]
- 34.Li D, Liu C-M, Luo R, Sadakane K & Lam T-W MEGAHIT: an ultra-fast single-node solution for large and complex metagenomics assembly via succinct de Bruijn graph. Bioinformatics 31, 1674–1676 (2015). [DOI] [PubMed] [Google Scholar]
- 35.Seemann T Prokka: rapid prokaryotic genome annotation. Bioinformatics 30, 2068–2069 (2014). [DOI] [PubMed] [Google Scholar]
- 36.Fu L, Niu B, Zhu Z, Wu S & Li W CD-HIT: accelerated for clustering the next-generation sequencing data. Bioinformatics 28, 3150–3152 (2012). [DOI] [PMC free article] [PubMed] [Google Scholar]
- 37.Langmead B & Salzberg SL Fast gapped-read alignment with Bowtie 2. Nat. Methods 9, 357–359 (2012). [DOI] [PMC free article] [PubMed] [Google Scholar]
- 38.Li H et al. The Sequence Alignment/Map format and SAMtools. Bioinformatics 25, 2078–2079 (2009). [DOI] [PMC free article] [PubMed] [Google Scholar]
- 39.Qin J et al. A metagenome-wide association study of gut microbiota in type 2 diabetes. Nature 490, 55–60 (2012). [DOI] [PubMed] [Google Scholar]
- 40.Caspi R et al. The MetaCyc database of metabolic pathways and enzymes and the BioCyc collection of pathway/genome databases. Nucleic Acids Res. 38, D473–9 (2010). [DOI] [PMC free article] [PubMed] [Google Scholar]
- 41.Jones E, Oliphant T & Peterson P {SciPy}: Open source scientific tools for {Python}. (2001--).
- 42.Lemon J et al. plotrix: Various plotting functions. URL http://cran.r-project.org/src/contrib/Descriptions/plotrix.html (2007).
- 43.Truong DT et al. MetaPhlAn2 for enhanced metagenomic taxonomic profiling. Nat. Methods 12, 902–903 (2015). [DOI] [PubMed] [Google Scholar]
- 44.Robinson O, Dylus D & Dessimoz C Phylo.io: Interactive Viewing and Comparison of Large Phylogenetic Trees on the Web. Mol. Biol. Evol. 33, 2163–2166 (2016). [DOI] [PMC free article] [PubMed] [Google Scholar]
- 45.Kolde R Pheatmap: pretty heatmaps. R package version 61, (2012). [Google Scholar]
- 46.Fujisaka S et al. Diet, Genetics, and the Gut Microbiome Drive Dynamic Changes in Plasma Metabolites. Cell Rep. 22, 3072–3086 (2018). [DOI] [PMC free article] [PubMed] [Google Scholar]
Associated Data
This section collects any data citations, data availability statements, or supplementary materials included in this article.
Supplementary Materials
Data Availability Statement
All raw sequencing data has been uploaded to NCBI and SRA in the form of the BioProjects PRJNA472785 (16S) and PRJNA472768 (MGX) which are linked to associated BioSamples which are in turn linked to the paired end read files on SRA and correspond to the metadata in the supplement.


