

Abstract
Stable isotope resolved metabolomics (SIRM) is increasingly used among researchers for metabolic studies including amino acids metabolism. However, the classical GC or HPLC-based methods for amino acids quantification do not meet the needs for multiple stable isotope enriched analysis by ultrahigh resolution Fourier transform mass spectrometry (UHR-FTMS). This is due to insufficient acquisition time during chromatographic separations and large dynamic range in concentrations of analytes, which compromises detection and quantification of the numerous metabolite isotopologues present in crude extracts. This chapter discusses a modified ethyl chloroformate derivatization method to enable rapid quantitative analysis of stable isotope enriched amino acids using direct infusion ion introduction coupled with UHR-FTMS.
Keywords: ultrahigh resolution Fourier transform mass spectrometry, amino acids, stable isotope resolved metabolomics, direct infusion nano-electrospray, chloroformate derivatization
1. Introduction
In addition to being the building blocks of proteins, amino acids are required precursors to many bioactive amines and nitrogen donors in amino and amido transferase reactions, and can be oxidized to provide metabolic energy for anabolic metabolism [1]. The mammalian “non-essential” amino acids such as alanine, serine, aspartate and glutamate are the transamination products of central metabolic pathways such as glycolysis and the Krebs cycle. Perturbation of these central pathways may directly or indirectly impact both biosynthesis and utilization of these amino acids [2], which in turn leads to altered cellular functions. Alanine, asparagine, glutamate and glutamine, along with arginine, ornithine and citrulline in the urea cycle, play major roles in nitrogen metabolism. Serine and glycine are important for the “one-carbon metabolism” required for purine ring synthesis. So are glutamine and aspartate the carbon and nitrogen donors in purine and pyrimidine ring synthesis [2,3]. Furthermore, glycine, glutamate and cysteine are precursors for glutathione synthesis, which is important in antioxidation defense that protects cells from damage by reactive oxygen species (ROS), and is also believed to play important roles in cancer cell survival [4–8]. Arginine, ornithine and methionine are precursors of polyamines, which are essential in nucleic acid function and cell stress tolerance [9,10]. Phenylalanine and tyrosine are the precursors of the catecholamine hormones [11], and tryptophan is a source of kynurenine and quinolate among other metabolites [12] of importance to immune functions [13]. It is thus crucial to quantify the amino acids and follow their metabolism to assess changes in cellular function that they participate in.
The metabolic pathway information that can be determined from steady-state concentrations of amino acids is often very limited, as these pathways are often intersecting, i.e. sharing common precursors and products. Therefore, it is essential to enrich selected atoms in given metabolic precursors so that their fates into amino acids can be robustly tracked through metabolic networks.
In recent years, the use of stable isotope, instead of radioisotope, tracers for following metabolic pathways has become increasingly widespread, in part because of their non-hazardous nature requiring no special setup and compatibility with human experimentation. However, the analyses, data processing, and interpretation for stable isotope resolved metabolomics (SIRM) is much more involved. Despite these bottlenecks, SIRM studies with stable isotope-labeled amino acids, such as 13C and/or 15N-labeled glutamine, has become increasingly used among researchers for metabolic study [14–22]. Isotope-sensitive analyses such as nuclear magnetic resonance (NMR) and mass spectrometry (MS) yield not only the chemical identities, but also more critically the biochemical identities (based on labeling patterns) needed to place each metabolite in the pathway context. NMR and MS combined in SIRM studies can achieve wide metabolome coverage for tracking the fate of individual atoms through many transformation pathways in cell, tissues, and living organisms. By determining the positional isotopomer (from NMR) and mass isotopologue distribution (from MS), SIRM provides both pathway tracing and a firm foundation for metabolic flux analysis.
The most commonly used stable isotopes for metabolic tracing are 13C, 2H, 15N and 18O, since C, H, N, O are present in most metabolites and these stable isotopes are easily distinguished from their dominant natural isotopes (12C, 1H, 14N, 16O) by mass spectrometry. Multiplexing different isotopes in precursors makes it possible to discern many more intersecting pathways in a single experiment. For example, using 13C6-glucose and 2H2-glycine enables simultaneous tracing not only glycolysis, the Krebs Cycle, and the pentose phosphate pathway, but also nucleotide synthesis and one-carbon metabolism pathways in a single experiment [2]. In addition, multiplexed stable isotope resolved metabolomics (mSIRM) approach can greatly reduce the number of experiments leading to a large reduction in the biological materials (such as number of mice) required, while minimizing sample-to-sample variation. This is especially crucial when the biological sample size is small and difficult to repeat. A good example is tumor tissues obtained from patient surgery, often with very limited size, plus generally unable to acquire again from the same patient. In such case, the more tracers used simultaneously, the more biochemically relevant information can be obtained.
To enable mSIRM, the ability to distinguish multiple tracer atoms is required. The mass of stable isotopes such as 13C and 15N differs from their most abundant isotopes by the mass of a single neutron, and the measured mass of the additional neutron is slightly different in different elements due to differential nuclear binding energy [23]. The neutron mass differences between 2H/1H, 13C/12C and 15N/14N are 1.006277, 1.003355 and 0.997035 amu, respectively. This complication is actually an advantage for MS-based mSIRM provided that sufficient mass resolution can be achieved to obtain the exact molecular formula of given metabolites, including isotopic composition. Unfortunately, such small mass differences are difficult to distinguish even by “high resolution” mass spectrometry. For example, a molecule with structure -C-C-N-, the common “high resolution” MS with a resolution 60,000, is sufficient to distinguish −12C-12C-14N- and −13C-12C-14N- but it cannot distinguish between −13C-12C-14N- and −12C-12C-15N-. To distinguish such small m/z differences, in practice, “ultrahigh resolution” MS with a minimum resolving power of 200,000 (at 400 m/z, with 10% valley) is required, and even higher resolving power over 400,000 is needed for mSIRM in analyzing biological samples. Fortunately, active developments in mass spectrometers (e.g. Orbitrap and ion cyclotron resonance-based MS) are ongoing to achieve the necessary resolution.
Amino acids can be accurately quantified using dedicated amino acid analyzers. However, these approaches cannot distinguish isotopes [24,25]. Most reported MS-based methods for amino acid analysis combine either gas chromatography or liquid chromatography [26–39]. Some of these methods are well known and are routinely used in many research laboratories. However, when combined with UHR-FTMS for complex multiple stable isotope tracer experiments, chromatography has the following limitations: 1) the duration that each analyte is available for MS analysis is very short, thus limiting mass resolution (e.g. at 400,000 resolving power each mass spectrum can take more than a second to acquire) and essentially eliminating signal averaging. The resulting loss of sensitivity across a chromatographic peak compromises the detection of important isotopologues; 2) the rapidly changing concentrations of metabolites presented to the MS together with the required slow acquisition time may compromise the accurate and reproducible quantification of isotopologues.
In contrast, continuous direct infusion has the advantage of constant analyte concentration presented to MS and permits extensive signal averaging to rapidly provide high quality spectra for reliable quantitative analysis of isotopologues. Among the direct infusion methods, the nano-electrospray ionization source (nano-ESI) has the advantages of high sensitivity, capability of small sample consumption, and negligible sample waste, which is crucial for precious samples of limited sample size. For these reasons, nano-ESI sample introduction coupled with UHR-FTMS has been the choice for mSIRM studies.
Nevertheless, applying the nano-ESI coupled UHR-FTMS method for analyzing amino acids in crude cell or tissue polar extracts is not straightforward. The polar crude extracts of cells or tissues typically have a high salt content that causes ion suppression and instability of ESI ion source, which in turn increases sample size requirement to improve detection and meet the need for re-analyses. Also, current UHR-FTMS models are optimized for analytes with m/z greater than 120, but some amino acids have a molecular weight less than 100 Daltons, which compromises their analysis by UHR-FTMS.
Here we describe a modified ethyl chloroformate (ECF) derivatization method that optimizes analysis of amino acids by UHR-FTMS coupled with nano-ESI. ECF can react with both -NH2 and -COOH groups on amino acids (see Figure 1) to increase their molecular weight, thus making amino acids more amenable for analysis by current UHR-FTMS instruments. Also, after reacting with ECF, the hydrophilic amino acids become hydrophobic derivatives that can be extracted easily with chloroform to reduces the salt content, thus minimizing ion suppression. Furthermore, the ECF derivatization can stabilize some labile metabolites such as glutathione and glutamine, which plays important roles in multiple cellular functions but can be oxidized or degraded under acidic conditions.
Figure 1.
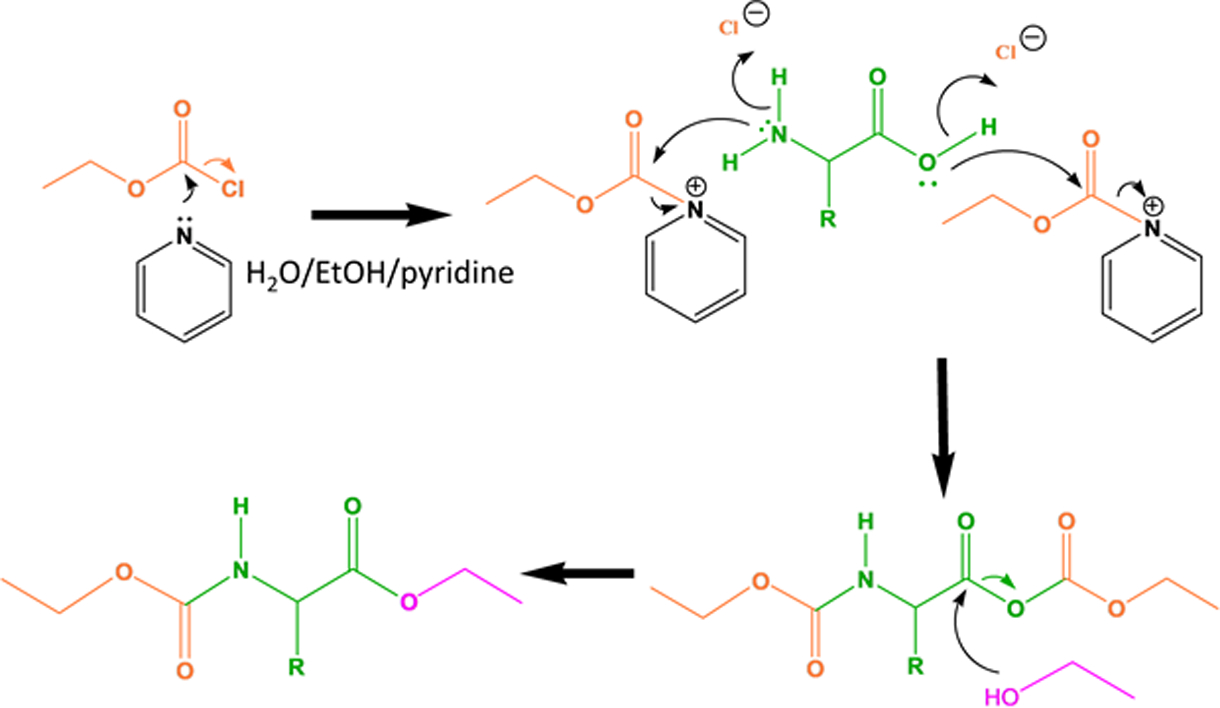
Reaction scheme of ECF derivatization of amino acids [35].
2. Materials
Prepare all solutions using ultrapure water (18 MΩ-cm at 25 °C). All chemicals and solvents are HPLC grade or better. Disposal of chemical waste should be strictly following waste disposal regulations.
2.1. Prepare 0.4 mg/mL uniformly 15N (U-15N) or deuterium (U-2H) labeled amino acid mixture (internal standard which will be spiked into each sample to be analyzed):
Analytical balance (at least 4 decimal places) will be needed.
The U-15N and U-2H labeled amino acid mixture can be purchased from Cambridge Isotope as ‘“cell free” amino acid mix (20 AA). Uniformly deuterium labeled amino acids may also be referred to as U-D amino acids.
Weigh 0.4 mg of the U-15N or U-2H labeled amino acid powder mixture and dissolve in 1 mL ultrapure water to get U-15N or U-2H labeled amino acid mixture solution with concentration at 0.4 mg/mL. (see Note 1)
2.2. Prepare 0.556 mM unlabeled amino acid standard mixture solution (to quantify the spiked amount of each 15N or 2H labeled amino acid internal standards):
Amino acid mixture standard stocks solution can be purchased from Sigma as a 2.5 mM solution in 0.1 N HCl. Store at 4 °C.
Prepare a glutamine stock solution at 1 mM separately by weighing 1.46 mg glutamine powder and dissolving in 10 mL ultrapure water. Store at −20 °C.
Mix 2 μL of 2.5 mM amino acid mixture solution, 2 μL of ultrapure water and 5 μL 1 μmol/mL glutamine solution freshly each time before ECF derivatization to get final concentration of all amino acids at 0.556 mM.
2.3. ECF derivatization and chloroform extraction:
97% or higher grade of ethyl chloroformate.
HPLC grade ethanol, pyridine and chloroform.
1.5 mL Eppendorf tubes.
5 μL, 200 μL pipet and tips.
200 μL round end gel loading tips.
2.0 mL screw top glass vials.
20 mL glass vial for making reaction buffer.
Plastic 15 mL centrifuge tubes for making and storage of 7 M NaOH solution.
Reaction buffer (water/ethanol/pyridine=6:3:1): mix 6 mL ultrapure water, 3 mL ethanol and 1 mL pyridine together in a 20 mL glass vial (see Note 2).
7 M NaOH solution: weigh 2.8 g NaOH in 15 mL plastic tube and add ultrapure water to dissolve to make final volume at 10 mL (see Note 3).
Mini vortex mixer.
Bench top centrifuge.
2.4. MS spray buffer:
Weigh 1.16 mg NaCl and dissolve in 10 mL ultrapure water to produce a 2 mM NaCl stock solution.
Mix 9 mL acetonitrile, 0.9 mL ultrapure water and 0.1 mL 2 mM NaCl solution together to get 90% acetonitrile with 20 μM NaCl.
2.5. Direct infusion mass spectrometry instruments and parameter settings:
Tribrid Fusion Orbitrap (Thermo Scientific), interfaced with an Advion Triversa Nanomate (Advion Biosciences). The maximum ion time for the automatic gain control (AGC) was set at 100 ms, micro scans were set at 5. The Nanomate was operated in positive ion mode at 1.5 kV and 0.5 psi head pressure. Each sample was acquired for more than 5 min with over 50 scans with m/z range 100–1000 selected with quadrupole isolation. For data analysis of each sample, a spectrum was obtained by averaging spectra over the entire acquisition time (see Note 14).
3. Methods
All procedures described below are conducted at room temperature unless indicated otherwise.
Aliquot the cell or tissue polar extract in Eppendorf tubes and freeze dry. For cells extracted from a typical 70–80% confluent 10 cm culturing plate, an aliquot of 1/16 of the total polar phase would be enough for ECF analysis of amino acids (see Note 4).
Carefully pipet in exactly 5 μL of 0.4 mg/mL U-15N or U-2H labeled amino acids standards as internal standards to each sample vial with polar aliquot to be analyzed (see Note 5).
Add 100 μL reaction buffer H2O/ethanol/pyridine (6:3:1 by volume) solution to each sample, tap or vortex sample vials to let sample dissolve and mix well.
Add 5 μL ECF into each sample vial. Electronic multi-pipette can be used at this step if having large number of samples. Cap the vials tightly and vortex on mini-vortex mixer for 30 seconds. During vortexing, be careful to protect the sample from spilling. Then use bench-top centrifuge to spin the sample vials for a few seconds to bring liquid droplets down at vial bottom.
Add 100 μL CHCl3 into each vial. Shake vigorously for 3 min on auto mini-vortex mixer at the highest speed.
Centrifuge at 21,000 g for 10 min at 4 ˚C.
At this step there should be top aqueous layer and bottom chloroform layer in the Eppendorf vials. If the sample contains a protein fraction, a thin layer of protein can also be observed between the aqueous and chloroform layers.
Transfer the bottom CHCl3 layer using gel loading tip carefully into the 2 mL screw cap glass vials. Avoid picking up any of the aqueous layer or protein layer. Cap the glass vial immediately after transfer to avoid sample evaporation.
Add 10 μL 7 M NaOH to the remaining aqueous phase in snap cap vials, to adjust the pH. Carefully swirl the vial to mix the solution in the reaction vials.
Add 5 μL of ECF again into the reaction Eppendorf vials. Repeat step 4–8.
Combine the extracted chloroform layers into 2 mL screw-cap glass vials and vortex for a few seconds to mix sample well.
For UHR-FTMS running, dilute the samples 10-fold with MS spray buffer (90% acetonitrile solution containing 20 μM NaCl).
- To quantify the spiked cell-free U-15N (or U-2H) labeled amino acids, another standard sample should be prepared:
- Pipet 2 μL of the 0.556 mM mixed unlabeled amino acid mixture solution into a 1.5 mL Eppendorf tube.
- Add 5 μL 0.4 mg/mL of U-15N or U-2H labeled cell free amino acids solution into the same Eppendorf tube.
- Repeat steps 4–12.
4. Notes
The 0.4 mg/mL U-15N or U-2H amino acid solution can be aliquoted into multiple smaller volumes stored at −20 °C to minimize the freeze-thaw times. Each sample needs only 5 μL of this 0.4 mg/mL solution to spike. No more than 5 freeze-thaw cycles should be permitted.
Pyridine is toxic and has a very strong odor. Prepare and use the reaction buffer in the fume hood.
Dissolving NaOH in water is strongly exothermic. Use cold water and be aware of the heat generated in the tube. 7 M NaOH is highly corrosive. Always wear proper personal protective equipment (PPE) when handling. It can also corrode glass, so don’t use glass vials for storage, use plastic instead. As it will also react with atmospheric CO2, its potency decreases over time.
The cell or tissue extraction method uses the acetonitrile /water /chloroform extraction method developed by Fan et al [40].
Whether U-15N or U-2H labeled cell free amino acids are used as internal standard should be decided depending on the labeling patterns of sample itself. If the sample that needs to be analyzed only contains 13C labeled isotopologues, (e.g., using 13C6-glucose or 13C3-pyruvate as labeling source when culturing the cells or tissues) then either U-15N or U-2H labeled amino acid standard could be used as internal standard. If the sample uses 13C5, 15N2-glutamine as labeling source, then U-2H labeled amino acid standard should be used, otherwise it will be hard to determine whether the 15N is from sample itself or from the internal standard. Similarly, if the sample uses 2H-glycine as labeling source, only U-15N labeled amino acid standard can be used as internal standard.
ECF is a highly reactive compound and is consequently highly toxic. All ECF reaction procedures should be carried out in a fume hood.
ECF is sensitive to moisture. The containing bottle should be capped immediately after using.
There is large amount of CO2 gas generated during the ECF reaction. It is therefore important to protect the reaction vial lids (such as using lid locks) when vortexing. It may be necessary to briefly spin samples after vortexing to ensure no liquid remains in the vial lid.
Make sure to pipet or weigh very carefully with the labeled and unlabeled amino acid internal standards. This step affects the quantification directly.
Mixing with other amino acids can accelerate the degradation of glutamine. It is important to keep the stock solution of glutamine separately and store at −80°C.
Do not dry the chloroform extract using a vacuum centrifuge to concentrate final products, as the ECF derivatized amino acids are volatile and thus sample losses might occur during vacuum centrifuge.
Dilute the chloroform extract directly with spray buffer.
Avoid using methanol or ethanol in the spray buffer as they have the potential to react with amino acids if there is trace amount of ECF left in extracted buffer.
The instrumental method described here is written for the Thermo Tribrid Fusion Orbitrap. Other spectrometers with sufficient resolution (>400,000 @ m/z=400) can be used, but the detailed instrument settings will differ.
The C, H, N isotopologue peaks are assigned using “PREMISE” (PRecalculated Exact Mass isotopologue Search Engine) [41] based on their accurate m/z values.
The final intensities of the isotopologue peaks have to be corrected for natural abundance distribution [42–44] before further normalization or calculation.
The concentrations of the cell-free U-15N or U-2H labeled amino acids were not clearly specified in the manufacturer’s sheets. However, the concentrations can be determined using an unlabeled amino acid mixture at known concentrations. The concentrations of the spiked cell-free U-15N or U-2H amino acids can be calculated using the peak intensity ratio (after natural abundance correction) between the cell-free labeled amino acids and unlabeled amino acids standards with known concentration. 15N labeled amino acids can also be quantified by 1H NMR, which also provides a cross check on purity.
Using the calculated concentrations of spiked cell-free U-15N or U-2H amino acids and their peak intensity ratio with other isotopologues of amino acids, which are from sample itself, the concentrations of other isotopologues of amino acids in sample can be calculated.
Acknowledgements
This work cwas supported in part by National Institutes of Health grants [5R01ES22191-04, 3R01ES022191-04S1, 1U24DK097215-01A1 and P01 CA163223-01A1].
References
- 1.Rodwell VW, Bender DA, Kennelly PJ, Botham KM, Weil PA Harper’s illustrated biochemistry 30th ed Chp. 29, 30 Lange Medical Books/McGraw-Hill, New York [Google Scholar]
- 2.Yang Y, Fan TW-M, Lane AN, Higashi RM (2017) Chloroformate derivatization for tracing the fate of Amino acids in cells and tissues by multiple stable isotope resolved metabolomics (mSIRM). Anal Chim Acta 976:63–73. doi: 10.1016/j.aca.2017.04.014 [DOI] [PMC free article] [PubMed] [Google Scholar]
- 3.Lane AN, Fan TW-M (2015) Regulation of mammalian nucleotide metabolism and biosynthesis. Nucleic Acids Res 43 (4):2466–2485. doi: 10.1093/nar/gkv047 [DOI] [PMC free article] [PubMed] [Google Scholar]
- 4.Balendiran GK, Dabur R, Fraser D (2004) The role of glutathione in cancer. Cell Biochem Funct 22 (6):343–352. doi: 10.1002/cbf.1149 [DOI] [PubMed] [Google Scholar]
- 5.Chatterjee A, Gupta S (2018) The multifaceted role of glutathione S-transferases in cancer. Cancer Lett 433:33–42. doi: 10.1016/j.canlet.2018.06.028 [DOI] [PubMed] [Google Scholar]
- 6.Traverso N, Ricciarelli R, Nitti M, Marengo B, Furfaro AL, Pronzato MA, Marinari UM, Domenicotti C (2013) Role of glutathione in cancer progression and chemoresistance. Oxid Med Cell Longev 2013:972913. doi: 10.1155/2013/972913 [DOI] [PMC free article] [PubMed] [Google Scholar]
- 7.Robaczewska J, Kedziora-Kornatowska K, Kozakiewicz M, Zary-Sikorska E, Pawluk H, Pawliszak W, Kedziora J (2016) Role of glutathione metabolism and glutathione-related antioxidant defense systems in hypertension. J Physiol Pharmacol 67 (3):331–337 [PubMed] [Google Scholar]
- 8.Sharma R, Yang Y, Sharma A, Awasthi S, Awasthi YC (2004) Antioxidant role of glutathione S-transferases: protection against oxidant toxicity and regulation of stress-mediated apoptosis. Antioxid Redox Signal 6 (2):289–300. doi: 10.1089/152308604322899350 [DOI] [PubMed] [Google Scholar]
- 9.Ha HC, Sirisoma NS, Kuppusamy P, Zweier JL, Woster PM, Casero RA Jr. (1998) The natural polyamine spermine functions directly as a free radical scavenger. Proc Natl Acad Sci U S A 95 (19):11140–11145 [DOI] [PMC free article] [PubMed] [Google Scholar]
- 10.Sagor GH, Berberich T, Takahashi Y, Niitsu M, Kusano T (2013) The polyamine spermine protects Arabidopsis from heat stress-induced damage by increasing expression of heat shock-related genes. Transgenic Res 22 (3):595–605. doi: 10.1007/s11248-012-9666-3 [DOI] [PubMed] [Google Scholar]
- 11.Ng J, Papandreou A, Heales SJ, Kurian MA (2015) Monoamine neurotransmitter disorders-clinical advances and future perspectives. Nature Reviews Neurology 11 (10):567–584. doi: 10.1038/nrneurol.2015.172 [DOI] [PubMed] [Google Scholar]
- 12.Badawy AB-B (2017) Kynurenine Pathway of Tryptophan Metabolism: Regulatory and Functional Aspects Int J Tryptophan Res 10:1–20 [DOI] [PMC free article] [PubMed] [Google Scholar]
- 13.Frumento G, Rotondo R, Tonetti M, Damonte G, Benatti U, Ferrara GB (2002) Tryptophan-derived catabolites are responsible for inhibition of T and natural killer cell proliferation induced by indoleamine 2,3-dioxygenase. J Exp Med 196 (4):459–468 [DOI] [PMC free article] [PubMed] [Google Scholar]
- 14.Fan TW-M, Lorkiewicz PK, Sellers K, Moseley HN, Higashi RM, Lane AN (2012) Stable isotope-resolved metabolomics and applications for drug development. Pharmacol Ther 133 (3):366–391. doi: 10.1016/j.pharmthera.2011.12.007 [DOI] [PMC free article] [PubMed] [Google Scholar]
- 15.Fan TW-M, Lane AN, Higashi RM, Yan J (2011) Stable isotope resolved metabolomics of lung cancer in a SCID mouse model. Metabolomics 7 (2):257–269. doi: 10.1007/s11306-010-0249-0 [DOI] [PMC free article] [PubMed] [Google Scholar]
- 16.Fan TW-M, Lane AN, Higashi RM, Farag MA, Gao H, Bousamra M, Miller DM (2009) Altered regulation of metabolic pathways in human lung cancer discerned by (13)C stable isotope-resolved metabolomics (SIRM). Mol Cancer 8:41. doi: 10.1186/1476-4598-8-41 [DOI] [PMC free article] [PubMed] [Google Scholar]
- 17.Lane AN, Fan TW-M, Bousamra M 2nd, Higashi RM, Yan J, Miller DM (2011) Stable isotope-resolved metabolomics (SIRM) in cancer research with clinical application to nonsmall cell lung cancer. OMICS 15 (3):173–182. doi: 10.1089/omi.2010.0088 [DOI] [PMC free article] [PubMed] [Google Scholar]
- 18.Fan TW-M, Lane AN, Higashi RM (2016) Stable Isotope Resolved Metabolomics Studies in Ex Vivo Tissue Slices. Bio Protoc 6 (3) [DOI] [PMC free article] [PubMed] [Google Scholar]
- 19.Bruntz RC, Lane AN, Higashi RM, Fan TW-M (2017) Exploring cancer metabolism using stable isotope-resolved metabolomics (SIRM). J Biol Chem 292 (28):11601–11609. doi: 10.1074/jbc.R117.776054 [DOI] [PMC free article] [PubMed] [Google Scholar]
- 20.Crooks DR, Maio N, Lane AN, Jarnik M, Higashi RM, Haller RG, Yang Y, Fan TW-M, Linehan WM, Rouault TA (2018) Acute loss of iron-sulfur clusters results in metabolic reprogramming and generation of lipid droplets in mammalian cells. J Biol Chem 293 (21):8297–8311. doi: 10.1074/jbc.RA118.001885 [DOI] [PMC free article] [PubMed] [Google Scholar]
- 21.Maroli A, Nandula V, Duke S, Tharayil N (2016) Stable Isotope Resolved Metabolomics Reveals the Role of Anabolic and Catabolic Processes in Glyphosate-Induced Amino Acid Accumulation in Amaranthus palmeri Biotypes. J Agric Food Chem 64 (37):7040–7048. doi: 10.1021/acs.jafc.6b02196 [DOI] [PubMed] [Google Scholar]
- 22.Metallo CM, Gameiro PA, Bell EL, Mattaini KR, Yang J, Hiller K, Jewell CM, Johnson ZR, Irvine DJ, Guarente L, Kelleher JK, Vander Heiden MG, Iliopoulos O, Stephanopoulos G (2012) Reductive glutamine metabolism by IDH1 mediates lipogenesis under hypoxia. Nature 481 (7381):380–384. doi: 10.1038/nature10602 [DOI] [PMC free article] [PubMed] [Google Scholar]
- 23.Greene GL, Kessler EG Jr., Deslattes RD, Borner H (1986) New determination of the deuteron binding energy and the neutron mass. Phys Rev Lett 56 (8):819–822. doi: 10.1103/PhysRevLett.56.819 [DOI] [PubMed] [Google Scholar]
- 24.Moore S, Stein WH (1951) Chromatography of amino acids on sulfonated polystyrene resins. J Biol Chem 192 (2):663–681 [PubMed] [Google Scholar]
- 25.Jia M, Keutgen N, Matsuhashi S, Mitzuniwa C, Ito T, Fujimura T, Hashimoto S (2001) Ion chromatographic analysis of selected free amino acids and cations to investigate the change of nitrogen metabolism by herbicide stress in soybean (glycine max). J Agric Food Chem 49 (1):276–280 [DOI] [PubMed] [Google Scholar]
- 26.Schummer C, Delhomme O, Appenzeller BM, Wennig R, Millet M (2009) Comparison of MTBSTFA and BSTFA in derivatization reactions of polar compounds prior to GC/MS analysis. Talanta 77 (4):1473–1482. doi: 10.1016/j.talanta.2008.09.043 [DOI] [PubMed] [Google Scholar]
- 27.MacKenzie SL, Tenaschuk D, Fortier G (1987) Analysis of amino acids by gas-liquid chromatography as tert.-butyldimethylsilyl derivatives. Preparation of derivatives in a single reaction. J Chromatogr 387:241–253 [DOI] [PubMed] [Google Scholar]
- 28.Goh CJ, Craven KG, Lepock JR, Dumbroff EB (1987) Analysis of all protein amino acids as their tert.-butyldimethylsilyl derivatives by gas-liquid chromatography. Anal Biochem 163 (1):175–181 [DOI] [PubMed] [Google Scholar]
- 29.Husek P (1991) Amino acid derivatization and analysis in five minutes. FEBS Lett 280 (2):354–356 [DOI] [PubMed] [Google Scholar]
- 30.Inagaki S, Toyo’oka T (2012) Amino acid analysis via LC-MS method after derivatization with quaternary phosphonium. Methods Mol Biol 828:47–54. doi: 10.1007/978-1-61779-445-2_5 [DOI] [PubMed] [Google Scholar]
- 31.Rebane R, Oldekop ML, Herodes K (2012) Comparison of amino acid derivatization reagents for LC-ESI-MS analysis. Introducing a novel phosphazene-based derivatization reagent. J Chromatogr B Analyt Technol Biomed Life Sci 904:99–106. doi: 10.1016/j.jchromb.2012.07.029 [DOI] [PubMed] [Google Scholar]
- 32.Sakaguchi Y, Kinumi T, Yamazaki T, Takatsu A (2015) A novel amino acid analysis method using derivatization of multiple functional groups followed by liquid chromatography/tandem mass spectrometry. Analyst 140 (6):1965–1973. doi: 10.1039/c4an01672f [DOI] [PubMed] [Google Scholar]
- 33.Rebane R, Rodima T, Kutt A, Herodes K (2015) Development of amino acid derivatization reagents for liquid chromatography electrospray ionization mass spectrometric analysis and ionization efficiency measurements. J Chromatogr A 1390:62–70. doi: 10.1016/j.chroma.2015.02.050 [DOI] [PubMed] [Google Scholar]
- 34.Jambor A, Molnar-Perl I (2009) Amino acid analysis by high-performance liquid chromatography after derivatization with 9-fluorenylmethyloxycarbonyl chloride Literature overview and further study. J Chromatogr A 1216 (15):3064–3077. doi: 10.1016/j.chroma.2009.01.068 [DOI] [PubMed] [Google Scholar]
- 35.Mudiam MK, Ratnasekhar C, Jain R, Saxena PN, Chauhan A, Murthy RC (2012) Rapid and simultaneous determination of twenty amino acids in complex biological and food samples by solid-phase microextraction and gas chromatography-mass spectrometry with the aid of experimental design after ethyl chloroformate derivatization. J Chromatogr B Analyt Technol Biomed Life Sci 907:56–64. doi: 10.1016/j.jchromb.2012.08.035 [DOI] [PubMed] [Google Scholar]
- 36.Qiu Y, Su M, Liu Y, Chen M, Gu J, Zhang J, Jia W (2007) Application of ethyl chloroformate derivatization for gas chromatography-mass spectrometry based metabonomic profiling. Anal Chim Acta 583 (2):277–283. doi: 10.1016/j.aca.2006.10.025 [DOI] [PubMed] [Google Scholar]
- 37.Fabiani A, Versari A, Parpinello GP, Castellari M, Galassi S (2002) High-performance liquid chromatographic analysis of free amino acids in fruit juices using derivatization with 9-fluorenylmethyl-chloroformate. J Chromatogr Sci 40 (1):14–18 [DOI] [PubMed] [Google Scholar]
- 38.Vancompernolle B, Croes K, Angenon G (2016) Optimization of a gas chromatography-mass spectrometry method with methyl chloroformate derivatization for quantification of amino acids in plant tissue. J Chromatogr B Analyt Technol Biomed Life Sci 1017-1018:241–249. doi: 10.1016/j.jchromb.2016.02.020 [DOI] [PubMed] [Google Scholar]
- 39.Kvitvang HF, Kristiansen KA, Lien SK, Bruheim P (2014) Quantitative analysis of amino and organic acids by methyl chloroformate derivatization and GC-MS/MS analysis. Methods Mol Biol 1198:137–145. doi: 10.1007/978-1-4939-1258-2_10 [DOI] [PubMed] [Google Scholar]
- 40.Fan TW-M, Lane AN, Higashi RM (2012) Chapter 2: considerations of sample preparation for metabolomics investigation. The Handbook of Metabolomimcs, Springer Protocols [Google Scholar]
- 41.Lane AN, Fan TW-M, Xie Z, Moseley HN, Higashi RM (2009) Isotopomer analysis of lipid biosynthesis by high resolution mass spectrometry and NMR. Anal Chim Acta 651 (2):201–208. doi: 10.1016/j.aca.2009.08.032 [DOI] [PMC free article] [PubMed] [Google Scholar]
- 42.Moseley HN (2010) Correcting for the effects of natural abundance in stable isotope resolved metabolomics experiments involving ultra-high resolution mass spectrometry. BMC Bioinformatics 11:139. doi: 10.1186/1471-2105-11-139 [DOI] [PMC free article] [PubMed] [Google Scholar]
- 43.Carreer WJ, Flight RM, Moseley HN (2013) A Computational Framework for High-Throughput Isotopic Natural Abundance Correction of Omics-Level Ultra-High Resolution FT-MS Datasets. Metabolites 3 (4). doi: 10.3390/metabo3040853 [DOI] [PMC free article] [PubMed] [Google Scholar]
- 44.Fernandez CA, Des Rosiers C, Previs SF, David F, Brunengraber H (1996) Correction of 13C mass isotopomer distributions for natural stable isotope abundance. J Mass Spectrom 31 (3):255–262. doi: 10.1002/(SICI)1096-9888(199603)31:3<255::AID-JMS290>3.0.CO;2-3 [DOI] [PubMed] [Google Scholar]