

Abstract
The hippocampal formation (HF) has an important role in different human capacities, such as memory processing and emotional expression. Both extensive changes and limited variations of its components can cause clinically expressed dysfunctions. Although there remains no effective treatment for diseases caused by pathological changes in this brain region, detection of these changes, even minimally, could allow us to develop early interventions and establish corrective measures. This study analysed the neuronal islands of layer II of the entorhinal cortex (EC), the neuronal clumps of the external principal layer of the presubiculum (PrS) and the dentate granule cells of the dentate gyrus (DG), which represent the prominent structural regions within the HF circuit. Subjects from two age groups (younger or older than 65 years) were studied and their neuronal size assessed by the point‐sampled intercepts stereological method. The quantitative estimate was a volume of roughly 8,500 µm3 for EC layer II neurons, and DG granule neurons and presubicular neurons were five and 10 times smaller, respectively. The older age group showed a increase of 2%, 18% and 28% with respect to the younger group in the PrS, DG and EC regions, respectively. None of these regions showed interhemispheric differences. This quantitative estimation is relevant because the observed variance in the estimates suggests that biological variation is the main contributory factor, with intercepts and measurements having a smaller impact. Therefore, we suggest that age has a limited influence on neuronal volume variation in these HF regions, which needs to be compared with similar measurements in neurodegenerative disorders such as Alzheimer’s.
Keywords: ageing, dentate gyrus, entorhinal cortex, human hippocampal formation, point‐sampled intercepts method, presubiculum, stereology
The in the PrS and DG hippocampal regions was not significantly influenced by age, but the neuronal volume of the islands of layer II of the EC was greater in the older age group. The higher variance in the estimates (with a coefficient of variation of 19%, 33%, and 18% for EC, PrS and DG, respectively) was mainly due to biological variation.
1. INTRODUCTION
The human temporal lobe (HTL) is a heterogeneous region consisting of cortical and subcortical areas which differ from cytoarchitectonic and phylogenetic points of view. In its medial aspect lies the hippocampal formation (HF), which includes the dentate gyrus (DG), the cornu ammonis fields (CA1, CA2 and CA3), the subiculum (Sb), presubiculum (PrS), parasubiculum (PaS) and the entorhinal cortex (EC) (Van Hoesen, 1995; Amaral and Lavenex, 2007; Insausti and Amaral, 2012; Delgado‐González et al., 2015). This region is essential for declarative memory processing, facilitating its long‐term storage through a wide network of connections (Figure 1). Axons of neurons in layer II of the EC project towards the molecular layer of the DG, the latter sending projections to the CA3 cells, which transfer the information to the CA1 neurons across CA2 and, in turn, through the Sb, PrS and PaS, send projections to deeper layers of the EC (Schultz and Engelhardt, 2014). Finally, the information output is passed along to various neocortical regions (Buzsaki, 1996; Muñoz and Insausti, 2005; Amaral and Lavenex, 2007).
FIGURE 1.

Coronal section of the HF corresponding to a case under study. All regions and main circuits are represented: DG, dentate gyrus; Cornu Ammonis CA3, CA2 and CA1; Sb, PrS, and PaS, subiculum, presubiculum and parasubiculum; EC, entorhinal cortex; LV, lateral ventricle; cs, collateral sulcus; hf, hippocampal fissure; f, fimbria
The information channelled through the HF can be modified or altered at any point along this route. As a consequence, neurons may respond with morphological changes, and neuronal changes can cause dysfunction in the hippocampal circuit (Braak and Braak, 1995, 1997). Both contingencies result in variations of neuronal shape and size configuration that can be revealed through quantitative studies. Neurodegenerative diseases lead not only to damage in the HF generating a reduced thickness of the region, but also, more significantly, to an important decrease in neuronal populations (Price et al., 2001; Artacho‐Pérula and Insausti, 2007). These neuronal changes could be present in normal ageing or in the initial phases of neurodegenerative processes, while showing little clinical symptomatology. However, the geometry of the hippocampal neurons is affected and this may be detected by precise quantitative analyses that have been widely used in the neurosciences (West and Gundersen, 1990; Rapp et al., 1996; West and Slomianka, 1998; Slomianka and West, 2005) in the successful assessment of different neurodegenerative processes.
The neuronal islands of layer II of the entorhinal cortex (EC), the neuronal clumps of layer II of the presubiculum (PrS) and the granule cells of the dentate gyrus (DG) are very prominent and distinct fields in the HF, configuring zones with a detectable cytoarchitecture. Our study aimed at analysing neuron body size using stereology in young (< 65 years) and older age groups (> 65 years). The study assessed 11 cases (six under 65 years, and five over 65 years), none of which had a record of neurological or psychiatric disorders. This simple stereological methodology could be of help in different studies, complementing other methods of analysis.
2. MATERIALS AND METHODS
2.1. Materials
This study used brain samples (n = 11) with no clinical record of neurological or psychiatric diseases, taken from the archives of the Human Neuroanatomy Laboratory (HNL) of the University of Castilla‐La Mancha. All case studies were approved by the Ethical Committee of the Albacete University Hospital. The material was divided into two groups according to age (LT65y, < 65 years, n = 6; and GT65y, > 65 years, n = 5). A summary of the demographic data is shown in Table 1.
TABLE 1.
Cases included in the study
| Group | Case | Age (y) | Sex | Cause of death |
|---|---|---|---|---|
| LT65y | HN_1 | 23 | Male | Drop and cardiorespiratory arrest |
| HN_2 | 40 | Male | – | |
| HN_3 | 40 | Female | Diabetes mellitus | |
| HN_7 | 38 | Male | Suicide | |
| HN_9 | 24 | Male | Sudden death | |
| HN_11 | 58 | Female | Coeliac disease, diffuse intestinal infiltration | |
| GT65y | HN_4 | 90 | Male | Lymphoma |
| HN_5 | 83 | Female | Colon cancer | |
| HN_6 | 84 | Male | Pulmonary thromboembolism | |
| HN_8 | 82 | Male | Heart disease, acute bacteraemia | |
| HN_10 | 78 | Female | Sepsis |
The postmortem period before brain fixation was, on average, 10 hr, ranging between 4 and 14 hr according to the Pathology Department protocol. The brain samples were fixed in 10% formalin for a variable time period (between 3 and 4 weeks), after which, upon arrival at the HNL, they were transferred to a 4% paraformaldehyde in phosphate buffer (PB, 0.1 M, pH 7.4) for at least 1 month. Subsequently, each brain hemisphere was cut into several slabs ~ 1 cm thick, orthogonal to the anterior‐posterior intercommissural line (AC‐PC) (Figure 2). The anterior and posterior surfaces of each slab were photographed prior to the cutting phase. Slabs were immersed in a cryoprotectant solution of 10% glycerol and 2% dimethylsulphoxide in phosphate buffer (pH 7.2) for 3 days, and then in 20% glycerol an additional 5 days. They were rostrocaudally arranged and each slab containing the regions of interest was coronally sliced (50 µm thick) using a sliding microtome (Micron® HM400) coupled to a freezing unit. Every 10th section (with a spacing of 500 µm) was Nissl‐stained with thionin for histological examination after several initial steps that included tissue defatting and dehydrating, before coverslipping with DPX mounting medium. The remaining sections were kept in tissue‐collecting solution for future studies. All sections were scanned to register the HF regions after cytoarchitectonic evaluation (Figure 3). All slab surfaces and the first or last full sections of the corresponding thionin‐stained slabs were analysed to evaluate shrinkage (measuring and comparing the x‐ and y‐axes and the total area of each slab and section) (Figure 4).
FIGURE 2.

Medial aspect of a brain hemisphere: The line drawn corresponds to the anterior‐posterior intercommissural line (AC‐PC) as well as the cutting plane for medial temporal lobe sections (1 cm thick). The slabs for both hemispheres were rostrocaudally arranged and digitalised. Hp, hippocampus; cs, collateral sulcus; rs, rhinal sulcus
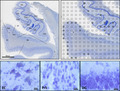
FIGURE 3.

Medial temporal lobe section with HF regions indicated. On the right, systematic sampling of the different HF regions for selection of fields of vision (40× objective). Field sampling in islands of layer II of the EC, neuronal clumps of layer II of the PrS, and granule neurons of the DG, are showed in grey (enlarged fields are shown at the bottom)
FIGURE 4.

Top: Block #3, posterior surface, case HN3201, shows simple measurements (x‐ and y‐planes and total area of the slab) after calibration (ruler showed). Bottom: Same case and block (section 26 of 28) with very similar measurements after calibration (millimetre ruler is showed). imagej® software was used for measurements
2.2. Stereological study
The neuronal volume of the EC, PrS and DG regions was estimated on four histological preparations systematically selected along the HF rostrocaudal axis (on average, 1 in every 15 sections). Fields of vision were systematically sampled in each section (Figure 3). Neuronal volume measurements were made in a plane located approximately at the middle of the thickness section (the z‐axis equator). All fields of vision chosen for sampling were digitised (40× objective, using Olympus NewCAST®), with a final magnification of 1000×. The soma size of the neurons (islands of layer II of the EC, neuronal clumps of layer II of the PrS, and the dentate granule cells of the DG) was estimated using the unbiased point‐sampled intercepts method (PSI; Gundersen and Jensen, 1985) to obtain the volume‐weighted mean neuronal volume (Figure 5). On each microscopic field of vision, a test system composed of regularly spaced test points associated with test lines was randomly superimposed. The application of this quantitative procedure to our samples was limited because the rostrocaudal sectional plane was preserved and therefore it was impossible to rotate sections in 3D. We maintained this plane of section in accordance with the common and routine rules for preparing brain tissue. In addition, the use of different rotation angles in 3D, especially when the coronal plane is lost, entails great difficulties in obtaining accurate identifications in all hippocampal regions.
FIGURE 5.

A sampled field of vision (EC) illustrating the volume‐weighted mean neuronal volume estimation method. Each test point hitting a neuronal soma (black points) is used to measure the length of the intercepts (l); if two or more points hit the same soma, the measurement is made for each test point. Finally, the stereological formula used for estimating the is shown. The image to the right shows the NewCAST® equipment for stereological quantitation used, including an Olympus BX51 microscope, a DP72 camera, a set of motors and a microcator
2.3. Statistical analysis
A descriptive analysis (mean ± SD, SEM and coefficient of variation) was calculated for both groups and in both hemispheres. The contribution to the overall observed variance of estimates from each level of sampling was obtained by the method of nested analysis of variance (Gundersen and Osterby, 1981). Data between brain hemispheres and aged groups were analysed using Student’s t‐test (paired and independent data, respectively). Also, the was compared between EC, PrS and DG using ANOVA and the exact Friedman non‐parametric test. Data analyses were carried out using the SPSS/PC programme, v.23.
3. RESULTS
The results of the study showed a variation in the neuronal volume estimates in the different HF regions analysed. The neuronal volume of the islands of layer II of the EC was roughly five times greater than that of the granule neurons of the DG. Also, granule cells of the DG are twice the neuronal volume of the granule cells of the PrS lamina principalis externa. The statistical analysis, as expected, indicated significant differences in neuronal size between EC layer II neurons and those in the PrS and DG regions (Figure 6, Table 2).
FIGURE 6.

Plot of the for both groups (LT65y and GT65y) for each region of the HF (EC, PrS and DG). Data represent each case and the mean ± SD. (The y‐axis is at the same value to establish comparisons between hippocampal regions.) Statistics between LT65y and GT65y: *p < .05, NS, not significant
TABLE 2.
Results of the
| Region | Group | Hemisphere | Neuronal volume (µm3) |
|---|---|---|---|
| EC | LT65y | Left | 8,069 ± 2,015 (823) |
| Right | 6,641 ± 1,519 (620) | ||
| GT65y | Left | 9,330 ± 1,530 (684) | |
| Right | 9,490 ± 983 (439) | ||
| PrS | LT65y | Left | 1,021 ± 432 (176) |
| Right | 948 ± 276 (113) | ||
| GT65y | Left | 950 ± 180 (81) | |
| Right | 1,050 ± 452 (202) | ||
| DG | LT65y | Left | 1,438 ± 172 (70) |
| Right | 1,745 ± 196 (80) | ||
| GT65y | Left | 1,877 ± 436 (195) | |
| Right | 1,894 ± 506 (226) |
Data are mean ± SD (SEM).
The values in the GT65y cases increased 28%, 2% and 18% with respect to the LT65y in the EC, PrS and DG regions, respectively. The only significant differences found were in the EC region (t = 2.41; p < .05) (Figure 6). In contrast, hemispheric differences had no effect on the volume‐weighted mean neuronal volume estimates in the three regions analysed (Figure 7).
FIGURE 7.

Plot of the for brain hemispheres (HD, right; HI, left) for each HF region. Lines represent corresponding hemispheres for each analysed case (mean ± SD are indicated)
Figure 8 shows the contribution from different levels of sampling to the total observed variance associated with estimates between the different regions of the HF and between the two age groups. The greatest contribution was attributed to differences between individuals (i.e. biological differences), with an average value of 78%. The contribution due to intercepts and measurements was negligible (3.8%). The variance contribution of sections increased from 1.5% to 5.7% to 8.9% for the EC, PrS and DG regions, whereas the fields of vision contribution fluctuated between 9.2% and 15.7%.
FIGURE 8.

Sources of variation in the volume‐weighted mean volume of the neuronal somas. Top: Contributions for each region of the HF. Bottom: Contributions for each age group. Data show items and percentages. In all cases, biological variation is the main contributor to the variance of
4. DISCUSSION
The relevance of the HF in neurodegenerative processes characterised by memory deficits is beyond doubt (Andersen et al., 2007; Hannula and Duff, 2017). Thus, the quantitative features of neurons in these allocortical and periallocortical regions and their association with ageing and with neurodegenerative lesions are extremely valuable and can be measured using objective quantitative tools. These tools can identify small changes in the structure of HF regions in the medial temporal lobe. In this regard, numerous studies have carried out morphometric and stereological estimations of the HF, revealing a non‐significant reduction in hippocampal volume with ageing (with only the 76‐ to 85‐year‐old group showing a marked decrease in volume) (Lupien et al., 2007). Meanwhile, Simic et al. (1997) found an inverse relationship between age and the number of neurons in CA1 and subiculum, but not in other subdivisions. Anatomically, the head and body of the hippocampus show significant volume reductions in older age, but this is not the case for the hippocampal tail (Rajah et al., 2010). Frisoni et al. (2010) have suggested that hippocampal atrophy is a sensitive marker of Alzheimer’s, whereas West et al. (1994), Rossler et al. (2002) and Pakkenberg et al. (2003) reported that neuron loss during ageing is a weak contributor to tissue atrophy. When studying the EC, Yanpei et al. (2019) observed that volume, thickness and surface area initially increased with age, reaching a peak at about 30–50 years of age, after which they started to decrease.
However, few studies have assessed neuronal volume in the hippocampus. Simic et al. (1997) reported a negative correlation of HF neuronal volume (without EC) with age in normal subjects, and a notable reduction (32%) in Alzheimer’s cases compared with controls. Additionally, Gemmell et al. (2012) have suggested that dementia produces hippocampal neuron atrophy in both cerebrovascular and neurodegenerative diseases. Lavenex et al. (2009) and Hosseini‐Sharifabad and Nyengaard (2007) studied DG granule cells in primates and rats, respectively; their data, obtained using the nucleator method, yielded values of around 700 µm3 (slightly lower in primates). In rhesus monkeys, Piguet et al. (2018) reported values of roughly 2,500 µm3 for soma size in EC layer II neurons. Also, Wegiel et al. (2014) described small variations in neuronal volume in the EC, as well as in other brain regions, associated with age. Wegiel et al. (2015) examined seven young humans (average age 22 years) and reported a slightly lower volume in EC layer II neurons than in our study; their data indicated values of 5,116 ± 1,960 µm3. These variations in neuronal size could be due to the age differences of the samples but also to the methodology used, as our study used volume‐weighted estimates that have a tendency to overestimate volume as compared with number‐weighted methods. In other words, in volume‐weighted estimates, larger particles (neurons) are more likely to be cut during tissue preparation than are those of smaller size and therefore have a higher probability of being sampled. Other studies have used the nucleator stereological method (Gundersen, 1988; Gundersen et al., 1988; Delgado‐González et al., 2015) for estimating neuronal volume in those cases where there was a previous selection of neurons, thus limiting the probability of sampling larger‐sized ones (number‐weighted); these studies used the disector technique to count the total number of particles in a precise volume (Sterio, 1984; Gundersen et al., 1988). Thus, volume‐weighted estimates are larger than number‐weighted ones . On the other hand, our study reveals few changes in neuronal volume during ageing and only a slight increase in EC neurons in the older group. Several studies (Merrill et al., 2000; Wegiel et al., 2015) on primates and humans have reported that age has no influence in estimations of neuronal size. In contrast, the consequence of neurodegenerative processes such as Alzheimer’s is a notable (28%) decrease in neuronal volume (Artacho‐Pérula and Insausti, 2007).
Stereological studies can be influenced by tissue shrinkage or deformation when both number and object size are assessed. Many studies have dealt with this issue (Haug et al., 1981, 1984; Andersen and Gundersen, 1999; Dorph‐Petersen et al., 2001; West, 2013; Matenaers et al., 2018). Tissue shrinkage or deformation (in our study, brain tissue) is a difficult problem to resolve and predict. Delays in postmortem tissue collection, formalin fixation, cutting and embedding material, and dehydration or mounting methods all can introduce tissue changes, and other factors such as age could also have an effect. Also, it is very difficult to establish the response of each tissue component, as each one could have responded differently. Dorph‐Petersen et al. (2001) and West (2013) explored ways of reducing the impact of these changes. Both studies evaluated deformation in the x‐ and y‐planes, and z‐axis shrinkage. In our material, remarkable thickness shrinkage after histological processing was found (about 40%–60%, E. Artacho‐Pérula, unpubl. data). The use of glycol methacrylate embedding is a possible solution, as shrinkage is minimal (Gerrits et al., 1987; Gerrits and Horobin, 1996). However, the procedure is more complex than routine processing, including cutting (it requires more specific microtomes) and changes in staining techniques that are troublesome to use. Human material is scarce and, therefore, each sample can be used in different studies with notable differences in objectives, methodologies or treatment. Also, the material used in this study was obtained from Pathology Services, where they are required to maintain this processing and they sometimes remove small blocks to perform pathological diagnosis. All these facts affect the study of human material. Also, to control the presence (or absence) of changes due to other factors (age, sex or neurodegenerative diseases, among others), all samples must follow similar processing. Our study follows the suggestions of Dorph‐Petersen et al. (2001) and West (2013) for size estimation, taking measurements in the equator of the section plane (z‐axis), and using mounted frozen sections to minimise distortion.
The point‐sampled intercepts method to estimate particle volume has been widely used in biomedicine (Sorensen and Ottosen, 1991; Artacho‐Pérula and Roldán‐Villalobos, 1997; Leze et al., 2014) to differentiate between benign and malignant pathologies as well as for disorder classification and grading. Its unbiased nature, good reproducibility and low estimation requirement should be emphasised (Sorensen and Ottosen, 1991), although the method requires either isotropic uniform random (IUR) tissue sections or vertical sections. In our study, the estimates are highly efficient and precise, as demonstrated by analysis of the total observed variance, where the most important contributory factor is biological variation (i.e. differences between specimens, near 80%), whereas the contribution of intercepts and measurements, with an average of 65 measurements (range 51–78), is negligible. Our study used sections with a non‐random orientation of neurons (at least in a 3D plane), which generates a source of error; however, as this limitation was taken into account for all estimates, we concluded that it would have affected data in all different groups equally. A general solution to this problem does not exist, although in the future it may be necessary to carry out a pilot study to assess the difference between estimates obtained from isotropic sections and those obtained from conventional sections (in our case, coronal sections).
In short, our study quantitatively determined in neuronal groups within the HF, and our results indicated important differences between regions and a smaller variation between brain hemispheres. In addition, in the PrS and DG hippocampal regions was not significantly influenced by age, but the neuronal volume of the islands of layer II of the EC was greater in the older age group. The higher variance in the estimates (with a coefficient of variation of 19%, 33% and 18% for EC, PrS and DG, respectively) was mainly due to biological variation, while the methodology (number of sections, fields of vision and intercepts) had a smaller impact. These results will allow us to assess changes in neuronal size in neurodegenerative diseases such as Alzheimer’s.
ACKNOWLEDGEMENTS
We are grateful to all members of the Human Neuroanatomy Laboratory (HNL), in particular Mercedes Iñiguez. We thank the School of Medicine of Albacete and the Regional Centre for Biomedical Research (CRIB) for their institutional support, as well as financial assistance from the Department of Education, Culture and Sport of Castilla‐La Mancha, PPII‐2014‐013‐A Project.
Delgado‐González JC, de la Rosa‐Prieto C, Tarruella‐Hernández DL, et al. Neuronal volume of the hippocampal regions in ageing. J. Anat. 2020;237:301–310. 10.1111/joa.13189
DATA AVAILABILITY STATEMENT
The data that support the findings of this study are available from the corresponding author upon reasonable request.
REFERENCES
- Amaral, D. and Lavenex, P. (2007) Hippocampal neuroanatomy In: Andersen P., Morris R., Amaral D., Bliss T. and O’Keefe J. (Eds.) The Hippocampus Book, 1st edition. New York, NY: Oxford University Press, pp. 37–114. [Google Scholar]
- Andersen, B.B. and Gundersen, H.J.G. (1999) Pronounced loss of cell nuclei and anisotropic deformation of thick sections. Journal of Microscopy, 196, 69–73. [PubMed] [Google Scholar]
- Andersen, P. , Morris, R. , Amaral, D. , Bliss, T. and O’Keefe, J. (2007) The Hippocampus Book. Oxford, UK: Oxford University Press. [Google Scholar]
- Artacho‐Pérula, E. and Insausti, R. (2007) Quantitative estimations of the entorhinal cortex in Alzheimer’s disease. Analytical and Quantitative Cytology and Histology, 29, 1–16. [PubMed] [Google Scholar]
- Artacho‐Pérula, E. and Roldán‐Villalobos, R. (1997) Unbiased stereological estimation of the number and volume of nuclei and nuclear size variability in invasive ductal breast carcinomas. Journal of Microscopy, 186, 133–142. [DOI] [PubMed] [Google Scholar]
- Braak, B. and Braak, E. (1995) Staging of Alzheimer’s disease‐related neurofibrillary changes. Neurobiology of Aging, 16, 271–284. [DOI] [PubMed] [Google Scholar]
- Braak, B. and Braak, E. (1997) Frequency of stages of Alzheimer’s‐related lesions in different age categories. Neurobiology of Aging, 18, 351–357. [DOI] [PubMed] [Google Scholar]
- Buzsaki, G. (1996) The hippocampo‐neocortical dialogue. Cerebral Cortex, 6, 81–92. [DOI] [PubMed] [Google Scholar]
- Delgado‐González, J.C. , Mansilla‐Legorburo, F. , Florensa‐Vila, J. , Insausti, A.M. , Viñuela, A. , Tuñón‐Alvarez, T. , et al. (2015) Quantitative measurements in the human hippocampus and related areas: Correspondence between ex‐vivo MRI and histological preparations. PLoS ONE, 10, 1–16. [DOI] [PMC free article] [PubMed] [Google Scholar]
- Dorph‐Petersen, K.A. , Nyengaard, J.R. and Gundersen, H.J.G. (2001) Tissue shrinkage and unbiased stereological estimation of particle number and size. Journal of Microscopy, 204, 232–246. [DOI] [PubMed] [Google Scholar]
- Frisoni, G.B. , Fox, N.C. , Jack, C.R. Jr , Scheltens, P. and Thompson, P.M. (2010) The clinical use of structural MRI in Alzheimer disease. Nature Reviews Neurology, 6, 67–77. [DOI] [PMC free article] [PubMed] [Google Scholar]
- Gemmell, E. , Bosomworth, H. , Allan, L. , Hall, R. , Khundakar, A. , Oakley, A.E. , et al. (2012) Hippocampal neuronal atrophy and cognitive function in delayed poststroke and aging‐related dementias. Stroke, 43, 808–814. [DOI] [PubMed] [Google Scholar]
- Gerrits, P.O. and Horobin, R.W. (1996) Glycol methacrylate embedding for light microscopy: basic principles and trouble‐shooting. Journal of Histotechnology, 19, 297–311. [Google Scholar]
- Gerrits, P.O. , van Leeuwen, M.B. , Boon, M.E. and Kok, L.P. (1987) Floating on a water bath and mounting glycol methacrylate and hydroxypropyl methacrylate sections influence final dimensions. Journal of Microscopy, 145, 107–113. [DOI] [PubMed] [Google Scholar]
- Gundersen, H.J.G. (1988) The nucleator. Journal of Microscopy, 151, 3–21. [DOI] [PubMed] [Google Scholar]
- Gundersen, H.J.G. and Jensen, E.B. (1985) Stereological estimation of the volume‐weighted mean volume of arbitrary particles observed on random sections. Journal of Microscopy, 138, 127–142. [DOI] [PubMed] [Google Scholar]
- Gundersen, H.J.G. and Osterby, R. (1981) Optimizing sampling efficiency of stereological studies in biology: or ‘Do more less well!’. Journal of Microscopy, 121, 65–73. [DOI] [PubMed] [Google Scholar]
- Gundersen, H.J.G. , Bagger, P. , Bendtsen, T.F. , Evans, S.M. , Korbo, L. , Marcussen, N. , et al. (1988) The new stereological tools: dissector, fractionator, nucleator and point sampled intercepts and their use in pathological research and diagnosis. APMIS, 96, 857–881. [DOI] [PubMed] [Google Scholar]
- Hannula, D.E. and Duff, M.C. (2017) The Hippocampus from Cells to Systems. Cham: Springer International Publisher. [Google Scholar]
- Haugh, H. , Knebel, G. , Mecke, E. , Orün, C. and Sass, N.L. (1981) The aging of cortical cytoarchitectonics in the light of stereological investigations. Progress in Clinical and Biological Research, 59B, 193–197. [PubMed] [Google Scholar]
- Haug, H. , Külh, S. , Mecke, E. , Sass, N.L. and Wasner, K. (1984) The significance of morphometric procedures in the investigation of age changes in cytoarchitectonic structures of human brain. Journal fur Hirnforschung, 25, 353–374. [PubMed] [Google Scholar]
- Hosseini‐Sharifabad, M. and Nyengaard, J.R. (2007) Design‐based estimation of neuronal number and individual neuronal volume in the rat hippocampus. Journal of Neuroscience Methods, 162, 206–214. [DOI] [PubMed] [Google Scholar]
- Insausti, R. and Amaral, D.G. (2012) Hippocampal Formation, Ch. 24 In: Mai J. and Paxinos G. (Eds.) The Human Nervous System, 3rd edition. London (UK), Waltham (MA, USA), San Diego (CA, USA): Elsevier Academic Press, pp. 896–942. [Google Scholar]
- Lavenex, P. , Lavenex, P.B. , Bennett, J.L. and Amaral, D.G. (2009) Postmortem changes in the neuroanatomical characteristics of the primate brain: hippocampal formation. The Journal of Comparative Neurology, 512, 27–51. [DOI] [PMC free article] [PubMed] [Google Scholar]
- Leze, E. , Maciel‐Osorio, C.F.E. and Mandarim‐de‐Lacerda, C.A. (2014) Advantages of evaluating mean nuclear volume as an adjunct parameter in prostate cancer. PLoS ONE, 9, 1–6. [DOI] [PMC free article] [PubMed] [Google Scholar]
- Lupien, S.J. , Evans, A. , Lord, C. , Miles, J. , Pruessner, M. , Pike, B. , et al. (2007) Hippocampal volume is a variable in young as in older adults: implications for the notion of hippocampal atrophy in humans. NeuroImage, 34, 478–485. [DOI] [PubMed] [Google Scholar]
- Matenaers, C. , Popper, B. , Rieger, A. , Wanke, R. and Blutke, A. (2018) Practicable methods for histological section thickness measurement in quantitative stereological analyses. PLoS ONE, 13, 1–21. [DOI] [PMC free article] [PubMed] [Google Scholar]
- Merrill, D.A. , Roberts, J.A. and Tuszynski, M.H. (2000) Conservation of neuron number and size in entorhinal cortex layers II, III, and V/VI of aged primates. Journal of Comparative Neurology, 422, 396–401. [DOI] [PubMed] [Google Scholar]
- Muñoz, M. and Insausti, R. (2005) Cortical efferents of the entorhinal cortex and the adjacent parahippocampal region in the monkey (Macaca fascicularis). European Journal of Neuroscience, 22, 1368–1388. [DOI] [PubMed] [Google Scholar]
- Pakkenberg, B. , Pelvig, D. , Marner, L. , Bundgaard, M.J. , Gundersen, H.J. , Nyengaard, J.R. , et al. (2003) Aging and the human neocortex. Experimental Gerontology, 38, 95–99. [DOI] [PubMed] [Google Scholar]
- Piguet, O. , Chereyron, L.J. , Banta Lavenex, P. , Amaral, D.G. and Lavenex, P. (2018) Stereological analysis of the rhesus monkey entorhinal cortex. Journal of Comparative Neurology, 526, 2115–2132. [DOI] [PMC free article] [PubMed] [Google Scholar]
- Price, J.L. , Ko, A.I. , Wade, M.J. , Tsou, S.K. , McKeel, D.W. and Morris, J.C. (2001) Neuron number in the entorhinal cortex and CA1 in preclinical Alzheimer disease. Archives of Neurology, 58, 1395–1402. [DOI] [PubMed] [Google Scholar]
- Rajah, M.N. , Kromas, M. , Han, J.E. and Pruessner, J.C. (2010) Group differences in anterior hippocampal volume and in the retrieval of spatial and temporal context memory in healthy young versus older adults. Neuropsychologia, 48, 4020–4030. [DOI] [PubMed] [Google Scholar]
- Rapp, P.R. , Burwell, R.D. and West, M.J. (1996) Individual differences in aging: Implications for stereological studies of neuron loss. Neurobiology of Aging, 17, 495–496. [DOI] [PubMed] [Google Scholar]
- Rossler, M. , Zarski, R. , Bohl, J. and Ohm, T.G. (2002) Stage‐dependent and sector‐specific neuronal loss in hippocampus during Alzheimer’s disease. Acta Neuropathologica, 103, 363–369. [DOI] [PubMed] [Google Scholar]
- Schultz, C. and Engelhardt, M. (2014) Anatomy of the hippocampal formation. Frontiers of Neurology and Neuroscience, 34, 6–17. [DOI] [PubMed] [Google Scholar]
- Simic, G. , Kostovic, I. , Winblad, B. and Bogdanovic, N. (1997) Volume and number of neurons of the human hippocampal formation in normal aging and Alzheimer’s disease. Journal of Comparative Neurology, 379, 482–494. [DOI] [PubMed] [Google Scholar]
- Slomianka, L. and West, M.J. (2005) Estimators of the precision of stereological estimates: an example based on the CA1 pyramidal cell layer of rats. Neuroscience, 136, 757–767. [DOI] [PubMed] [Google Scholar]
- Sorensen, F.B. , Kristensen, I.B. , Grymer, F. and Jakobsen, A. (1991) DNA level, tumor thickness, and stereological estimates of nuclear volume in stage I cutaneous malignant melanomas: a comparative study with analysis of prognostic impact. American Journal of Dermatopathology, 13, 11–19. [DOI] [PubMed] [Google Scholar]
- Sterio, D.C. (1984) The unbiased estimation of number and sizes of arbitrary particles using the disector. Journal of Microscopy, 134, 127–134. [DOI] [PubMed] [Google Scholar]
- Van Hoesen, G.W. (1995) Anatomy of the medial temporal lobe. Magnetic Resonance Imaging, 13, 1047–1055. [DOI] [PubMed] [Google Scholar]
- Wegiel, J. , Flory, M. , Kuchna, I. , Nowicki, K. , Ma, S.Y. , Imaki, H. , et al. (2014) Brain‐region‐specific alterations of the trajectories of neuronal volume growth throughout the lifespan in autism. Acta Neuropathologica Communications, 2, 1–18. [DOI] [PMC free article] [PubMed] [Google Scholar]
- Wegiel, J. , Flory, M. , Schanen, C. , Cook, E.H. , Nowicki, K. , Kuchna, I. , et al. (2015) Significant neuronal soma volume deficit in the limbic system in subjects with 15q11.2‐q13 duplications. Acta Neuropathologica Communications, 3, 1–16. [DOI] [PMC free article] [PubMed] [Google Scholar]
- West, M.J. (2013) Tissue shrinkage and stereological studies. Cold Spring Harbor Protocols, 2013(3), 207–212. [DOI] [PubMed] [Google Scholar]
- West, M.J. and Gundersen, H.J. (1990) Unbiased stereological estimation of the number of neurons in the human hippocampus. Journal of Comparative Neurology, 296, 1–22. [DOI] [PubMed] [Google Scholar]
- West, M.J. and Slomianka, L. (1998) Total number of neurons in the layers of the human entorhinal cortex. Hippocampus, 8, 69–82. [DOI] [PubMed] [Google Scholar]
- West, M.J. , Coleman, P.D. , Flood, D.G. and Troncoso, J.C. (1994) Differences in the pattern of hippocampal neuronal loss in normal ageing and Alzheimer’s disease. Lancet, 344, 769–772. [DOI] [PubMed] [Google Scholar]
- Yanpei, W. , Lei, H. , Yuning, Z. , Chenyi, Z. and Daoyang, W. (2019) Entorhinal cortex volume, thickness, surface area and curvature trajectories over the adult lifespan. Psychiatry Research Neuroimaging, 292, 47–53. [DOI] [PubMed] [Google Scholar]
Associated Data
This section collects any data citations, data availability statements, or supplementary materials included in this article.
Data Availability Statement
The data that support the findings of this study are available from the corresponding author upon reasonable request.