Abstract
Introduction: Photobiomodulation (PBM) is known as low-level laser (or light) therapy and is applied in different fields of medicine. However, it is required that its molecular and cellular mechanism be investigated. This study aims to assess the neuroprotective properties of PBM in the rat retina.
Methods: GSE22818 was downloaded from Gene Expression Omnibus (GEO) and the regulation of the significant differentially expressed genes (DEGs) which are produced by light damage in the rat retina by the pretreatment of PBM application was assessed via network analysis and gene ontology enrichment.
Results: The 78 produced DEGs by light-damage in the rat retina were protected via PBM pretreatment action. Among these determined DEGs, 53 individuals were included in the main connected component of the constructed protein-protein interaction (PPI) network. Ccl2, Icam1, Cxcl10, Timp1, and Fos were determined as hub nodes. Eight clusters including 26 regulated biochemical pathways by PBM pretreatment were identified. The critical DEGs based on the action maps were introduced.
Conclusion: The finding indicates that PBM treatment protects rat retina against light damage via the prevention of Fos, Ccl2, Icam1, Cxcl10, and Myc dysregulation.
Keywords: Photobiomodulation therapy, Retina, Gene expression, Protein-protein interaction network, Rat
Introduction
Photobiomodulation (PBM) is considered as low-level laser (or light) therapy utilized in medicine.1 PBMhas been known for almost 50 years; therefore, it is expected that it should gain widespread acceptance, but due to uncertainty about its action mechanism in the molecular, cellular, and also tissue levels, it is not known as a common method in medicine.2 Different mechanisms including effectiveness in the production of ATP, calcium, nitric oxide, and to some extent, types of reactive oxygen are suggested for PBM. In addition, the mitochondrial cytochrome c oxidase and Ca2+ channels are recognized as the main receiver of these photons. PBM is used in various fields such as stimulating healing, relieving pain, and reducing inflammation.1 The usage of PBM has gained considerable attention in the field of ophthalmology recently due to its novel non-invasive and beneficial role in cellular regenerative functions.3 Retinal therapy is one of the fields wherein PBM is used for its injuries. Inflammation, oxidative damage, and dysfunctional mitochondria are the main processes of retinal injuries and diseases. Therefore, targeting these causes could be a promising strategy for the recovery of the retina by such a method as PBM therapy.4 In other words, PBM could increase the chance of recovery for mitochondrial dysfunction, a reduction of cell death, and an increment of cytoprotective factors.5 For instance, in a study by Eells et al, the methanol damage to the retina could be alleviated by PBM therapy.6 Other studies also showed that exposure to this wavelength could have protective effects on retinal aging and degenerative diseases.4,7 To better understand the potential impacts of this type of laser therapy and to improve its clinical applications, molecular studies in terms of transcriptome evaluation could be important.8 What is more, bioinformatics evaluation by the application of protein-protein interaction (PPI) network analysis could add more worthy aspects to find key genes in the underlying mechanisms of this method of therapy.9 In such a study, large numbers of genes are screened to find the critical individuals that play a crucial role in the treated samples. Besides, network analysis gene ontology can provide useful information about the function of the differentially expressed genes (DEGs) to understand the molecular mechanism of the applied therapeutic method.10-12 The aim of the present paper was to detect central genes through network exploration to better define the mechanisms of the neuroprotective effect of PBM on the rat retina.
Materials and Methods
GSE22818 (https://www.ncbi.nlm.nih.gov/geo/query/acc.cgi?acc=GSE22818) entitled “Comparison of Saffron and Photobiomodulation on the light damaged rat retina” was downloaded from GEO. The document was published as “Gene and noncoding RNA regulation underlying photoreceptor protection: microarray study of dietary antioxidant saffron and photobiomodulation in rat retina.”8 GSM563898-900 and GSM563907-9 were selected as normal and light-damage samples respectively. GSM563901-3 and GSM563910-12 were considered as PBM and PBM+light-damage groups respectively. The albino Sprague Dawley rats raised in dim cyclic illumination (12 h 5 lux, 12 h darkness) were considered as normal and the challenged individuals by 24h exposure to bright (1000 lux) light were regarded as light damage. The normal ones which were treated with pbm (10 J/cm2 at the eye, daily for 5d) were nominated as the PBM group. The fourth group (PBM+light-damage group) were the rats of the PBM group which were irradiated by 24 h exposure to bright (1000 lux) light.8
The gene expression profiles of control and light damage and also PBM and PBM+light-damage were matched via box plot analysis by the use of GEO2R software. The top 250 DEGs based on P valve (small to large) were extracted from each analysis by GEO2R. Considering fold change >2 and P value ≤0.01, the significant characterized DEGs were a candidate for more analysis. Three categories of DEGs were determined; first the common DEGs between the two analysis, second the DEGs that existed in the control and light-damage analysis but were absent in the PBM and PBM+light-damage analysis, and third the DEGs of PBM and PBM+light-damage analysis which were not found in the control and light-damage analysis. The first group is the dis-regulated genes by light-damage and is not protected by PBM pretreatment. The second class refers to the genes that can be dysregulated by light-damage but are protected by PBM pretreatment. Finally, the third set of genes is the dis-regulated genes by PBM.
The second group of genes (the DEGs that existed in the control and light-damage analysis but were absent in the PBM and PBM+light-damage analysis) was selected to screen via PPI network analysis by using Cytoscape software.13 The genes were imported in Cytoscape and included in a network via the “protein query” of the STRING database. Due to poor interaction between the query genes, the 20 first neighbors of the nodes were added to the DEGs from the STRING database. The main connected component of the constructed network was analyzed by “Network analyzer”, an application of Cytoscape software. About 10% of top nodes of the main connected component based on degree value were selected among the queried DEGs (not including the first neighbors) as hub-nodes.
The elements of the main connected component without the added first neighbors were investigated via the ClueGO application of Cytoscape14 to find the related biochemical pathways from the Kyoto Encyclopedia of Genes and the Genomes (KEGG) database. The determined pathways were clustered to find the crucial classes related to the neuroprotective property of PBM treatment. To screen the queried genes of the main connected component, the DEGs were assessed via the CluePedia plugin of Cytoscape software.15 Activation, inhibition, and expression actions were mapped and the critical DEGs were introduced.
Results
The gene expression profiles of the control group and the treated group with light damage were matched statistically (see Figure 1). Totally 250 genes were identified as DEGs based on statistically significant analysis by GEO2R software. Considering fold change ≥2 and P value <0.01, 119 characterized significant DEGs were identified as the affected genes by light damage in rat retina.
Figure 1.
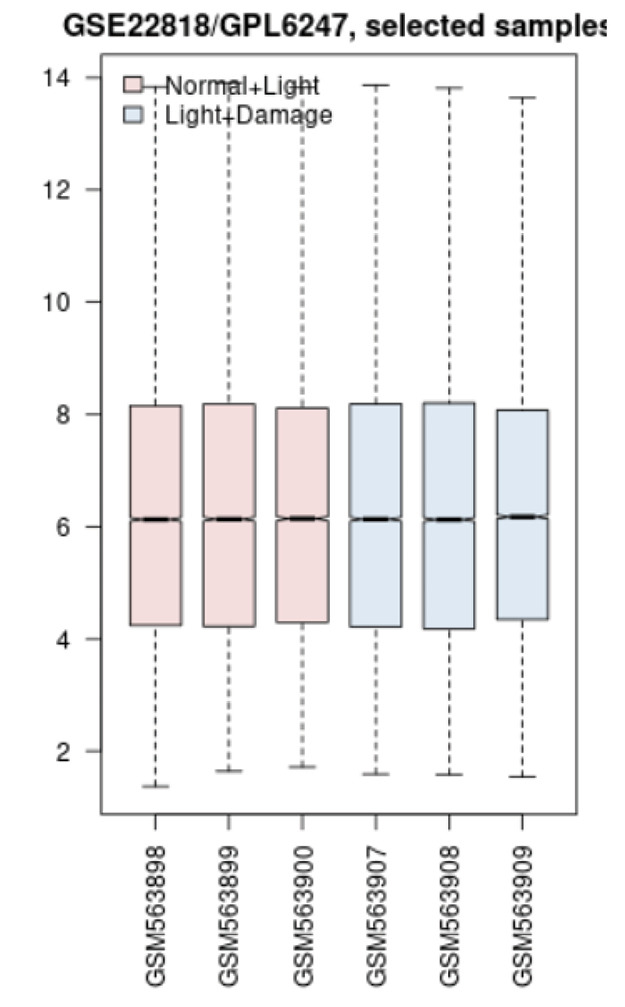
Box Plot Analysis to Match the Gene Expression Profiles of Control and Light Damage Treated Samples. Data obey median centered distribution.
Similarly, the gene expression profiles of the PBM-treated samples versus the group treated with PBM plus light damage were analyzed statistically. The matched samples are presented in Figure 2. All profiles were characterized by the median value of 6 (see Figures 1 and 2). As the analysis for the previous two groups, the 50 significant DEGs referring to the effect of damage light on the PBM treated rats remained.
Figure 2.
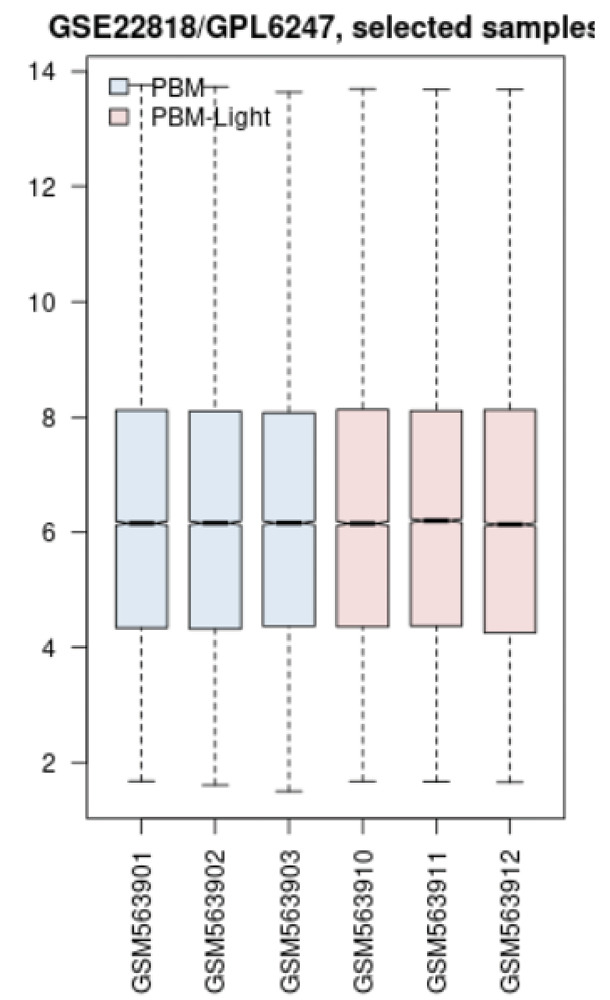
Box Plot Analysis to Match the Gene Expression Profiles of the PBM-Treated Samples Versus the Group Treated With PBM Plus Light Damage. Data obey median centered distribution.
As it was analyzed, light damage in the absence of PBM treatment changed the gene expression of 119 genes differentially, but in the presence of PBM action, 50 DEGs were identified. It can be concluded that the 50 DEGs can be grouped as the first class of DEGs (including 39 DEGs) that are common between the two analysis (refer to the light damage in the presence and absence of PBM) and the other (11 DEGs) which refer to the induced alterations by PBM. Simply it is concluded that the 39 DEGs are the affected genes by light damage in the presence and absence of PBM treatment and the 11 DEGs refer to the net effect of PBM action. After the deletion of the 39 DEGs, 80 genes remained as the effect of light damage on the retina in the absence of PBM treatment. On the other hand, PBM treatment protects the retina by protecting the 80 genes from light damage. We consider these 80 genes as a candidate for more analysis to understand the neuroprotective activity of PBM treatment against light damage. Among 80 DEGs two genes included 2 isoforms; ladinin1 (Lad1) and methylenetetrahydrofolate dehydrogenase (NADP+ dependent) 2 (Mthfd2). The 78 DEGs were included in the PPI network to screen the gene to find the central individuals.
The network was constructed and the main connected component included 46 nodes with 169 edges and the 32 remained nodes appeared as isolated or paired in double or triple groups. The poor interaction between the nodes implied adding 10 first neighbors to the DEGs. The main connected component of the new network includes 57 nodes (47 DEGs and 10 added first neighbors) and 465 connections. However, to improve connections between the nodes, 20 first neighbors were finally added to the queried DEGs. Adding more than 20 neighbors to the queried DEGs had no effect on the promotion of connections between the nodes. As it is depicted in Figure 3, the main connected component of the network in the case of adding 20 first neighbors included 73 nodes (53 queried DEGs plus 20 first neighbors) and 816 edges. The hub nodes were selected among the queried DEGs. About 10% of top nodes based on degree value were identified as hub nodes. The properties of hub nodes are presented in Table 1. In this table, degree (D) value, betweenness centrality (BC), closeness centrality (CC), and stress as the four important central parameters are presented for the nodes of the network.
Figure 3.
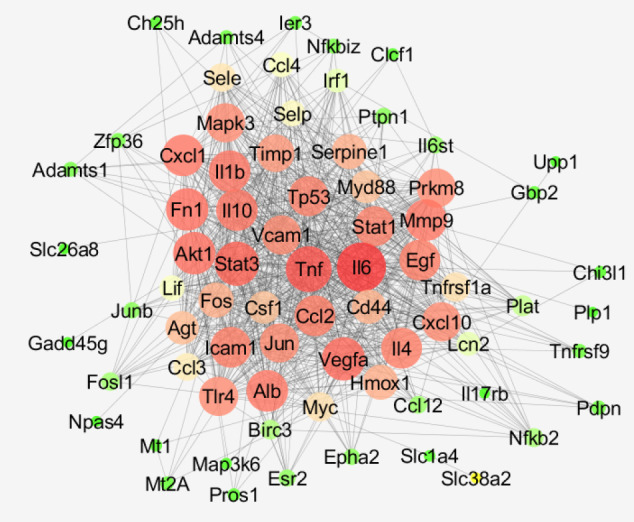
The Main Connected Component of the PPI Network of PBM Neuroprotective Effect on the Rat Retina Against Light Damage. The nodes are laid out based on degree value. Green to red refers to the increment of degree value.
Table 1. Properties of the Hub Nodes of the Main Connected Component .
| Gene | Description | D | BC | CC | S |
| Ccl2 | Immediate-early serum-responsive protein JE; Chemotactic factor that attracts monocytes, but not neutrophils; it belongs to the intercrine beta (chemokine CC) family. | 41 | 0.007 | 0.69 | 610 |
| Icam1 | Intercellular adhesion molecule 1; During leukocyte trans-endothelial migration, ICAM1 engagement promotes the assembly of endothelial apical cups; it belongs to the immunoglobulin superfamily. | 41 | 0.010 | 0.69 | 738 |
| Cxcl10 | 10 kDa interferon gamma-induced protein; In addition to its role as a pro-inflammatory cytokine, it may participate in T-cell effector function and perhaps T-cell development. | 39 | 0.026 | 0.67 | 938 |
| Timp1 | Tissue inhibitor of metalloproteinases 1; It functions as a growth factor that regulates cell differentiation, migration and cell death and activates cellular signaling cascades via CD63 and ITGB1. It plays a role in integrin signaling. Also, it stimulates steroidogenesis by Leydig and ovarian granuloma cells. | 37 | 0.017 | 0.66 | 936 |
| Fos | FBJ osteosarcoma oncogene; It regulates TGF-beta- mediated signaling. It has a critical function in regulating the development of cells destined to form and maintain the skeleton. It is thought to have an important role in signal transduction, cell proliferation, and differentiation. | 34 | 0.054 | 0.64 | 1892 |
Abbreviations: D, degree; BC, betweenness centrality; CC, closeness centrality; S, stress.
Descriptions are obtained from STRING database and are summarized.
Since among 78 queried DEGs, 53 genes were connected to each other, activation, inhibition, and expression actions were investigated for these DEGs. As it is shown in Figures 4-6, 28, 17, and 19 DEGs were connected to each other in the activation, inhibition, and expression maps respectively. Biochemical pathway analysis for the 53 DEGs leads to determining 26 pathways from KEGG. The pathways are clustered in the 8 classes including classes 1-5 that contain a single term and 6, 7, and 8 comprise 5, 8, and 8 pathways respectively (see Figure 7 and Table 2). The Gene ontology term (GO Term), % associated genes (%AG), Number of genes, (NG), and associated genes found (AGF) which describe relationship between genes and the identified pathways are shown in Table 2.
Figure 4.
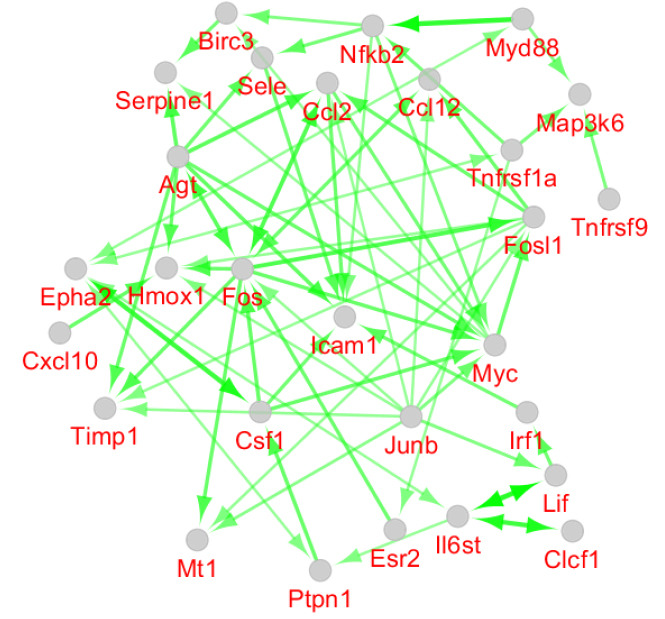
Activation Map for the 53 Queried DEGs Participating in the Main Connected Component of the Constructed PPI Network. The direction of the arrows refers to the direction of activation.
Figure 6.
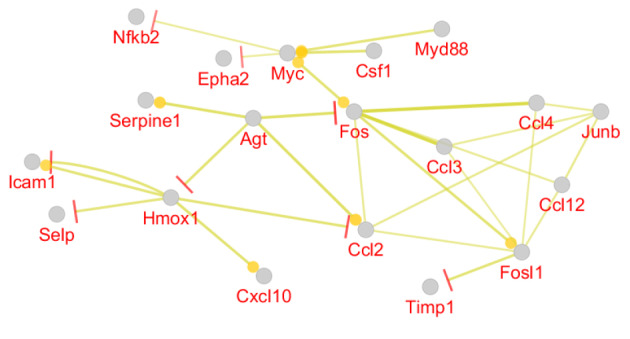
Expression Map for the 53 Queried DEGs Participating in the Main Connected Component of the Constructed PPI Network. Bar and round tips refer to the direction of negative and positive co-expression.
Figure 7.
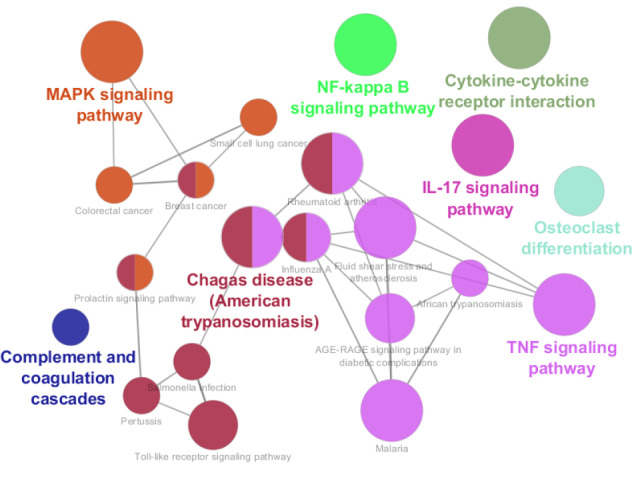
26 biochemical pathways categorized in 8 classes; related to the 53 queried DEGs which were included in the main connected component of the PPI network. The pathways are obtained from KEGG and group P-Value corrected with Bonferroni step down ≤0.01 was considered. The highlighted pathways refer to the names of groups.
Table 2. Biochemical Pathways Related to the 53 queried DEGs Included in the Main Connected Component of the PPI Network .
| R | GO Term | % AG | NG | AGF |
| 1 | Cytokine-cytokine receptor interaction | 4.43 | 12 | [Ccl12, Ccl2, Ccl3, Ccl4, Clcf1, Csf1, Cxcl10, Il17rb, Il6st, Lif, Tnfrsf1a, Tnfrsf9] |
| 2 | NF-kappa B signaling pathway | 5.77 | 6 | [Birc3, Ccl4, Icam1, Myd88, Nfkb2, Tnfrsf1a] |
| 3 | Osteoclast differentiation | 4.69 | 6 | [Csf1, Fos, Fosl1, Junb, Nfkb2, Tnfrsf1a] |
| 4 | Complement and coagulation cascades | 3.45 | 3 | [Plat, Pros1, Serpine1] |
| 5 | IL-17 signaling pathway | 7.69 | 7 | [Ccl12, Ccl2, Cxcl10, Fos, Fosl1, Il17rb, Lcn2] |
| 6 | MAPK signaling pathway | 3.07 | 9 | [Csf1, Epha2, Fos, Gadd45g, Map3k6, Myc, Myd88, Nfkb2, Tnfrsf1a] |
| Prolactin signaling pathway | 4.17 | 3 | [Esr2, Fos, Irf1] | |
| Colorectal cancer | 4.05 | 3 | [Fos, Gadd45g, Myc] | |
| Small cell lung cancer | 3.26 | 3 | [Birc3, Gadd45g, Myc] | |
| Breast cancer | 3.31 | 5 | [Esr2, Fos, Gadd45g, Myc, Nfkb2] | |
| 7 | TNF signaling pathway | 10.19 | 11 | [Birc3, Ccl12, Ccl2, Csf1, Cxcl10, Fos, Icam1, Junb, Lif, Sele, Tnfrsf1a] |
| AGE-RAGE signaling pathway in diabetic complications | 5.00 | 5 | [Ccl12, Ccl2, Icam1, Sele, Serpine1] | |
| Chagas disease (American trypanosomiasis) | 6.93 | 7 | [Ccl12, Ccl2, Ccl3, Fos, Myd88, Serpine1, Tnfrsf1a] | |
| African trypanosomiasis | 8.33 | 3 | [Icam1, Myd88, Sele] | |
| Malaria | 12.24 | 6 | [Ccl12, Ccl2, Icam1, Myd88, Sele, Selp] | |
| Influenza A | 3.57 | 6 | [Ccl12, Ccl2, Cxcl10, Icam1, Myd88, Tnfrsf1a] | |
| Rheumatoid arthritis | 7.23 | 6 | [Ccl12, Ccl2, Ccl3, Csf1, Fos, Icam1] | |
| Fluid shear stress and atherosclerosis | 5.63 | 8 | [Ccl12, Ccl2, Fos, Hmox1, Icam1, Plat, Sele, Tnfrsf1a] | |
| 8 | Toll-like receptor signaling pathway | 5.05 | 5 | [Ccl3, Ccl4, Cxcl10, Fos, Myd88] |
| Prolactin signaling pathway | 4.17 | 3 | [Esr2, Fos, Irf1] | |
| Salmonella infection | 5.13 | 4 | [Ccl3, Ccl4, Fos, Myd88] | |
| Pertussis | 4.00 | 3 | [Fos, Irf1, Myd88] | |
| Chagas disease (American trypanosomiasis) | 6.93 | 7 | [Ccl12, Ccl2, Ccl3, Fos, Myd88, Serpine1, Tnfrsf1a] | |
| Influenza A | 3.57 | 6 | [Ccl12, Ccl2, Cxcl10, Icam1, Myd88, Tnfrsf1a] | |
| Breast cancer | 3.31 | 5 | [Esr2, Fos, Gadd45g, Myc, Nfkb2] | |
| Rheumatoid arthritis | 7.23 | 6 | [Ccl12, Ccl2, Ccl3, Csf1, Fos, Icam1] |
The pathways are obtained from KEGG and group P-Value corrected with Bonferroni step down ≤0.01 was considered.
Figure 5.
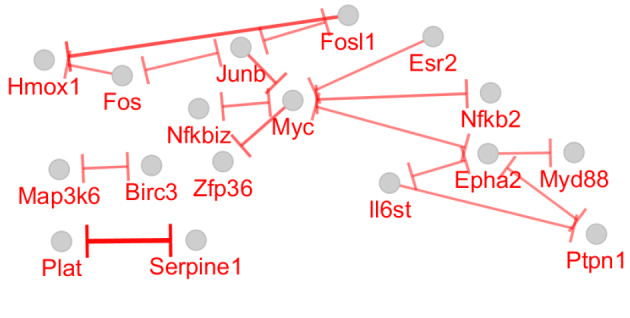
Inhibition Map for the 53 Queried DEGs Participating in the Main Connected Component of the Constructed PPI Network. Bar tips refer to the direction of activation.
Discussion
As it is depicted in Figures 1 and 2, the samples are comparable statistically. The distribution of gene expression amounts for both analyses are similar. It was found that PBM pretreatment prevented complete damage by light damage. Seventy-eight genes were protected from dysregulation by light damage. In the previous investigation, some benefits of PBM action were discovered. The reduction of pain, the increment of athletic performance, the stimulation of healing, neuron protection, and the positive role in cancer management are the benefits of PBM application; however, more investigations are recommended for the final confirmation of the positive role of PBM action in medicine.16,17 Network analysis revealed that the protection of Ccl2, Icam1, Cxcl10, Timp1, and Fos genes against light damage is an important beneficiary effect of PBM action on the retina. The mentioned genes are the critical elements of the analyzed network. As it is shown in Figure 3, all of these genes appear in the red color which corresponds to the high value of the degree. As it is depicted in Table 1, Ccl2, Icam1, and Cxcl10 are involved in the immunological activities and Timp1 and Fos play a role in the regulation of cell differentiation, cell migration, cell death, activation of several cellular signaling cascades, integrin signaling, stimulation of steroidogenesis by Leydig and ovarian granuloma cells, the regulation of TGF-beta-mediated signaling, the regulation of development of cells destined to form and maintain the skeleton, signal transduction, and cell proliferation. All five hub nodes are presented in the activation and expression maps and appear as critical elements of the activation and expression networks; however, only Fos, among the other hubs, is highlighted in the inhibition map. Hmox1 and Myc are the two non-hub DEGs that are presented in the activation, inhibition, and expression maps and issued important regulatory effects. Myc is a well-known oncogene which in humans is located on chromosome 8.18 Investigations indicate that Myc is frequently deregulated in different kinds of human cancers.19
As it is shown in Figure 7 and Table 2, 26 biochemical pathways which are related to the elements of the main connected component are identified. The cytokine-cytokine receptor interaction including 12 DEGs (Ccl12, Ccl2, Ccl3, Ccl4, Clcf1, Csf1, Cxcl10, Il17rb, Il6st, Lif, Tnfrsf1a, and Tnfrsf9) is the largest pathway and Malaria with the maximum of “% associated genes” (12.24) is highlighted in Table 2. Fos, Ccl2, Icam1, Cxcl10, and Timp1 (the hub nodes) are involved in the 16, 12, 10, 6, and 0 pathways respectively. Myc and Hmox1 which were highlighted in the action maps are related to the 5 and 1 pathways respectively. The maximum number of hub nodes which are presented in a certain pathway is 3. Each one of the “IL-17 signaling pathway”, “TNF signaling pathway”, “Influenza A”, and “Rheumatoid arthritis” includes 3 hub DEGs. There are only 2 pathways (about 8% of the total pathways); “Small cell lung cancer” and “Complement and coagulation cascades” that are not related to the hub nodes. Based on the centrality analysis of the PPI network analysis, action map assessment, and gene ontology finding, it can be concluded that Fos, Ccl2, Icam1, Cxcl10, and Myc are the crucial genes which are related to the neuroprotective property of PBM treatment. Except Timp1, the important role of the other 4 central genes (Fos, Ccl2, Icam1, Cxcl10) was confirmed by gene ontology analysis. MYC was highlighted via action map analysis and gene ontology assessment; however, it was not included in the hub group of DEGs. Fos is presented in the 16 pathways (about 62% of all pathways) and 5 clusters of 8 total clusters (again 62% of all clusters).
As it is reported, PBM with blue light leads to the down-regulation of FBJ murine osteosarcoma viral oncogene homolog (FOS), interleukin 8 (IL8), and keratin 5 (Krt5) in human keratinocytes. Also, in this research, it is concluded that the reduction of the TNF-signaling pathway is related to the absence of apoptosis after PBM action with blue light.20 The TNF-signaling pathway is highlighted in the present study as the largest pathway cluster and includes 4 hub DEGs (Ccl2, Cxcl10, Fos, and Icam1). Based on the investigation of Pansani et al, PBM decreases Ccl2 synthesis in human gingival fibroblasts and epithelial cells. These effects may play a role in decreasing tissue inflammatory response and also the improvement of wound healing of oral mucosal tissue.21
Conclusion
The finding from this study indicates that PBM protects the rat retina against light damage via preventing the deregulation of many genes including Fos, Ccl2, Icam1, Cxcl10, and Myc which are the crucial individuals. The analysis revealed that the regulation of the Fos gene is an important prevention effect of the application of PBM on the rat retina.
Ethical Considerations
Not applicable.
Conflict of Interests
The authors declare no conflict of interest.
Acknowledgment
Shahid Beheshti University of Medical Sciences supported this research.
Please cite this article as follows: Mansouri V, Razzaghi M, Rostami-Nejad M, Rezaei-Tavirani M, Heidari MH, Safari S, et al. Neuroprotective properties of photobiomodulation in retinal regeneration in rats: perspectives from interaction levels. J Lasers Med Sci. 2020;11(3):280- 286. doi:10.34172/jlms.2020.47.
References
- 1.Hamblin MR. Mechanisms and applications of the anti-inflammatory effects of photobiomodulation. AIMS biophys. 2017;4(3):337–61. doi: 10.3934/biophy.2017.3.337. [DOI] [PMC free article] [PubMed] [Google Scholar]
- 2.de Freitas LF, Hamblin MR. Proposed mechanisms of photobiomodulation or low-level light therapy. IEEE J Sel Top Quantum Electron. 2016;22(3):7000417. doi: 10.1109/JSTQE.2016.2561201. [DOI] [PMC free article] [PubMed] [Google Scholar]
- 3.Geneva II. Photobiomodulation for the treatment of retinal diseases: a review. Int J Ophthalmol. 2016;9(1):145–52. doi: 10.18240/ijo.2016.01.24. [DOI] [PMC free article] [PubMed] [Google Scholar]
- 4. Eells JT. Photobiomodulation in animal models of retinal injury and disease. In: Hamblin MR, Huang YY, editors. Photobiomodulation in the Brain: Low-level laser (light) therapy in neurology and neuroscience. San Diego: Academic Press; 2019. P. 265-73. doi: 10.1016/B978-0-12-815305-5.00021-X [DOI]
- 5. Eells JT, Gopalakrishnan S, Valter K. Near-infrared photobiomodulation in retinal injury and disease. In: Bowes Rickman C, LaVail MM, Anderson RE, Grimm C, Hollyfield J, Ash J, editors. Retinal Degenerative Diseases: Mechanisms and Experimental Therapy. New York:.
- 6. Springer; 2016. p. 437-41. 10.1007/978-3-319-17121-0_58 [DOI]
- 7.Eells JT, Henry MM, Summerfelt P, Wong-Riley MT, Buchmann EV, Kane M. et al. Therapeutic photobiomodulation for methanol-induced retinal toxicity. Proc Natl Acad Sci U S A. 2003;100(6):3439–44. doi: 10.1073/pnas.0534746100. [DOI] [PMC free article] [PubMed] [Google Scholar]
- 8. Eells JT, DeSmet KD, Kirk DK, Wong-Riley M, Whelan HT, Ver Hoeve J, et al. Photobiomodulation for the treatment of retinal injury and retinal degenerative diseases. In: Waynant R, Tata DB, editors. Proceedings of light-activated tissue regeneration and therapy conference. New York: Springer; 2008. 10.1007/978-0-387-71809-5 [DOI]
- 9.Natoli R, Zhu Y, Valter K, Bisti S, Eells J, Stone J. Gene and noncoding RNA regulation underlying photoreceptor protection: microarray study of dietary antioxidant saffron and photobiomodulation in rat retina. Mol Vis. 2010;16:1801–22. [PMC free article] [PubMed] [Google Scholar]
- 10.Razzaghi MR, Rostami-Nejad M, Rezaei-Tavirani M, Zamanian Azodi M, Okhovatian F, Mansouri V. et al. Muscle recovery is highlighted by IR laser therapy. J Lasers Med Sci. 2019;10(Suppl 1):S49–S53. doi: 10.15171/jlms.2019.S9. [DOI] [PMC free article] [PubMed] [Google Scholar]
- 11.Rostami-Nejad M, Rezaei-Tavirani M, Zadeh-Esmaeel MM, Rezaei Tavirani S, Akbari Z, Esmaeili S. et al. Assessment of cytokine-mediated signaling pathway dysregulation in arm skin after CO2 laser therapy. J Lasers Med Sci. 2019;10(4):257–63. doi: 10.15171/jlms.2019.42. [DOI] [PMC free article] [PubMed] [Google Scholar]
- 12.Mansouri V, Rezaei-Tavirani M, Zadeh-Esmaeel MM, Rezaei-Tavirani S, Razzaghi M, Okhovatian F. et al. Analysis of laser therapy effects on squamous cell carcinoma patients: A system biology study. J Lasers Med Sci. 2019;10(Suppl 1):S1–S6. doi: 10.15171/jlms.2019.S1. [DOI] [PMC free article] [PubMed] [Google Scholar]
- 13.Shahrokh S, Razzaghi Z, Mansouri V, Ahmadi N. Impact of proteomics investigation on the development and improvement of skin laser therapy: A review article. J Lasers Med Sci. 2019;10(Suppl 1):S90–S95. doi: 10.15171/jlms.2019.S16. [DOI] [PMC free article] [PubMed] [Google Scholar]
- 14.Asadzadeh-Aghdaei H, Zadeh-Esmaeel MM, Esmaeili S, Rezaei-Tavirani M, Rezaei-Tavirani S, Mansouri V. et al. Effects of high fat medium condition on cellular gene expression profile: a network analysis approach. Gastroenterol Hepatol Bed Bench. 2019;12(Suppl 1):S130–S135. [PMC free article] [PubMed] [Google Scholar]
- 15.Mlecnik B, Galon J, Bindea G. Automated exploration of gene ontology term and pathway networks with ClueGO-REST. Bioinformatics. 2019;35(19):3864–6. doi: 10.1093/bioinformatics/btz163. [DOI] [PMC free article] [PubMed] [Google Scholar]
- 16.Bindea G, Galon J, Mlecnik B. CluePedia Cytoscape plugin: pathway insights using integrated experimental and in silico data. Bioinformatics. 2013;29(5):661–3. doi: 10.1093/bioinformatics/btt019. [DOI] [PMC free article] [PubMed] [Google Scholar]
- 17.Wong-Riley MT, Liang HL, Eells JT, Chance B, Henry MM, Buchmann E. et al. Photobiomodulation directly benefits primary neurons functionally inactivated by toxins: role of cytochrome c oxidase. J Biol Chem. 2005;280(6):4761–71. doi: 10.1074/jbc.m409650200. [DOI] [PubMed] [Google Scholar]
- 18.Hamblin MR, Nelson ST, Strahan JR. Photobiomodulation and cancer: what is the truth? Photomed Laser Surg. 2018;36(5):241–5. doi: 10.1089/pho.2017.4401. [DOI] [PMC free article] [PubMed] [Google Scholar]
- 19.Dalla-Favera R, Martinotti S, Gallo RC, Erikson J, Croce CM. Translocation and rearrangements of the c-myc oncogene locus in human undifferentiated B-cell lymphomas. Science. 1983;219(4587):963–7. doi: 10.1126/science.6401867. [DOI] [PubMed] [Google Scholar]
- 20.Boxer LM, Dang CV. Translocations involving c-myc and c-myc function. Oncogene. 2001;20(40):5595–610. doi: 10.1038/sj.onc.1204595. [DOI] [PubMed] [Google Scholar]
- 21.Becker A, Klapczynski A, Kuch N, Arpino F, Simon-Keller K, De La Torre C. et al. Gene expression profiling reveals aryl hydrocarbon receptor as a possible target for photobiomodulation when using blue light. Sci Rep. 2016;6:33847. doi: 10.1038/srep33847. [DOI] [PMC free article] [PubMed] [Google Scholar]
- 22.Pansani TN, Basso FG, Soares DG, Turrioni APDS, Hebling J, de Souza Costa CA. Photobiomodulation in the metabolism of lipopolysaccharides‐exposed epithelial cells and gingival fibroblasts. Photochem Photobiol. 2018;94(3):598–603. doi: 10.1111/php.12877. [DOI] [PubMed] [Google Scholar]


