

Summary
Pancreatic cancer is a rare but fatal form of cancer, the fourth highest in absolute mortality. Known risk factors include obesity, diet, and type 2 diabetes; however, the low incidence rate and interconnection of these factors confound the isolation of individual effects. Here, we use epidemiological analysis of prospective human cohorts and parallel tracking of pancreatic cancer in mice to dissect the effects of obesity, diet, and diabetes on pancreatic cancer. Through longitudinal monitoring and multi-omics analysis in mice, we found distinct effects of protein, sugar, and fat dietary components, with dietary sugars increasing Mad2l1 expression and tumor proliferation. Using epidemiological approaches in humans, we find that dietary sugars give a MAD2L1 genotype-dependent increased susceptibility to pancreatic cancer. The translation of these results to a clinical setting could aid in the identification of the at-risk population for screening and potentially harness dietary modification as a therapeutic measure.
Keywords: pancreatic cancer, diet, genetics, dietary sugar, dietary fat, mouse model, EPIC, epidemiology, MAD2L1, gene-environment interaction
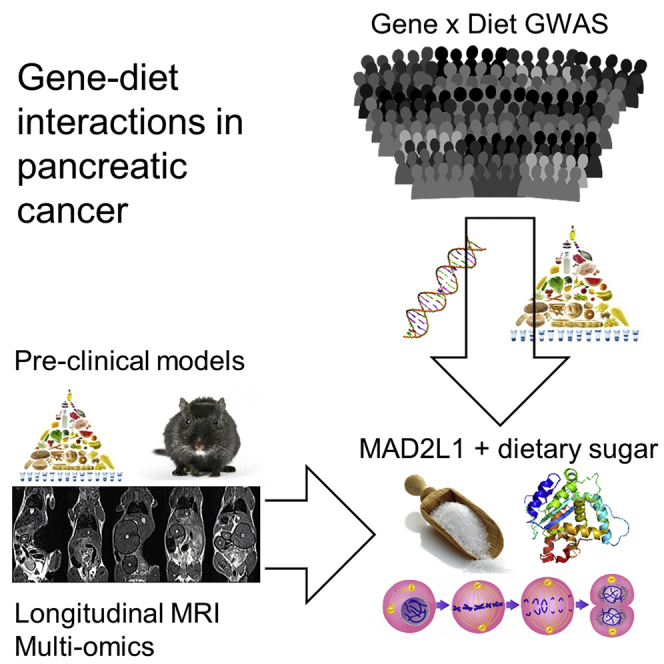
Graphical Abstract
Highlights
-
•
Distinct roles for dietary fat, protein, and sugar on murine pancreatic cancer
-
•
Dietary glucose triggers Mad2l1 upregulation and tumor cell proliferation in mice
-
•
Gene-diet interaction identifies sugar-MAD2L1 link in human pancreatic cancer
-
•
Dietary plant fats were protective in human pancreatic cancer susceptibility
Dooley et al. used parallel analysis of a murine pancreatic cancer model and a human prospective cohort to study the interaction of diet and pancreatic cancer. Both systems identify complex effects with different dietary components, converging on a link between dietary sugar and the cell-cycle checkpoint gene MAD2L1.
Introduction
Pancreatic cancer is a relatively rare form of cancer, with a lifetime risk of developing pancreatic cancer of 1 in 76. Due to the high fatality rate, however, it is the fourth highest in absolute numbers of fatalities (Siegel et al., 2016). One of the major reasons for the high mortality is the late detection of pancreatic cancer and poor therapeutic options. This gives a median survival of <6 months and a 5-year survival rate of <8% (Cleary et al., 2004). The known risk factors for pancreatic cancer include age, smoking, obesity, lack of physical activity, diet, type 2 diabetes (T2D), chronic pancreatitis, cirrhosis, and genetic background (Bardeesy and DePinho, 2002; Whitcomb et al., 2015).
A better understanding is required of the contribution of genetic and environmental factors to pancreatic cancer development (Bardeesy and DePinho, 2002). It is unfortunate that epidemiological studies on dissecting pancreatic cancer have faced difficulty in dissecting overlapping risks, a difficulty that is compounded by the relative rareness of the disease. In the link between obesity and pancreatic cancer (Aune et al., 2012), an individual who is obese is likely to have variability in diet, exercise regime, and genetic background, making it difficult to attribute specific risks to obesity compared to dietary changes, such as the association between the consumption of sugar-sweetened food and pancreatic cancer risk (Larsson et al., 2006). Even with the strong association observed between diabetes and pancreatic cancer, causality remains problematic. If T2D were directly driving pancreatic cancer risk, it would be expected that the increased duration of diabetes diagnosis would be associated with the ever-increasing risk of pancreatic cancer. By contrast, the epidemiological data indicate that the highest risk of pancreatic cancer is observed soon after T2D diagnosis, with the risk decreasing over time (Bosetti et al., 2014), a kinetic that suggests that at least part of the risk is driven by undiagnosed pancreatic cancer causing T2D. In addition to this, the known association of T2D with obesity and altered diet increases the potential for confounding associations (Gumbs, 2008; Hart et al., 2008). To the extent possible, these confounding factors are controlled for; however, there is a limit to the accuracy that can be achieved in monitoring food intake. These limitations are of particular importance in case-control studies of pancreatic cancer, in which the long latency period and strong impact on appetite can reverse causality (Sanchez et al., 2012).
The epidemiological associations of pancreatic cancer with diet, obesity, and T2D are extremely complex to unravel. It is therefore difficult, using human studies alone to determine whether diet, obesity, and T2D independently contribute to the risk of pancreatic cancer development or whether some or all of these associations are actually indirect, with the correlation being driven by the entanglement of these factors. By contrast, mouse models readily allow these effects to be untangled. For example, the db/db and ob/ob mouse strains disentangle the effect of diet. The db/db mouse strain possesses a mutation in the leptin receptor (Leprdb/db) that drives the development of severe obesity and T2D (Chen et al., 1996). The ob/ob mouse strain is similar, with a mutation in leptin (Lepob/ob) that results in severe obesity, but the strain rarely develops diabetes (Zhang et al., 1994). Critically, and unlike other models of murine diabetes and obesity, the db/db and ob/ob phenotypes develop while the mice are on normal healthy diets, such that the effects observed can be assigned to quantitative (calorie intake and obesity) rather than qualitative (nutritional composition of the diet) changes to induce obesity. Another advantage of mouse models is the ability to use transgenes to promote the early onset of pancreatic cancer, such as Ela1-TAg mice, which express the SV40 large T antigen under the control of the Elastase-1 acinar cell promoter. These mice develop spontaneous early-onset pancreatic acinar carcinoma (Ornitz et al., 1987; Tevethia et al., 1997), the kinetics of which allow dietary modulation without first inducing obesity or T2D. Here, we used both human epidemiological studies and mouse model studies in parallel to dissect the interplay of diet, obesity, and T2D in pancreatic cancer.
Results
Obesity Drives Murine Pancreatic Cancer Development, Growth, and Lethality, Independent of Diet Composition
Susceptibility to pancreatic cancer in humans is associated with diet, obesity, and T2D, creating a complex web of interconnections that are difficult to dissect using epidemiological data. To disentangle the effect of obesity and T2D from diet, we intercrossed the db/db and ob/ob mouse strains with the well-characterized TAg transgenic model of pancreatic acinar carcinoma. These strains reflect a genetic form of human obesity, which, while rare, allows the decoupling of qualitative and quantitative dietary changes. Despite being fed a low-sugar diet, both TAg+ db/db and TAg+ ob/ob mice developed severe and early onset obesity (Figures S1A–S1F); however, only the TAg+ db/db mice also developed diabetes (Figures S1G–S1L). From 7 weeks of age onward, TAg+, TAg+ db/db, and TAg+ ob/ob mice were scanned by magnetic resonance imaging (MRI) for the presence and size of pancreatic tumors (Figures S1M–S1Z). The cumulative incidence of pancreatic tumors in these mice demonstrated that both the db/db and ob/ob genotypes significantly hastened tumor onset (Figures 1A and 1B), resulting in tumor development 5 weeks earlier than that observed in non-obese TAg+ mice (Figure 1C). Both the db/db and ob/ob genotypes trended toward an increased tumor growth rate (Figure 1D). For both female and male mice, obesity resulted in elevated mortality due to pancreatic cancer, with a high level of death observed at 14 weeks in both db/db and ob/ob strains, while substantial mortality was delayed out past 21 weeks in the non-obese TAg+ mice (Figures 1E and 1F). Even after normalizing for the earlier development, db/db and ob/ob mice still showed significantly higher levels of tumor-associated mortality (Figures 1G and 1H). Overall, these results validate obesity or total calorie intake as a driver of pancreatic acinar carcinoma, independent of diet composition, with significant effects on tumor development. By contrast, in this model, there was no additional effect of T2D, with no significant differences between the obese and diabetic db/db mice and the obese non-diabetic ob/ob strain.
Figure 1.

Quantitative Changes in Calorie Intake Drive Pancreatic Cancer Onset and Growth
TAg+, TAg+Leprdb/db, and TAg+Lepob/ob mice were assessed through MRI for tumor size.
(A and B) Cumulative incidence of pancreatic cancer in TAg+ mice, and TAg+ mice crossed to the db/db and the ob/ob backgrounds: (A) female (n = 31 TAg+, 8 TAg+Leprdb/db, 6 TAg+Lepob/ob) and (B) male (n = 24 TAg+, 14 TAg+Leprdb/db, 8 TAg+Lepob/ob) mice. p values via the log-rank test.
(C) Age at tumor onset. p values via Kruskal-Wallis test with Dunn’s post hoc test.
(D) Tumor volume increase every 2 weeks. p values via Kruskal-Wallis test with Dunn’s post hoc test.
(E and F) Overall pancreatic cancer survival in female (E) and male (F) mice.
(G and H) Survival normalized to first detection of pancreatic cancer in female (G) and male (H) mice. p values via log-rank test.
Opposing Effects of Dietary Protein and Fat on Murine Pancreatic Cancer
Having established obesity or total calorie intake as an independent driver of pancreatic acinar carcinoma, we sought to test the independent impact of dietary components. We investigated the effect of dietary protein by placing breeder cages on either control or high-protein diets and continuing the dietary manipulation after weaning, in effect manipulating dietary exposure from the in utero stage onward. TAg+ mice, on either the control or high-protein diet, were then assessed by MRI every 2 weeks for the presence and size of pancreatic tumors (Figure S2). We assessed the effect of altered dietary protein on pancreatic cancer development (Figures 2A and 2B). Female mice raised on a high-protein diet exhibited a 2-week delay in pancreatic cancer onset (Figures 2A and 2C). No significant effect was observed in male mice (Figure 2B); this was due to the statistical limitations of pairwise dietary effects rather than sex-specific dietary effects, as a nutritional landscape analysis demonstrated similar effects of dietary protein on male and female mice (see below). Overall, no significant effect was seen on the tumor growth rate (Figure 2D) at the macroscopic level; however, a substantial drop in tumor proliferation was observed in both sexes through histology (Figures 2E and 2F). Using RNA sequencing (RNA-seq), we profiled the transcriptome of size-matched tumors from high-protein and control diets. Pathway analysis (Figure 2G) identified a strong downregulation of cell-cycle-associated genes (Figures 2H and S3A) and ribosome components (Figures 2I and S3B). At the molecular level, the high-protein diet is therefore associated with a stalling of the cell cycle and a reduction in biomass synthesis capacity, explaining the macro-level phenotype observed. Tumor-induced mortality was unchanged (Figures S4C and S4D), although the duration of observation was not sensitized for detecting decreased mortality. These results indicate tumor-suppressant effects of the high-protein diet on pancreatic acinar carcinoma. While this result could be interpreted as a suppressive effect of dietary protein, shifts in the alternative macromolecule composition and total calorie intake (13% reduced in the high-protein diet mice compared to the control diet mice) may also contribute to the effect observed.
Figure 2.

High-Protein Diet Inhibits Pancreatic Cancer Onset and Reduces the Expression of Cell-Cycle Components
TAg+ mice were placed on either a control or a high-protein diet and assessed through MRI.
(A and B) Cumulative incidence of pancreatic cancer in mice on a control diet (n = 17) or a high-protein diet (n = 6) for female mice (A), or a control diet (n = 19) or a high-protein diet (n = 4) for male mice (B). p values via log-rank test.
(C) Age at tumor onset. p values via Mann-Whitney test.
(D) Tumor volume increase every 2 weeks. p values via Mann-Whitney test.
(E) Representative histology from control and high-protein diet tumors. Scale, 100 μm. Inset at 2.5× magnification.
(F) Quantification of Ki67hi cells in the tumors of control and high-protein diet male and female mice (n = 3/group with analysis of 6 images per biological replicate).
(G) Normalized enrichment scores of gene set enrichment analysis (GSEA) for gene expression in tumors from a control diet (n = 6) compared to a high-protein diet (n = 4).
(H and I) Graphical representation of the enrichment score of the cell cycle (H) and ribosome (I) gene sets.
Using the same system of dietary change from the in utero stage onward, we investigated the effect of increased dietary fat. TAg+ mice were exposed to either 10% or 30% dietary fat and compared to the control diet through longitudinal MRI assessment. Through cumulative pancreatic cancer incidence, there was no effect of increased dietary fat on female mice (Figure 3A) and only a minor acceleration of incidence in male mice fed 30% fat (Figures 3B and 3C). Analysis of the effect of dietary fat on pancreatic cancer growth rates indicated no systematic effect (Figure 3D). At a histological level, no changes were observed in tumor morphology, cellular density, or proliferation (Figures 3E–3G). Despite the lack of any substantial effects on the tumor itself, a high-fat diet had a profound effect on the mortality rate of tumor-bearing male (Figure 3H) but not female (Figure 3I) mice. Male TAg+ mice fed either the 10% or the 30% fat died on average 7 weeks earlier than control-fed mice, despite similar tumor burdens. Notably, these effects were observed before any major changes in body weight (Figure S4), indicating that the diet, rather than obesity, was the causative factor. This toxicity effect could not be explained at the molecular level, with few coordinated transcriptional or metabolic changes in tumors from mice fed 30% fat compared to the control diet revealed by RNA-seq analysis (Figure 3J). These results suggest that while dietary fat has little or mild direct pro-oncogenic properties, the high-fat diets have a major effect on tumor-induced mortality in male mice. While this effect could be a direct result of the dietary fat, high-fat diets also had elevated dietary sugars and increased energy density, suggestive of alternative sources of the effect.
Figure 3.

High-Fat Diets Are Associated with Increased Pathogenicity of Pancreatic Cancer
TAg+ mice were placed on either a control, a 10% fat, or a 30% fat diet and assessed through MRI.
(A and B) Cumulative incidence of pancreatic cancer in mice on a control diet (n = 17), a 10% fat diet (n = 4), or a 30% fat diet (n = 10) for female mice (A) and a control diet (n = 18), a10% fat diet (n = 9), or a 30% fat diet (n = 6) for male mice (B). p values via log-rank test.
(C) Age at tumor onset. p values via Kruskal-Wallis test with Dunn’s post hoc test.
(D) Tumor volume increase every 2 weeks. p values via Kruskal-Wallis test with Dunn’s post hoc test.
(E) Representative histology from control, 10% fat, and 30% fat diet tumors, at 14–16 weeks of age. Scale, 100 μm. Inset at 2.5× magnification.
(F and G) Quantification of cellular density (F) and Ki67hi cells (G) in the tumors of control and high-fat diet male and female mice (n = 3/group with analysis of 6 images per biological replicate).
(H and I) Overall pancreatic cancer survival of male (H) and female (I) mice on control and high-fat diets. p values via log-rank test.
(J) Normalized enrichment scores of GSEA for gene expression in tumors from control fed mice (n = 6) as compared to a 30% fat diet (n = 6).
Elevated Dietary Glucose Increases Tumor-Induced Mortality in Mice
As dietary sugars have been linked to obesity and T2D, risk factors for pancreatic cancer, we tested the effect of simple dietary sugars on tumor kinetics. We compared tumor growth in mice fed the control diet versus either a sugar-free or a high-glucose diet (Figure S2). Analysis of cumulative incidence of pancreatic cancer found no significant effect of high-glucose relative to the (sugar-containing) control diet; however, there was a significant delay in tumor development of ∼5 weeks in mice fed sugar-free diets (Figures 4A–4C). A nutritional landscape analysis, however, identified this effect as tracking with the elevated protein composition of the sugar-free diet (see below), demonstrating the complexity of a multifactorial nutritional analysis. Analysis of tumor growth rates found a trend toward higher sugar levels’ driving more rapid tumor expansion (Figure 4D). At the histological level, a clear dose-dependent effect of the glucose content of the diet on tumor cell proliferation and density was observed (Figures 4E–4G). A large effect of sugar was also observed on tumor-induced mortality, with high-glucose diets driving early-onset mortality (Figures 4H and 4I), and the sugar-free diet significantly delaying mortality in female mice (Figure 4I). At a transcriptional level, the tumors from high-glucose-fed mice exhibited an elevated expression of cell-cycle genes and ribosome components compared to sugar-free-fed mice (Figures 4J and S5). Metabolic profiling revealed a reduction in amino acid levels in the tumors from high-glucose-fed mice (Figure 4K), possibly indicating that amino acids were actively used for protein synthesis. We then tested the association between blood glucose level and upregulation of the cell-cycle signature within the tumor. Across the range of diets used in this study, mice with higher blood glucose levels showed a tendency toward high expression of the cell-cycle signature (Figure 4L). These data indicate that dietary sugar (or downstream mediators, such as insulin) enhances the cell cycle and upregulates the ribosomal capacity, feeding the proliferation and pathogenicity of pancreatic acinar carcinoma.
Figure 4.

Dietary Sugar Drives the Onset, Growth, and Pathogenicity of Pancreatic Cancer
TAg+ mice were placed on either a control, a high-glucose, or a sugar-free diet and assessed through MRI.
(A and B) Cumulative incidence of pancreatic cancer in mice on a control (n = 17), a high-glucose (n = 8), or a sugar-free (n = 8) diet in female mice (A), and on a control (n = 18), high-glucose (n = 7), or a sugar-free (n = 6) diet in male mice (B). p values via log-rank test.
(C) Age at tumor onset. p values via Kruskal-Wallis test with Dunn’s post hoc test.
(D) Tumor volume increase every 2 weeks. p values via Kruskal-Wallis test with Dunn’s post hoc test.
(E) Representative histology from sugar-free, control, and high-glucose diet tumors, at 12–16 weeks of age. Scale, 100 μm. Inset at 2.5× magnification.
(F and G) Quantification of cellular density (F) and Ki67hi cells (G) in the tumors of sugar-free, control, and high-glucose diet male and female mice (n = 3/group, with analysis of 6 images per biological replicate).
(H and I) Overall pancreatic cancer survival of female (H) and male (I) mice on control and altered sugar diets. p via log-rank test.
(J) Normalized enrichment scores of GSEA for gene expression in tumors from sugar-free fed mice as compared to a high-glucose diet (n = 6/group).
(K) Metabolite levels of sugar-free versus high-glucose-fed mice (n = 10, 25).
(L) Tumors from mice fed control (n = 4), high-protein (n = 6), high-glucose (n = 6), 10% fat (n = 6), and 30% fat (n = 6) diets, as assessed for cell-cycle expression. Mice were categorized based on their blood glucose level at tumor harvesting and gene set variation analysis (GSVA) enrichment of the cell-cycle gene set was assessed.
Diets include a mixture of multiple simple sugars and altered ratios of non-sugar constituents. To dissect the effect of individual sugar components, we followed male TAg+ mice that were exposed, from in utero onward, to a low-sugar diet supplemented with normal drinking water or drinking water containing 5% fructose, 5% glucose, or 5% sucrose. Through MRI monitoring (Figure S6), no significant effect of additional sugar was observed on the cumulative incidence and age of tumor onset (Figures 5A and 5B). The determination of growth rates likewise indicated no effect of additional sugars on tumor growth (Figure 5C). However, the addition of glucose, but not fructose or sucrose, substantially increased the tumor-induced mortality (Figure 5D). These results suggest two major roles of dietary sugar on pancreatic cancer. First, sugar starvation is associated with a delay in the onset and a reduction in growth of the cancer (Figure 4). Second, excessive glucose, and not the other sugars tested, is associated with an increase in the lethality of the cancer (Figure 5D). To determine whether these two properties are linked, we aged female TAg+ mice, which demonstrated the strongest protection of a sugar-free diet (Figure 4H), on the control diet during longitudinal MRI assessment. At the point of first tumor detection, we switched a subset of these mice to the sugar-free diet and monitored pancreatic cancer growth. The switch to a sugar-free diet after first tumor detection delayed the growth of the tumors in female mice, similar to the growth levels observed in mice continuously on a sugar-free diet (Figure 5E). By contrast, while female mice continually on a sugar-free diet show no tumor-induced mortality within the observation period, mice switched onto a sugar-free diet at tumor detection maintained the high level of mortality associated with control-diet mice (Figure 5F). These results are consistent with a model of dietary sugar in which the effect on lethality is programmed in at the point of tumor development, while the effect on tumor growth is a continuous property.
Figure 5.

Sugar Withdrawal Slows Pancreatic Cancer Growth without Restoring Survival
TAg+ mice were placed on an alternative nutritional exposure and assessed through MRI.
(A) Cumulative incidence of pancreatic cancer in male mice on a low-sugar diet with normal drinking water (n = 24) or drinking water containing 5% glucose (n = 8), 5% fructose (n = 10), or 5% sucrose (n = 8). p values via log-rank test.
(B) Age at tumor onset. p values via Kruskal-Wallis test with Dunn’s post hoc test.
(C) Tumor volume increase every 2 weeks. p values via Kruskal-Wallis test with Dunn’s post hoc test.
(D) Overall survival of mice.
(E) Female TAg+ mice on a control diet were assessed through MRI for tumors. At first detection, cohorts of mice were switched to a sugar-free diet. Longitudinal monitoring of tumor growth in female mice with either a continued control diet (n = 17), a sugar-free diet (n = 8), or a switch to a sugar-free diet (n = 10). Tumor volume increase occurred every 2 weeks. p values via Kruskal-Wallis test with Dunn’s post hoc test.
(F) Overall survival of female mice on control, sugar-free, or control → sugar-free switched diets. p values via log-rank test.
Component Analysis of Complex Diets Identifies Causative Drivers in Murine and Human Pancreatic Cancer
Using pairwise comparisons, we identified distinct effects for dietary components in murine pancreatic acinar carcinoma. However, with the exception of the addition of sugar components to water, diet modification changes the overall nutritional composition, in addition to the intended effect. We therefore performed a nutritional landscape analysis. We directly compared the tumor growth across a complete dietary modification set (Figures S7A and S7B). This allowed us to measure three distinct pathological features: tumor onset, tumor growth, and tumor-associated mortality. We fitted the pathological features onto a nutritional principal-component analysis (PCA), and identified three key features (Figures 6A, S7C, and S7D). First, tumor onset inversely correlated with dietary protein levels. This relationship was observed in a direct comparison (Figure 2); however, it is notable that the delayed tumor onset in sugar-free diet mice (Figure 4A) can be attributed to the higher protein content of this diet, rather than the low sugar content. Second, tumor growth rates were driven by two dietary components, namely higher glucose levels and lower protein levels, again, according with individual analyses. Third, tumor mortality rates were also driven by two dietary components, with the stronger effect being higher glucose levels and a weaker association with higher dietary fat levels. It is important, however, to consider that even a large multi-diet nutritional landscape analysis is limited in the ability to attribute phenotypes to particular dietary components. Variation in multiple nutritional components in each diet, variation in total energy density, and variation in food intake all can contribute to the observed effect. This nutritional landscape analysis provides a more nuanced view than the individual dietary component analyses we performed above, demonstrating the differential effects of dietary nutrient on murine pancreatic acinar carcinoma.
Figure 6.

Nutritional Landscape Modeling Identifies Independent Effects of Dietary Protein, Fat, and Sugar on Pancreatic Cancer in Mice
For a Figure360 author presentation of Figure 6, see https://doi.org/10.1016/j.celrep.2020.107880.
(A) TAg+ mice on control (n = 22), high-protein (n = 10), 10% fat (n = 15), 30% fat (n = 16), high-glucose (n = 15), or sugar-free diets (n = 14) were longitudinally monitored for pancreatic cancer growth. For each diet, the proportion of dietary components (fat, protein, and sugar) and total energy density were plotted on a principal-component analysis (PCA) plot (red). The average age of tumor onset, lethality, and growth rate effects is shown in blue.
(B) Wild-type mice on control (n = 4), high-protein (n = 7), 10% fat (n = 8), 30% fat (n = 9), high-glucose (n = 7), sugar-free (n = 5), or low-sugar diets (n = 6) were harvested for healthy pancreatic tissue. TAg+ mice were harvested for pancreatic tumors or tumor-adjacent tissue after being fed control (n = 12, 6), high-protein (n = 14, 8), 10% fat (n = 18, 10), 30% fat (n = 12, 8), high-glucose (n = 24, 13), sugar-free (n = 8, 13), or low-sugar diets (n = 9, 5). Global PCA analysis of untargeted metabolomics on all of the samples, coded by tissue type.
(C–E) PCA analysis of untargeted metabolomics in healthy pancreatic tissue (C), adjacent tissue (D), or tumor tissue (E), color-coded by diet.
(F) Expression of Mad2l1 in pancreatic cancers harvested from mice with different diets mapped onto the nutritional landscape.
We focused on the effects of diet on the tumor; however, diet can also influence healthy tissue. To observe the dietary impact on pancreatic metabolism, we performed untargeted metabolomics on healthy pancreatic tissue (from wild-type mice without pancreatic tumors), pancreatic tumors, and the unaffected tissue surrounding pancreatic tumors. Distinct metabolic profiles were observed for pancreatic cancers compared to healthy pancreatic tissue (Figure 6B). Tumor-adjacent tissue gave an intermediate profile, consistent with pre-tumor formation in the transgenic tissue. While the different diets induced distinct metabolic shifts in healthy pancreatic tissue (Figure 6C), the global metabolic profile in tumors and tumor-adjacent tissue were more similar regardless of the diet (Figures 6D and 6E). This metabolic convergence is consistent with an oncogenic pressure to adopt a particular metabolic configuration for proliferation and the generation of biomass.
In the human context, studying the effect of diet on pancreatic cancer is problematic. As a disease with late detection and an effect on patient appetite, prospective studies are essential for the causal dissection of disease drivers. Few population studies are, however, sufficiently powered to study such a rare cancer. We therefore turned to the European Prospective Investigation into Cancer and Nutrition (EPIC) study, an ongoing prospective cohort designed to investigate the relationships between diet, lifestyle, and environmental factors on cancer and other chronic diseases. More than half a million participants were enrolled in 23 centers across 10 European countries from 1992 to 2000. Epidemiological information was collected at the time of recruitment and included medical history, anthropometric measures, and lifestyle and dietary characteristics, with ongoing follow-up for cancer outcomes. For the current analysis, epidemiologic data were available for 465,076 individuals, 1,344 individuals of which had developed pancreatic cancer during the follow-up period. Using a multivariable Cox proportional hazards model and taking into account smoking status, body mass index (BMI), age, diabetes, and sex, we evaluated the effects of eight dietary components on the risk of pancreatic cancer. The only significant effect observed was a protective effect of dietary plant fat, with a hazard ratio of 0.9926 (Table S1), which translates to a ∼0.74% decrease in the risk of pancreatic cancer development per gram increase in daily plant fat consumption. This effect was largely unchanged following control for by diabetes, smoking, BMI, age at recruitment, or sex (see Data Resource on Mendeley Data in STAR Methods).
We investigated genotype-dependent dietary effects through integrating nutritional information with genotype information for 5,726 individuals comprising 465 pancreatic cancer cases and 5,261 controls. A genome-wide gene × environment (GxE) interaction analysis was conducted to detect interactions between dietary factors and genotype on pancreatic cancer susceptibility (Figure S8). A total of 5 loci reached p values of ≤10−7 for their effect on pancreatic cancer susceptibility given the sugar intake (Table 1). One locus, at LINC01365 neighboring the MAD2L1 gene (Table 1) and within a regulatory region linked to MAD2L1 expression (Figure S9), reached a p value of 7.3 × 10⁻⁸ for GxE with sugar intake. An interaction between sugar intake and MAD2L1 expression is supported through our transcriptional analysis of murine tumors, in which dietary glucose levels were positively associated with the regulation of Mad2l1 expression in the tumor (Figure 6F). We also observed one locus modifying the previously identified effect of plant fat consumption on pancreatic cancer risk (p < 10−5). The top locus, DIRC3, had a p value of 3.07 × 10⁻⁶ (Table 1; Figure S10). We further evaluated these loci with credible set analysis (Fuchsberger et al., 2016). We constructed credible sets of variants that contain the variant causal for the corresponding association signal with ≥99% probability. These results demonstrate that, as in mice, the nutritional composition of the diet influences susceptibility to pancreatic cancer in humans.
Table 1.
Gene-Environment Interactions for Dietary Components in Pancreatic Cancer Susceptibility
| Chr:position | Lead SNP | Allele | Freq | OR (95% CI) | Interaction p Value | |
|---|---|---|---|---|---|---|
| Genetic Interactions with Sugar Intake | ||||||
| ST6GALNAC3 | 1:76863822 | rs2392033 | T/C | 0.33 | 1.00069 (1.00045–1.00092) | 1.13 × 10⁻⁸ |
| LAMA2 | 6:129773785 | rs1336255 | G/A | 0.41 | 1.00062 (1.0004–1.00084) | 2.38 × 10⁻⁸ |
| DNAH7 | 2:196591273 | rs79514005 | C/T | 0.05 | 1.0014 (1.00088–1.0019) | 3.55 × 10⁻⁸ |
| LINC01365 / MAD2L1 | 4:120688046 | rs80287428 | C/G | 0.06 | 1.0013 (1.0008–1.0017) | 7.3 × 10⁻⁸ |
| CSMD1 | 8:2759532 | rs341752 | C/G | 0.22 | 1.00068 (1.00042–1.00094) | 3.07 × 10⁻⁷ |
| Genetic Interactions with Plant Fat Intake | ||||||
| DIRC3 | 2:218369738 | rs12328323 | G/A | 0.39 | 1.0015 (1.00086–1.0021) | 3.07 × 10⁻⁶ |
Sample size of 5,226 individuals comprising 465 pancreatic cancer cases and 5,261 controls. The most significant associations in each respective dietary group are shown, for dietary factors with suggestive (p ≤ 10−5) or greater associations. EA, effect allele; EAF, effect allele frequency; Freq (effect allele frequency), based on EPIC control samples; NEA, non-effect allele; 95% CI, 95% confidence interval; OR, odds ratio; SNP, single-nucleotide polymorphism.
Discussion
The parallel analysis of multiple obesity, diabetes, and diet-related variables in pancreatic cancer mice has identified two key principles of pancreatic cancer susceptibility. The first is that pancreatic cancer onset, growth, and lethality can be modulated via independent forces, rather than being inherently linked characteristics. A reasonable supposition could have been made that pancreatic cancer lethality was simply derived from tumor growth rates; here, however, we identify multiple contexts (high-fat diet, dietary sugar withdrawal) in which these effects were disentangled. The second key principle is that both quantitative and qualitative effects of diet were observed, with a distinct modulation of pancreatic cancer by calorie quantity (obesity) and source (nutrient composition). The former principle cannot be addressed using existing patient datasets; the latter principle was observed in the EPIC study, with nutrient composition also modulating pancreatic cancer susceptibility in a prospective human cohort. We can consider the effects of diet on each of the pancreatic cancer kinetic features in turn.
Tumor Onset: in the nutritional landscape analysis, delayed tumor onset tracked strongly with increased dietary protein. High-protein diets have been observed to inhibit tumor initiation in non-pancreatic tumor models (Ho et al., 2011). However, pancreatic cancers, unlike healthy pancreatic cells, rely on exogenous protein for proliferation, taken in via macropinocytosis (Davidson et al., 2017; Wyant et al., 2017). Furthermore, high circulating plasma branched-chain amino acids (BCAAs) are strongly associated with pancreatic cancer (Mayers et al., 2014). A potential unification of these discrepancies may lie in the origin of these BCAAs, with pancreatic cancer associated with the long-term pool derived from tissue breakdown rather than the short-term dietary pool (Mayers et al., 2014). The availability of high dietary protein may inhibit this tissue breakdown and thus indirectly inhibit tumor initiation; however, further mechanistic work is required.
Tumor Growth: in our mouse study, three diet-related factors independently increased the rate of pancreatic cancer growth: calorie quantity, reduced proportions of dietary protein, and the presence of dietary sugar. Of particular importance is insulin, which is elevated in the obese mouse strains and is increasingly recognized as a potential mitogen (see below). As the expression of many of these mediators is altered in obese versus non-obese adipose tissue (Hansen et al., 2010; Incio et al., 2016), it is likely that the effect observed here is mediated by the cumulative impact of these factors. The function of sugar, in particular glucose, in increasing the rate of tumor growth is potentially explained by the Warburg effect. Unlike the pre-cancerous precursor cells, which typically use the efficient oxidative phosphorylation pathway, most cancer cells use aerobic glycolysis (Vander Heiden et al., 2009). While aerobic glycolysis is less efficient at energy metabolism, it allows the rapid expansion of biomass required for highly proliferative cells and appears to confer other important advantages (Kim and Dang, 2006). Under the traditional Warburg model, the dependence of cancer cells on aerobic glycolysis makes glucose availability a limiting factor for energy production, with additional glucose thus allowing more rapid division. An alternative explanation for the Warburg phenomenon is that increased glycolysis is more important for carbon incorporation into the dividing biomass rather than ATP production (Lunt and Vander Heiden, 2011). Here, we find suggestive molecular evidence to indicate that dietary sugar drives the cell cycle in pancreatic cancer cells, with increased ribosomal capacity and utility for biomass production. Perhaps the most attractive hypothesis for molecular mechanism is hyperinsulinemia. While insulin secretion was not measured in our study, hyperinsulinemia is a well-known risk factor for pancreatic cancer (Andersen et al., 2017). Identifying the causative direction of this association is problematic; however, genetic reduction in insulin secretion capacity in the KrasG12D mouse model results in a slowing of pancreatic cancer initiation (Zhang et al., 2019). Together with the efficacy of phosphatidylinositol 3-kinase (PI3K) inhibitors, suppressing insulin signaling, in pre-clinical models of pancreatic cancer (Hopkins et al., 2018), this suggests that increased insulin secretion may be a primary mechanism by which obesity and dietary glucose influences pancreatic cancer. The effect of dietary protein in suppressing tumor proliferation was not predicted; however, it appears to act in direct opposition of dietary sugar, downregulating the same key pathways.
Tumor-Associated Mortality: three individual factors increased the mortality rate from pancreatic cancer—obesity, high-fat diets, and high-glucose diets. In the case of obesity, it is unlikely that mortality can be directly attributed to the concurrent effect on the cancer growth rate, as the obese mice died with tumor burdens that were far lower than those of wild-type mice. For both the high-fat and high-glucose diets, we also have formal evidence that the effect on mortality was independent. For the high-fat diet, the excessive mortality in male mice fed a high-fat diet was not accompanied by increased tumor growth rates. For dietary glucose, switching high-glucose mice onto a sugar-free diet at tumor detection dramatically slowed tumor growth rates, but did not decrease mortality. Whether these are two distinct effects or whether the increased mortality in high-fat diet-fed mice is due to elevated sugars in the same diets, is debatable. Regardless, two possibilities exist to account for this growth-independent effect on mortality. First, it is plausible that the dietary exposures imprint on the developing cancer a more pathogenic phenotype. The factors that determine the pathogenicity of pancreatic cancer are poorly defined, but could include the precise anatomical location where the tumor develops (Artinyan et al., 2008) or the increased expression of toxic by-products such as lipases (Hirschi et al., 1991; Niedergethmann et al., 2004). A second, not mutually exclusive, possibility is that the tumor itself is unaffected by the dietary exposure, but the host is rendered more sensitive. An analogy can be made here to the increased lethality of pancreatic cancer in less robust older patients (Niedergethmann et al., 2004). In this regard, it is notable that added dietary glucose in mice increases mortality and decreases competitive fitness (Ruff et al., 2013), and intravenous glucose delivery increases mortality in critically ill patients (der Voort et al., 2006). Recently, it has been observed in mouse pancreatic ductal adenocarcinoma that preventing adipose tissue wasting decreases survival, suggesting that adipose tissue is both responsive to pancreatic cancer and contributes to the mortality of cancer-bearing mice (Danai et al., 2018). Support for this model is found in our global metabolic analysis, in which the effect of diet was greater in healthy tissue than in the tumor tissue itself. This potential interplay between tumor toxicity and host fragility in determining tumor-associated mortality increases the complexity of identifying molecular mediators.
The human epidemiological study identified two signals, a beneficial effect of dietary plant-derived fat and a (genotype-dependent) detrimental effect of dietary sugars. The beneficial effect of plant-derived fat was not assessed in the mouse study, which used animal-based fats. A beneficial effect of dietary plant-derived fats could explain the ∼50% reduced incidence of pancreatic cancer observed in vegetarians (Appleby et al., 2016). While this could also be mediated by meat avoidance, no direct detrimental effect of red meat consumption on pancreatic cancer was observed in the EPIC cohort (Rohrmann et al., 2013), making a protective effect of plant-derived fats a more attractive hypothesis. A plethora of plant-derived molecular mediators have been proposed to have anti-cancer properties, contributing to the health benefits of the “Mediterranean diet.” The EPIC cohort analysis revealed an additional gene-dependent effect of glucose, linked to allelic variation in the long non-coding LINC01365 gene. LINC01365 itself has no known function and may be a transcribed enhancer for the neighboring gene, MAD2L1. MAD2L1 encodes a spindle assembly checkpoint protein involved in chromosome stability and the cell cycle. Increased MAD2L1 expression is associated with breast ductal, salivary duct, and hepatocellular cancers (Ko et al., 2010; Li et al., 2017; Scintu et al., 2007; Wang et al., 2015) via driving tumor proliferation (Li et al., 2017). MAD2L1 has also been implicated in the pathogenesis of pancreatic ductal adenocarcinomas (Fukuhisa et al., 2019). The MAD2L1 pathway is intimately linked to the insulin signaling pathway (Choi et al., 2016), and we demonstrate in mice a direct relationship between dietary sugar and Mad2l1 expression. Synergistic effects of genetic variation and glucose-mediated upregulation on MAD2L1 expression could precipitate initiation of the cell cycle, contributing to the early formation of the tumor and subsequent aggressiveness.
Our study uses both mouse models and human epidemiological data to dissect the effect of nutrition on pancreatic cancer. There are strengths and limitations to both approaches. With the inability to dissect the interacting risk factors from patient data, reliance on animal models is critical to formally separate effects such as obesity versus nutrition. Nevertheless, the limitations of the mouse model used here need to be considered. A multitude of animal models for pancreatic cancer exist (Saloman et al., 2019). The TAg oncogenic driver is relatively crude, although the molecular impact has been well studied, and the disruption of both KRAS and p53, two commonly mutated genes in pancreatic cancer patients (Hidalgo, 2010), results in an aberrations similar to patients (Hobbs et al., 2016). A more important limitation may be the acinar origin of the tumor, which only reflects a minority of patient cases. Of note, the TAg system does model the complexity of tumor composition, with the interaction of genetically heterogeneous cancer cells, cancer stem cells, tumor stroma, and the immune system, a complexity that is generally lost in cell line systems, even after transfer into mice. Epidemiological work in patients overcomes many of the difficulties of animal models. We should note, however, that even the best-designed observational trial will suffer from unaccounted for confounding effects and erroneous data. In particular, nutritional measurement is notoriously different to validate and changes over time. The heterogeneity in pancreatic cancer type and the limitation of looking at a single snapshot of the diet also dilute effect sizes. In this regard, we consider the mouse and epidemiological aspects to synergize, with effects observed across both methodologies that are much more likely to be robustly reproduced. Here, the interactions between dietary sugar and MAD2L1 stand out, with potentially profound clinical implications. An improved understanding of which dietary factors act as pancreatic cancer risk factors could allow earlier screening and improved detection. Finally, dietary modification is a potential pathway to restrict tumor growth, such as glucose restriction in individuals bearing the risk allele neighboring MAD2L1. We would, however, based on our mouse results, caution that even dietary interventions that succeeded in slowing tumor growth may not affect mortality.
STAR★Methods
Key Resources Table
| REAGENT or RESOURCE | SOURCE | IDENTIFIER |
|---|---|---|
| Antibodies | ||
| Goat anti-Trypsin | R&D Systems | AF3565 |
| Rat Anti-CD31 clone: MEC13.3 | Biolegend | 102502 |
| Rabbit Anti-Ki67 | Abcam | ab15580 |
| DAPI | Life Technologies | D1306 |
| Chicken anti-Rat Alexa Fluor 647 | Life Technologies | A21472 |
| Donkey anti-Rabbit Alexa Fluor 555 | Life Technologies | A31572 |
| Donkey anti-Goat Alexa Fluor 488 | Life Technologies | A11055 |
| Critical Commercial Assays | ||
| HumanHap550v3 Genotyping BeadChip | Illumina | https://www.illumina.com |
| HumanOmniExpress-12v1_A Genotyping BeadChips | Illumina | https://www.illumina.com |
| Illumina 660W | Illumina | https://www.illumina.com |
| RNA isolation: RNeasy Mini kit | QIAGEN | Cat No./ID: 74106 |
| QuantSeq 3′mRNA-Seq Library Prep Kit for Illumina | Lexogen | https://www.lexogen.com |
| Deposited Data | ||
| Transcriptome data (original) ArrayExpress as dataset E-MTAB-8227 | This paper | https://www.ebi.ac.uk/arrayexpress/experiments/E-MTAB-8227/ |
| Haplotype Reference Consortium panel | Loh et al., 2016 | http://www.haplotype-reference-consortium.org/ |
| Data Resource 1: Dietary composition | https://doi.org/10.17632/wcb2xsg6pj.3 | https://data.mendeley.com/datasets/wcb2xsg6pj/3 |
| Data Resource 2: Cumulative incidence and survival curves in mice | https://doi.org/10.17632/wcb2xsg6pj.3 | https://data.mendeley.com/datasets/wcb2xsg6pj/3 |
| Data Resource 3: Nutritional landscape modeling | https://doi.org/10.17632/wcb2xsg6pj.3 | https://data.mendeley.com/datasets/wcb2xsg6pj/3 |
| Data Resource 4: Transcriptome analysis | https://doi.org/10.17632/wcb2xsg6pj.3 | https://data.mendeley.com/datasets/wcb2xsg6pj/3 |
| Data Resource 5: Full dataset of Liquid chromatography mass spectrometry | https://doi.org/10.17632/wcb2xsg6pj.3 | https://data.mendeley.com/datasets/wcb2xsg6pj/3 |
| Data Resource 6: Cox proportional hazards model | https://doi.org/10.17632/wcb2xsg6pj.3 | https://data.mendeley.com/datasets/wcb2xsg6pj/3 |
| Data Resource 7: Data characteristics and matrix of Pearson correlation coefficients | https://doi.org/10.17632/wcb2xsg6pj.3 | https://data.mendeley.com/datasets/wcb2xsg6pj/3 |
| Experimental Models: Organisms/Strains | ||
| B6.CgTg(Ela1TAg∗)289Mjt/J | The Jackson Laboratory | https://www.jax.org/ |
| B6.Cg-Lepob/J | The Jackson Laboratory | https://www.jax.org/ |
| B6.BKS(D)-Leprdb/J | The Jackson Laboratory | https://www.jax.org/ |
| Software and Algorithms | ||
| STAR aligner | Dobin et al., 2013 | https://github.com/alexdobin/STAR |
| “EdgeR” | Robinson et al., 2010 | www.bioconductor.org |
| Proteowizard toolkit | Harrell, 2019 | http://proteowizard.sourceforge.net |
| ImagJ software | National Institute of Health, Bethesda, USA | Open source image processing software (https://imagej.nih.gov/ij/download.html) |
| R programming language v3.4.3 | R Core Team, 2013 | https://www.R-project.org/ |
| “rms” v5.1-3.1 | Harrell, 2019 | https://www.R-project.org/ |
| “survival” v2.44-1.1 | Therneau and Grambsch, 2000 | https://www.R-project.org/ |
| “lme4” v3.1-140 | Pinheiro et al., 2019 | https://www.R-project.org/ |
| “vegan” | Oksanen et al., 2010 | https://www.R-project.org/ |
| flashPCA v2.0 | Abraham et al., 2017 | https://github.com/gabraham/flashpca |
| “limma” | Kutalik et al., 2011 | www.bioconductor.org |
| “plotly” v4.8.0.9000 | Sievert, 2020 | https://www.R-project.org/ |
| “clusterProfiler” v3.6.0 | Yu et al., 2012 | N/A |
| “GSVA” v1.26.0 | Hänzelmann et al., 2013 | www.bioconductor.org |
| PLINK software v1.90 | Purcell et al., 2007 | https://www.cog-genomics.org/plink/2.0/ |
| QUICKTEST v0.95 | Kutalik et al., 2011 | https://wp.unil.ch/sgg/program/quicktest/ |
| XCMS | Smith et al., 2006 | N/A |
| Molecular Signatures Database | MSigDB version 5.2 | http://bioinf.wehi.edu.au/software/MSigDB/ |
| Other | ||
| low sugar chow (ssniff® R/M-H) | ssniff® | http://www.ssniff.com/ |
| control diet (ssniff® EF R/M Control) | ssniff® | http://www.ssniff.com/ |
| 10% fat diet (ssnaiff® EF R/M with 10% Fat) | ssniff® | http://www.ssniff.com/ |
| 30% fat diet (ssniff® EF R/M with 30% Fat) | ssniff® | http://www.ssniff.com/ |
| high glucose diet (ssniff® EF R/M High glucose) | ssniff® | http://www.ssniff.com/ |
| sugar-free diet (ssniff® EF R/M Glucose free, low CH) | ssniff® | http://www.ssniff.com/ |
| high protein diet (ssniff® EF R/M High Protein) | ssniff® | http://www.ssniff.com/ |
Resource Availability
Lead Contact
Further information and requests for resources and reagents should be directed to and will be fulfilled by the Lead Contact, Prof. Adrian Liston (Adrian.Liston@babraham.ac.uk).
Materials Availability
This study did not generate new unique reagents.
Data and Code Availability
Data and code availability are provided through Data Resource files on Mendeley Data (https://doi.org/10.17632/wcb2xsg6pj.3 https://data.mendeley.com/datasets/wcb2xsg6pj/3). Dietary composition data is available in Data Resource 1. Full R analysis script and processed data for age tumor onset and tumor growth comparisons, as well as cumulative incidence and mortality curves in mice are available in Data Resource 2. Full R analysis script for nutritional landscape modeling analysis and processed data are available in Data Resource 3. The normalized RNaseq data is given in Data Resource 4 and the original data is available at ArrayExpress as dataset E-MTAB-8227 (https://www.ebi.ac.uk/arrayexpress/experiments/E-MTAB-8227/). The full dataset of Liquid chromatography mass spectrometry is provided in Data Resource 5. Cox proportional hazards models for effect of dietary nutrients on pancreatic cancer susceptibility are available on Data Resource 6. Data characteristics and matrix of Pearson correlation coefficients are available in Data Resource 7.
Experimental Model and Subject Details
Animals
Ela1-TAg (Ornitz et al., 1987; Tevethia et al., 1997), Leprdb/db (Chen et al., 1996) and Lepob/ob mice (Zhang et al., 1994) were purchased from Jackson on the C57BL/6 background and intercrossed. Both male and female mice were used, with longitudinal tracking. Sex and age are indicated on figures. The composition of the diets used is available in Data Resource 1 on Mendeley Data (https://dx.doi.org/10.17632/wcb2xsg6pj.3). In brief: low sugar chow (ssniff® R/M-H; 4.7 w/v sugar, 3.3% w/v fat, 19.0% w/v protein, “house diet”), control diet (ssniff® EF R/M Control; 10.8% w/v sugar, 4.2% w/v fat, 20.8% w/v protein), high protein diet (ssniff® EF R/M High Protein; 10.3% w/v sugar, 8.3% w/v fat, 45.2% w/v protein), 10% fat diet (ssniff® EF R/M with 10% Fat, beef tallow-derived; 18.3% w/v sugar, 10.1% w/v fat, 20.7% w/v protein), 30% fat diet (ssniff® EF R/M with 30% Fat, beef tallow-derived; 17.8% w/v sugar, 30.1% w/v fat, 20.8% w/v protein), high glucose diet (ssniff® EF R/M High glucose; ≥ 50.0% w/v sugar, 2.9% w/v fat, 19.1% w/v protein) and sugar-free diet (ssniff® EF R/M Glucose free, low CH; ≤ 2.0% w/v, 11.3% w/v fat, 52.5% w/v protein). Where indicated, drinking water was modified through the addition of 5% w/v glucose, 5% w/v fructose or 5% w/v sucrose. Except where indicated (“switched”), all dietary exposures were continual from the in utero stage onward, with breeder cages set up on the indicated diet, and transfer of pups at weaning to the same dietary exposure. Average daily food intake for the different diets was measured in a parallel wild-type cohort (Figure S4A), however individual variation in the total food intake of tumor mice was not measured. Mice were bred under specific pathogen–free conditions and moved to conventional conditions at seven weeks of age for longitudinal magnetic resonance imaging (MRI). Mouse housing conditions were kept at 20°C. All mice were used in accordance with the University of Leuven Animal Ethics Committee. Mouse-weight and non-fasting blood glucose were monitored throughout, in the mid-afternoon.
Human subjects
For evaluating the effect of diet on pancreatic cancer, we included individuals from the European Prospective Investigation into Cancer and Nutrition (EPIC) cohort with collected epidemiological information at the time of recruitment (1992-2000) for medical history, anthropometric measures and lifestyle/dietary characteristics. Personal identifying information, as available at local centers, is not transferred to the Internal Review Board of the International Agency for Research on Cancer (IARC) co-ordinating center. Informed consent was provided by each participant, and projects using the EPIC resource need to be cleared by both the IARC and local ethical review committees. For this analysis, epidemiologic and dietary data was available for 459,231 individuals [1,314 pancreatic cancer cases (males = 561 with agerecruitment = 57.07 ± 7.35 (mean ± SD) and ageexit = 66.45 ± 8.29; females = 753 with agerecruitment = 57.36 ± 7.66 and ageexit = 67.12 ± 8.53) and 457,917 non-cases (males = 133,539 with agerecruitment = 52.13 ± 9.91 (mean ± SD) and ageexit = 66.34 ± 9.92; females = 324,378 with agerecruitment = 50.70 ± 9.67 and ageexit = 64.80 ± 10.03)]. The EPIC data collection and the study population has been described in detail (Riboli et al., 2002). Incident pancreatic cancer cases were identified using a number of methods depending on the study center. Denmark, Italy, the Netherlands, Spain and the United Kingdom used population cancer registries. In France and Germany, pancreatic cancer cases were identified during follow-up from a combination of sources including health insurance records, cancer and pathology registries, and active follow-up directly through study participants or their next of kin. All cases were diagnosed with incident primary malignant adenocarcinoma of the exocrine pancreas. For the gene x environment (GxE) interaction analysis, we included 465 pancreatic cancer cases (males = 212 with agerecruitment = 56.11 ± 7.64 (mean ± SD) and ageexit = 62.12 ± 7.78; females = 253 with agerecruitment = 57.43 ± 7.27 and ageexit = 64.64 ± 8.07) and 5261 controls (males = 1995 with agerecruitment = 52.36 ± 9.11 (mean ± SD) and ageexit = 67.09 ± 9.36; females = 3266 with agerecruitment = 51.41 ± 9.51 and ageexit = 66.37 ± 10.20). Genotyping data for all cases and a control cohort (N = 318) were received from the Pancreatic Cancer Cohort Consortium (PanScan) working groups [Panscan I (males = 333 with agerecruitment = 56.77 ± 7.77 (mean ± SD) and ageexit = 66.32 ± 9.26; females = 312 with agerecruitment = 57.12 ± 6.90 and ageexit = 67.53 ± 8.95) and II (males = 48 with agerecruitment = 54.55 ± 7.68 (mean ± SD) and ageexit = 64.56 ± 7.99; females = 90 with agerecruitment = 57.60 ± 7.51 and ageexit = 67.61 ± 7.85) subsets] and an additional set of 4,943 controls was received from EPIC InterAct (males = 1,855 with agerecruitment = 51.94 ± 9.09 (mean ± SD) and ageexit = 66.69 ± 9.38; females = 3,088 with agerecruitment = 51.14 ± 9.55 and ageexit = 66.06 ± 10.22) (Scott et al., 2016).
Method Details
Magnetic Resonance Imaging
MRI was selected for longitudinal imaging in preference to computed tomography (CT) based on superior contrast in the rodent pancreas (a soft organ, unlike in humans), the ability to run without contrast agents that alter intestinal motility, and the non-ionizing nature of the scan. Mice were scanned under isoflurane anesthesia using a Bruker Biospin 9.4 Tesla Biospec small animal MR scanner (Bruker Biospin, Ettlingen, Germany). The scanner was equipped with an actively shielded gradient set of 600mT/m using a respiration triggered spin echo sequence (RARE) with 50 continuous slices of 0.5 mm thickness in interlaced mode (acquisition parameters: repetition time = 6000 ms, echo time = 15.9 ms, field of view = 4.0 × 6.0 cm, a matrix of 200 × 400, two dummy scans and two averages). For radio-frequency irradiation and detection, a 7.2 cm quadrature resonator was used. Mice were scanned every two weeks, without the use of contrast. Operators were masked to the genotype and treatment, and analysis was performed blinded to genotype and diet. Scans were processed in reverse chronological order, allowing the location of large end-point tumors to be identified and correlated with earlier time-point locations. Tumor numbers were recorded at end-point necroscopy and compared with the final MRI scan. The tumor size detection limit with this approach was determined to be 2-3mm in diameter.
Immunofluroscent imaging
Pancreatic tumors were fresh frozen in OCT, fixed in 4% PFA or acetone, and stained according to manufacturer’s protocol. Size-matched (0.8-1.2g) tumors were selected for analysis. Sections were stained using the polyclonal Ki67 (Rabbit Anti-Ki67, Abcam ab15580), Trypsin 3 / PRSS3 (Goat anti-Trypsin, R&D Systems AF3565) and monoclonal Anti-CD31 (Rat Anti-CD31 clone: MEC13.3, Biolegend 102502). For immunofluorescence the following detection antibody were used: Donkey anti-Goat Alexa Fluor 488 (Life Technologies, A11055), Donkey anti-Rabbit 555 (Life Technologies, A31572), Chicken anti-Rat 647 (Life Technologies, A21472) and DAPI (Life Technologies, D1306). Images were acquired using a Ziess 780 confocal microscope. Images were analyzed using ImageJ (National Institute of Health, Bethesda, USA) to calculate MFI on a per cell basis utilizing watershed function and excluding cells on the edge. The cells with an MFI > 80 were defined as “high” MFI positive for Ki67 analysis.
RNA-Seq data generation and pre-processing
RNaseq was performed on tumors extracted from TAg+ mice fed control, low sugar, high protein, 10% fat, 30% fat, high glucose, or sugar-free diets. Mice were assessed for tumor formation by palpation and dissected tumors were selected for similar size (0.8-1.2g) before sample freezing. Total RNA was isolated using RNeasy Mini kit (QIAGEN). RNA concentration and purity were determined spectrophotometrically using the Nanodrop ND-1000 (Nanodrop Technologies) and RNA integrity was assessed using a Bioanalyser 2100 (Agilent). 3′mRNA-seq library preparation and transcriptome analysis was performed by Lexogen (Austria) using the QuantSeq 3′mRNA-Seq Library Prep Kit for Illumina and QuantSeq data analysis workflow. Sample alignment was generated by STAR aligner. Raw count gene expression data were and normalized using trimmed mean of M-values (TMM) available from the “EdgeR” package (Robinson et al., 2010). The normalized dataset is given in Data Resource 4 at Mendeley Data (https://doi.org/10.17632/wcb2xsg6pj.3). The original data is available at ArrayExpress as dataset E-MTAB-8227 (https://www.ebi.ac.uk/arrayexpress/experiments/E-MTAB-8227/).
Liquid chromatography mass spectrometry
Pancreatic tissue was weighed (10–15 mg) and pulverized (Cryomill, Retsch) under liquid-nitrogen conditions. Polar metabolites were extracted from the pulverized tissue in 50% LC-MS grade methanol / LC-MS grade methanol 30% acetonitrile / 20% water (at −80°C) as described previously (Cantelmo et al., 2016). Next, proteins were pelleted by centrifugation at 20,000xg for 10 min at 4°C. The supernatant was transferred to a new Eppendorf and dried using a SpeedVac evaporator (Labconco). The dried metabolite samples were resuspended in 60% acetonitrile (LC-MS grade) and transferred to LC-MS vials. Measurements were performed using a Dionex UltiMate 3000 LC System (Thermo Scientific) in-line connected to a Q-Exactive Orbitrap mass spectrometer (Thermo Scientific). 15 ul of sample was injected and loaded onto a Hilicon iHILIC-Fusion (P) column (Achrom). A linear gradient was carried out starting with 90% solvent A (LC-MS grade acetonitrile) and 10% solvent B (10 mM ammoniumacetate pH 9.3). From 2 to 20 minutes the gradient changed to 80% B and was kept at 80% until 23 min. Next a decrease to 40% B was carried out to 25 min, further decreasing to 10% B at 27 min. Finally 10% B was maintained until 35 min. The solvent was used at a flow rate of 200 ul/min, the columns temperature was kept constant at 25°C. The mass spectrometer operated in negative ion mode, settings of the HESI probe were as follows: sheath gas flow rate at 30, auxiliary gas flow rate at 5 (at a temperature of 260°C). Spray voltage was set at 4.8 kV, temperature of the capillary at 300°C and S-lens RF level at 50. A full scan (resolution of 140.000 and scan range of m/z 50-1050) was applied. Mass spectrometry files were converted to the mzXML format using msConvert tool available from the proteowizard toolkit (Chambers et al., 2012).
Genotyping
Panscan I and II subsets were genotyped at the Core Genotyping Facility of the National Cancer Institute on Illumina HumanHap550 and Illumina Human610-Quad arrays, respectively. DNA extraction, genotyping and genotype calling procedures were performed in previous publications for Panscan I (Amundadottir et al., 2009) and Panscan II (Petersen et al., 2010). EPIC InterAct individuals were genotyped on the Illumina 660W- Quad BeadChip array at the Wellcome Trust Sanger Institute (sharing a large proportion of SNPs with the Illumina HumanHap550 array) (Langenberg et al., 2014). Genotyping details are given in Data Resource 7 on Mendeley Data (https://doi.org/10.17632/wcb2xsg6pj.3).
Quantification and Statistical Analysis
MRI data analysis
MRI data were analyzed with ImageJ (National Institute of Health, Bethesda, USA). Volume was inferred through measurement of the mean area at maximum radius, using the formula: 4/3∗area∗√(area/π). Predicted volume by MRI demonstrated a strong correlation with tumor weights after necropsy (Figure S1M). Statistical analysis was performed in R (v3.4.3) (Harrell, 2019; R Core Team, 2013). Kaplan-Meier curves were fitted using the “npsurv” function from the R “rms” (v5.1-3.1) package (Harrell, 2019). Cumulative incidence curves were visualized using the “survplot” function from the R “rms” (v5.1-3.1) package with the fun = function(x) {1 - x} argument. Survival curves were plotted using the same “survplot” function without the extra argument. Differences between two or more curves was performed using a log-rank test implemented in the “survdiff” function from the R “survival” (v2.44-1.1) package (Therneau and Grambsch, 2000). The complete dataset and analysis code is provided in Data Resource 2 on Mendeley Data (https://doi.org/10.17632/wcb2xsg6pj.3).
Cross-sectional analysis was performed with a linear mixed-effect model within each sex, including the cross level interaction between time and diet (i.e., the effect of time is allowed to vary between diet groups). This model provides a fixed-effect estimate for the interaction between change over time and diet. For the cross-sectional comparisons, we used the same model considering as reference time 9 weeks for the 11 week time-point, 11 weeks for the 13 week time-point and so. These linear mixed-effect models were fitted within each sex using the “lmer” function within “lme4” (Linear Mixed-Effects Models using ‘Eigen’ and S4) package in R. Nutritional landscape analysis was performed using “vegan” package in R, a two-dimensional coordination of all groups was first constructed based on the diet compositions (based on weight/volume of each macronutrient and overall energy density) using principle component analysis (PCA), and each nutrient component or mouse phenotype can be then plotted according to their averaged trend of increment along the landscape (denoted by arrow) using the “envfit” function; on this landscape, positively correlated parameters have similar directions of increment, negatively correlated parameters have nearly opposite directions of increment, and independent parameters are nearly orthogonal. The complete dataset and analysis code is provided in Data Resource 3 on Mendeley Data (https://doi.org/10.17632/wcb2xsg6pj.3).
Transcriptomics analysis
PCA was performed on auto-scaled data using the flashPCA package (v2.0) (Abraham et al., 2017). Differentially expressed genes and their false discovery rate (FDR) corrected p values were identified by the “limma” R package (Ritchie et al., 2015). Fisher combined probabilities for the comparisons of sugar free versus control and the sugar free versus high-glucose diets were calculated on the two-sided non adjusted p values. Bar graphs, scatterplots and boxplots were produced using the “plotly” R package (v4.8.0.9000) (Sievert, 2020). We used gene set enrichment analysis (GSEA) as implemented in the “clusterProfiler” R package (v3.6.0) (Yu et al., 2012) and gene set variation analysis (GSVA) as implemented in the “GSVA” R package (v1.26.0) (Hänzelmann et al., 2013). Gene set analysis was performed using gene sets from the Molecular Signatures Database (MSigDB v5.2 downloaded from http://bioinf.wehi.edu.au/software/MSigDB/), a collection of expert annotated gene sets. GSEA and GSVA scores were calculated for sets with a minimum of 10 detected genes, all other parameters were default. Pathway mapping was performed using the pathview package (version 1.18.2) using a color-scale range of ± 2∧0.5849652 (corresponding to a fold change of ± 50%) and 10 bins.
Diet assessment
Diet components were assessed in EPIC at baseline using three previously validated methods as follows: (i) quantitative dietary questionnaires: Portions were estimated systematically for each participant from 260 food items in the Netherlands and Germany. France, Spain and Italy used this method but based on meals rather than individual food items. Centres in Spain and Ragusa (Italy) conducted face-to-face dietary interview, whereas participants in France and northern Italy self-reported on their dietary habits; (ii) semiquantitative food frequency questionnaires: Standardized portions are used as opposed to estimating them individually. This semiquantitative method was used in Denmark, Norway, Naples in Italy and Umea in Sweden; (iii) combined dietary methods: Combines the semiquantitative food frequency questionnaire method with a 7-day or 14-day record on hot meals. The combined method was used in the United Kingdom and Malmo (Sweden). We evaluated correlation between eight nutrient intakes. Pearson correlation coefficients and the assessed nutritional variables are shown in Data Resource 7 on Mendeley Data (https://doi.org/10.17632/wcb2xsg6pj.3).
Multivariable Cox proportional hazards model
The Cox proportional hazards model, which allows us to estimate the effects of a variable in the presence of other explanatory variables included in the regression, was implemented to analyze time-dependent data (R package `survival` version 2.44-1.1). Control subjects with no pancreatic cancer were right-censored at the time of last follow-up. The event analyzed was pancreatic cancer incidence. Due to unavailability of the date of diagnosis and poor survival rates in pancreatic cancer (1,228 out of the 1,314 cases died during the follow-up period) we used date of death or the end of the follow-up period for the 86 cases alive as event date. We tested the effects of eight nutritional variables on pancreatic cancer incidence in 1,314 cases and 457,917 controls from EPIC with age at recruitment, body mass index, sex and smoking status as explanatory variables in the model.
Genotyping quality control of human datasets
To assess the quality of genotyping and uncover sample handling issues we conducted quality control with PLINK v1.90. Details on sample and variant QC are given on Data Resource 7 on Mendeley Data (https://doi.org/10.17632/wcb2xsg6pj.3). To account for possible substructures within the study population we conducted multidimensional scaling (MDS) to create continuous axes of genetic variation (Figure S8H). The resulting four principal components from the MDS analysis were used as covariates in the association analysis to adjust for ancestry effects.
Genotype imputation
The filtered genotype array data was imputed to the Haplotype Reference Consortium panel using the free Sanger Imputation Service provided by the Wellcome Sanger Institute (Loh et al., 2016). More details on post-imputation filtering are given on Data Resource 7 on Mendeley Data (https://doi.org/10.17632/wcb2xsg6pj.3).
Gene x environment interaction analysis
GxE interactions were tested between eight nutritional variables and allelic effects of DNA variants in EPIC by modeling the logarithm of the odds of the pancreatic cancer status defined as follows: log(P(C)/1–P(C)) = β0+βGG+βEE+βGEGE+ε, where C is the cancer status, G is the genotype and E is the environmental exposure (nutrient intake). The interaction odds ratio [ORGE = exp(βGE)] measures the departure from the multiplicative effects of the corresponding main effects and can be interpreted as the increase in pancreatic cancer risk with one gram per day increase in the nutrient. The GxE interaction tests were conducted using the freely available software QUICKTEST v0.95 (Kutalik et al., 2011).
Untargeted metabolomics analysis
For untargeted metabolomics, peaks were extracted using XCMS (Smith et al., 2006) with pre-filter settings of a minimum of 10 consecutive scans with a minimum intensity of 10,000. Peaks with a minimum width of 18 s and a maximum width of 36 s were extracted over a retention time range of 240-1500 s with a signal to noise ratio of 10, a baseline noise level of 10,000 and a minimum m/z difference of - 0.0005. The resolution was set at 3 ppm. To improve batch integration, we performed an additional post-processing step to integrate peaks in individual samples that were initially not detected. Finally, we used a metabolite library of 186 authentic chemical standards and their fragmentation spectrum to match against chromatographic peaks in each sample by mass, retention time and fragmentation spectrum. The full dataset is given in Data Resource 5 on Mendeley Data (https://doi.org/10.17632/wcb2xsg6pj.3).
The data matrix with metabolite abundances was log2 transformed, metabolites or features detected in less than 10% of samples were removed entirely. Zero values of features present in more than 10% of samples were mean imputed. Mass spectrometry drift for each feature was assessed using pooled quality control samples and corrected using local linear regression. PCA was performed on auto-scaled data using the flashPCA package (v2.0). Bar graphs, scatterplots and boxplots were produced using the “plotly” R package (v4.8.0.9000).
Statistical analysis
In mice, age at tumor onset and tumor volume increase data are presented as the median and interquartile range given the ranked data type (distributions tested with Shapiro Wilk test). The exact value of n representing the number of mice within each group tested can be found in the figure legend. Statistical significance for these traits was tested using the Mann-Whitney U test for pairwise comparisons and the Kruskal-Wallis test with Dunn’s post hoc for multiple group comparisons. Differences between two or more pancreatic cancer survival curves was performed using a log-rank test implemented in the “survdiff” function from the R “survival” (v2.44-1.1) package (Therneau and Grambsch, 2000). Statistical analysis for the mouse data was performed in R (v3.4.3) (Harrell, 2019; R Core Team, 2013). All other statistical tests used, n numbers and P values are displayed in the appropriate tables, figures and legends. In humans, the Cox multivariate analysis was performed in R (v.3.6.1). P values < 0.05 were considered statistically significant for all analyses. In the gene-environment interaction analysis, suggestive genome-wide associations were considered at p ≤ 10−5.
Acknowledgments
This work was supported by the VIB, IUAP (T-TIME), the Biotechnology and Biological Sciences Research Council (BBSRC) through Institute Strategic Program Grant funding BBS/E/B/000C0427 and BBS/E/B/000C0428, and the Biotechnology and Biological Sciences Research Council Core Capability Grant to the Babraham Institute. I.P. is funded by the World Cancer Research Fund (WCRF UK) and World Cancer Research Fund International (2017/1641), the Wellcome Trust (WT205915/Z/17/Z), and the European Union’s Horizon 2020 Research and Innovation Programme (LONGITOOLS H2020-SC1-2019-874739 and DynaHEALTH H2020-PHC-2014-633595). The authors wish to acknowledge use of the BI Imaging Facility, which is funded through a BBSRC Institute Core Capability Grant. V.L. was supported by an FWO post-doctoral fellowship. We thank Hanne Juchtmans and Susann Schonefeldt for technical assistance and all of the staff at the molecular Small Animal Imaging Center (moSAIC) for MRI training and assistance. We thank Sarah-Maria Fendt for valuable feedback and Bart Ghesquière for performing the metabolomics measurements. We acknowledge the critical contribution of all of the members of the EPIC study.
Author Contributions
Conceptualization, J.D. and A.L.; Methodology, J.D., T.D., and U.H.; Software, V.L., J.G., T.K., and J.W.; Formal Analysis, V.L., J.G., A.U., K.R., T.K., and J.W.; Investigation, J.D., Y.L., and N.H.; Resources, M.J.G.; Data Curation, S.K.; Writing – Original Draft, J.D. and A.L.; Writing – Review & Editing, A.L.; Visualization, V.L., J.G., and J.W.; Supervision, I.P., P.C., and A.L.; Project Administration & Funding Acquisition, A.L.
Declaration of Interests
The authors declare no competing interests.
Published: July 14, 2020
Footnotes
Supplemental Information can be found online at https://doi.org/10.1016/j.celrep.2020.107880.
Contributor Information
Inga Prokopenko, Email: i.prokopenko@surrey.ac.uk.
Peter Carmeliet, Email: peter.carmeliet@kuleuven.vib.be.
Adrian Liston, Email: adrian.liston@babraham.ac.uk.
Supplemental Information
References
- Abraham G., Qiu Y., Inouye M. FlashPCA2: principal component analysis of Biobank-scale genotype datasets. Bioinformatics. 2017;33:2776–2778. doi: 10.1093/bioinformatics/btx299. [DOI] [PubMed] [Google Scholar]
- Amundadottir L., Kraft P., Stolzenberg-Solomon R.Z., Fuchs C.S., Petersen G.M., Arslan A.A., Bueno-de-Mesquita H.B., Gross M., Helzlsouer K., Jacobs E.J. Genome-wide association study identifies variants in the ABO locus associated with susceptibility to pancreatic cancer. Nat. Genet. 2009;41:986–990. doi: 10.1038/ng.429. [DOI] [PMC free article] [PubMed] [Google Scholar]
- Andersen D.K., Korc M., Petersen G.M., Eibl G., Li D., Rickels M.R., Chari S.T., Abbruzzese J.L. Diabetes, Pancreatogenic Diabetes, and Pancreatic Cancer. Diabetes. 2017;66:1103–1110. doi: 10.2337/db16-1477. [DOI] [PMC free article] [PubMed] [Google Scholar]
- Appleby P.N., Crowe F.L., Bradbury K.E., Travis R.C., Key T.J. Mortality in vegetarians and comparable nonvegetarians in the United Kingdom. Am. J. Clin. Nutr. 2016;103:218–230. doi: 10.3945/ajcn.115.119461. [DOI] [PMC free article] [PubMed] [Google Scholar]
- Artinyan A., Soriano P.A., Prendergast C., Low T., Ellenhorn J.D., Kim J. The anatomic location of pancreatic cancer is a prognostic factor for survival. HPB (Oxford) 2008;10:371–376. doi: 10.1080/13651820802291233. [DOI] [PMC free article] [PubMed] [Google Scholar]
- Aune D., Greenwood D.C., Chan D.S., Vieira R., Vieira A.R., Navarro Rosenblatt D.A., Cade J.E., Burley V.J., Norat T. ). Body mass index, abdominal fatness and pancreatic cancer risk: a systematic review and non-linear dose-response meta-analysis of prospective studies. Ann. Oncol. 2012;23:843–852. doi: 10.1093/annonc/mdr398. [DOI] [PubMed] [Google Scholar]
- Bardeesy N., DePinho R.A. Pancreatic cancer biology and genetics. Nat. Rev. Cancer. 2002;2:897–909. doi: 10.1038/nrc949. [DOI] [PubMed] [Google Scholar]
- Bosetti C., Rosato V., Li D., Silverman D., Petersen G.M., Bracci P.M., Neale R.E., Muscat J., Anderson K., Gallinger S. Diabetes, antidiabetic medications, and pancreatic cancer risk: an analysis from the International Pancreatic Cancer Case-Control Consortium. Ann. Oncol. 2014;25:2065–2072. doi: 10.1093/annonc/mdu276. [DOI] [PMC free article] [PubMed] [Google Scholar]
- Cantelmo A.R., Conradi L.C., Brajic A., Goveia J., Kalucka J., Pircher A., Chaturvedi P., Hol J., Thienpont B., Teuwen L.A. Inhibition of the Glycolytic Activator PFKFB3 in Endothelium Induces Tumor Vessel Normalization, Impairs Metastasis, and Improves Chemotherapy. Cancer Cell. 2016;30:968–985. doi: 10.1016/j.ccell.2016.10.006. [DOI] [PMC free article] [PubMed] [Google Scholar]
- Chambers M.C., Maclean B., Burke R., Amodei D., Ruderman D.L., Neumann S., Gatto L., Fischer B., Pratt B., Egertson J. A cross-platform toolkit for mass spectrometry and proteomics. Nat. Biotechnol. 2012;30:918–920. doi: 10.1038/nbt.2377. [DOI] [PMC free article] [PubMed] [Google Scholar]
- Chen H., Charlat O., Tartaglia L.A., Woolf E.A., Weng X., Ellis S.J., Lakey N.D., Culpepper J., Moore K.J., Breitbart R.E. Evidence that the diabetes gene encodes the leptin receptor: identification of a mutation in the leptin receptor gene in db/db mice. Cell. 1996;84:491–495. doi: 10.1016/s0092-8674(00)81294-5. [DOI] [PubMed] [Google Scholar]
- Choi E., Zhang X., Xing C., Yu H. Mitotic Checkpoint Regulators Control Insulin Signaling and Metabolic Homeostasis. Cell. 2016;166:567–581. doi: 10.1016/j.cell.2016.05.074. [DOI] [PMC free article] [PubMed] [Google Scholar]
- Cleary S.P., Gryfe R., Guindi M., Greig P., Smith L., Mackenzie R., Strasberg S., Hanna S., Taylor B., Langer B., Gallinger S. Prognostic factors in resected pancreatic adenocarcinoma: analysis of actual 5-year survivors. J. Am. Coll. Surg. 2004;198:722–731. doi: 10.1016/j.jamcollsurg.2004.01.008. [DOI] [PubMed] [Google Scholar]
- Danai L.V., Babic A., Rosenthal M.H., Dennstedt E.A., Muir A., Lien E.C., Mayers J.R., Tai K., Lau A.N., Jones-Sali P. Altered exocrine function can drive adipose wasting in early pancreatic cancer. Nature. 2018;558:600–604. doi: 10.1038/s41586-018-0235-7. [DOI] [PMC free article] [PubMed] [Google Scholar]
- Davidson S.M., Jonas O., Keibler M.A., Hou H.W., Luengo A., Mayers J.R., Wyckoff J., Del Rosario A.M., Whitman M., Chin C.R. Direct evidence for cancer-cell-autonomous extracellular protein catabolism in pancreatic tumors. Nat. Med. 2017;23:235–241. doi: 10.1038/nm.4256. [DOI] [PMC free article] [PubMed] [Google Scholar]
- der Voort P.H., Feenstra R.A., Bakker A.J., Heide L., Boerma E.C., van der Horst I.C. Intravenous glucose intake independently related to intensive care unit and hospital mortality: an argument for glucose toxicity in critically ill patients. Clin. Endocrinol. (Oxf.) 2006;64:141–145. doi: 10.1111/j.1365-2265.2006.02437.x. [DOI] [PubMed] [Google Scholar]
- Dobin A., Davis C.A., Schlesinger F., Drenkow J., Zaleski C., Jha S., Batut P., Chaisson M., Gingeras T.R. STAR: ultrafast universal RNA-seq aligner. Bioinformatics. 2013;29:15–21. doi: 10.1093/bioinformatics/bts635. [DOI] [PMC free article] [PubMed] [Google Scholar]
- Fuchsberger C., Flannick J., Teslovich T.M., Mahajan A., Agarwala V., Gaulton K.J., Ma C., Fontanillas P., Moutsianas L., McCarthy D.J. The genetic architecture of type 2 diabetes. Nature. 2016;536:41–47. doi: 10.1038/nature18642. [DOI] [PMC free article] [PubMed] [Google Scholar]
- Fukuhisa H., Seki N., Idichi T., Kurahara H., Yamada Y., Toda H., Kita Y., Kawasaki Y., Tanoue K., Mataki Y. Gene regulation by antitumor miR-130b-5p in pancreatic ductal adenocarcinoma: the clinical significance of oncogenic EPS8. J. Hum. Genet. 2019;64:521–534. doi: 10.1038/s10038-019-0584-6. [DOI] [PubMed] [Google Scholar]
- Gumbs A.A. Obesity, pancreatitis, and pancreatic cancer. Obes. Surg. 2008;18:1183–1187. doi: 10.1007/s11695-008-9599-3. [DOI] [PubMed] [Google Scholar]
- Hansen D., Dendale P., Beelen M., Jonkers R.A., Mullens A., Corluy L., Meeusen R., van Loon L.J. Plasma adipokine and inflammatory marker concentrations are altered in obese, as opposed to non-obese, type 2 diabetes patients. Eur. J. Appl. Physiol. 2010;109:397–404. doi: 10.1007/s00421-010-1362-5. [DOI] [PMC free article] [PubMed] [Google Scholar]
- Hänzelmann S., Castelo R., Guinney J. GSVA: gene set variation analysis for microarray and RNA-seq data. BMC Bioinformatics. 2013;14:7. doi: 10.1186/1471-2105-14-7. [DOI] [PMC free article] [PubMed] [Google Scholar]
- Harrell F.E.J. rms: Regression Modeling Strategies. Rpackage version 5.1-3.1. 2019. https://CRAN.R-project.org/web/packages/rms/index.html
- Hart A.R., Kennedy H., Harvey I. Pancreatic cancer: a review of the evidence on causation. Clin. Gastroenterol. Hepatol. 2008;6:275–282. doi: 10.1016/j.cgh.2007.12.041. [DOI] [PubMed] [Google Scholar]
- Hidalgo M. Pancreatic cancer. N. Engl. J. Med. 2010;362:1605–1617. doi: 10.1056/NEJMra0901557. [DOI] [PubMed] [Google Scholar]
- Hirschi K.K., Sabb J.E., Brannon P.M. Effects of diet and ketones on rat pancreatic lipase in cultured acinar cells. J. Nutr. 1991;121:1129–1134. doi: 10.1093/jn/121.7.1129. [DOI] [PubMed] [Google Scholar]
- Ho V.W., Leung K., Hsu A., Luk B., Lai J., Shen S.Y., Minchinton A.I., Waterhouse D., Bally M.B., Lin W. A low carbohydrate, high protein diet slows tumor growth and prevents cancer initiation. Cancer Res. 2011;71:4484–4493. doi: 10.1158/0008-5472.CAN-10-3973. [DOI] [PubMed] [Google Scholar]
- Hobbs G.A., Der C.J., Rossman K.L. RAS isoforms and mutations in cancer at a glance. J. Cell Sci. 2016;129:1287–1292. doi: 10.1242/jcs.182873. [DOI] [PMC free article] [PubMed] [Google Scholar]
- Hopkins B.D., Pauli C., Du X., Wang D.G., Li X., Wu D., Amadiume S.C., Goncalves M.D., Hodakoski C., Lundquist M.R. Suppression of insulin feedback enhances the efficacy of PI3K inhibitors. Nature. 2018;560:499–503. doi: 10.1038/s41586-018-0343-4. [DOI] [PMC free article] [PubMed] [Google Scholar]
- Incio J., Liu H., Suboj P., Chin S.M., Chen I.X., Pinter M., Ng M.R., Nia H.T., Grahovac J., Kao S. Obesity-Induced Inflammation and Desmoplasia Promote Pancreatic Cancer Progression and Resistance to Chemotherapy. Cancer Discov. 2016;6:852–869. doi: 10.1158/2159-8290.CD-15-1177. [DOI] [PMC free article] [PubMed] [Google Scholar]
- Kim J.W., Dang C.V. Cancer’s molecular sweet tooth and the Warburg effect. Cancer Res. 2006;66:8927–8930. doi: 10.1158/0008-5472.CAN-06-1501. [DOI] [PubMed] [Google Scholar]
- Ko Y.H., Roh J.H., Son Y.I., Chung M.K., Jang J.Y., Byun H., Baek C.H., Jeong H.S. Expression of mitotic checkpoint proteins BUB1B and MAD2L1 in salivary duct carcinomas. J. Oral Pathol. Med. 2010;39:349–355. doi: 10.1111/j.1600-0714.2009.00835.x. [DOI] [PubMed] [Google Scholar]
- Kutalik Z., Johnson T., Bochud M., Mooser V., Vollenweider P., Waeber G., Waterworth D., Beckmann J.S., Bergmann S. Methods for testing association between uncertain genotypes and quantitative traits. Biostatistics. 2011;12:1–17. doi: 10.1093/biostatistics/kxq039. [DOI] [PubMed] [Google Scholar]
- Langenberg C., Sharp S.J., Franks P.W., Scott R.A., Deloukas P., Forouhi N.G., Froguel P., Groop L.C., Hansen T., Palla L. Gene-lifestyle interaction and type 2 diabetes: the EPIC interact case-cohort study. PLOS Med. 2014;11:e1001647. doi: 10.1371/journal.pmed.1001647. [DOI] [PMC free article] [PubMed] [Google Scholar]
- Larsson S.C., Bergkvist L., Wolk A. Consumption of sugar and sugar-sweetened foods and the risk of pancreatic cancer in a prospective study. Am. J. Clin. Nutr. 2006;84:1171–1176. doi: 10.1093/ajcn/84.5.1171. [DOI] [PubMed] [Google Scholar]
- Li Y., Bai W., Zhang J. MiR-200c-5p suppresses proliferation and metastasis of human hepatocellular carcinoma (HCC) via suppressing MAD2L1. Biomed. Pharmacother. 2017;92:1038–1044. doi: 10.1016/j.biopha.2017.05.092. [DOI] [PubMed] [Google Scholar]
- Loh P.-R., Danecek P., Palamara P.F., Fuchsberger C., Reshef Y.A., Finucane H.K., Schoenherr S., Forer L., McCarthy S., Abecasis G.R. Reference-based phasing using the Haplotype Reference Consortium panel. Nat. Genet. 2016;48:1443–1448. doi: 10.1038/ng.3679. [DOI] [PMC free article] [PubMed] [Google Scholar]
- Lunt S.Y., Vander Heiden M.G. Aerobic glycolysis: meeting the metabolic requirements of cell proliferation. Annu. Rev. Cell Dev. Biol. 2011;27:441–464. doi: 10.1146/annurev-cellbio-092910-154237. [DOI] [PubMed] [Google Scholar]
- Mayers J.R., Wu C., Clish C.B., Kraft P., Torrence M.E., Fiske B.P., Yuan C., Bao Y., Townsend M.K., Tworoger S.S. Elevation of circulating branched-chain amino acids is an early event in human pancreatic adenocarcinoma development. Nat. Med. 2014;20:1193–1198. doi: 10.1038/nm.3686. [DOI] [PMC free article] [PubMed] [Google Scholar]
- Niedergethmann M., Wostbrock B., Sturm J.W., Willeke F., Post S., Hildenbrand R. Prognostic impact of cysteine proteases cathepsin B and cathepsin L in pancreatic adenocarcinoma. Pancreas. 2004;29:204–211. doi: 10.1097/00006676-200410000-00005. [DOI] [PubMed] [Google Scholar]
- Oksanen J., Blanchet F.G., Friendly M., Kindt R., Legendre P., McGlinn D., Minchin P.R., O’Hara R.B., Simpson G.L., Solymos P. vegan: Community Ecology Package. 2010. https://cran.r-project.org/web/packages/vegan/index.html
- Ornitz D.M., Hammer R.E., Messing A., Palmiter R.D., Brinster R.L. Pancreatic neoplasia induced by SV40 T-antigen expression in acinar cells of transgenic mice. Science. 1987;238:188–193. doi: 10.1126/science.2821617. [DOI] [PubMed] [Google Scholar]
- Petersen G.M., Amundadottir L., Fuchs C.S., Kraft P., Stolzenberg-Solomon R.Z., Jacobs K.B., Arslan A.A., Bueno-de-Mesquita H.B., Gallinger S., Gross M. A genome-wide association study identifies pancreatic cancer susceptibility loci on chromosomes 13q22.1, 1q32.1 and 5p15.33. Nat. Genet. 2010;42:224–228. doi: 10.1038/ng.522. [DOI] [PMC free article] [PubMed] [Google Scholar]
- Pinheiro J., Bates D., DebRoy S., Sarkar D., EISPACK Authors. Heisterkamp S., Van Willigen B., R Core Team nlme:Linear and Nonlinear Mixed Effects Models_. R package version 3.1-140. 2019. https://svn.r-project.org/R-packages/trunk/nlme
- Purcell S., Neale B., Todd-Brown K., Thomas L., Ferreira M.A., Bender D., Maller J., Sklar P., de Bakker P.I., Daly M.J., Sham P.C. PLINK: a tool set for whole-genome association and population-based linkage analyses. Am. J. Hum. Genet. 2007;81:559–575. doi: 10.1086/519795. [DOI] [PMC free article] [PubMed] [Google Scholar]
- R Core Team . R Foundation for Statistical Computing; 2013. R: A language and environment for statistical computing. [Google Scholar]
- Riboli E., Hunt K.J., Slimani N., Ferrari P., Norat T., Fahey M., Charrondière U.R., Hémon B., Casagrande C., Vignat J. European Prospective Investigation into Cancer and Nutrition (EPIC): study populations and data collection. Public Health Nutr. 2002;5(6B):1113–1124. doi: 10.1079/PHN2002394. [DOI] [PubMed] [Google Scholar]
- Ritchie M.E., Phipson B., Wu D., Hu Y., Law C.W., Shi W., Smyth G.K. limma powers differential expression analyses for RNA-sequencing and microarray studies. Nucleic Acids Res. 2015;43:e47. doi: 10.1093/nar/gkv007. [DOI] [PMC free article] [PubMed] [Google Scholar]
- Robinson M.D., McCarthy D.J., Smyth G.K. edgeR: a Bioconductor package for differential expression analysis of digital gene expression data. Bioinformatics. 2010;26:139–140. doi: 10.1093/bioinformatics/btp616. [DOI] [PMC free article] [PubMed] [Google Scholar]
- Rohrmann S., Linseisen J., Nöthlings U., Overvad K., Egeberg R., Tjønneland A., Boutron-Ruault M.C., Clavel-Chapelon F., Cottet V., Pala V. Meat and fish consumption and risk of pancreatic cancer: results from the European Prospective Investigation into Cancer and Nutrition. Int. J. Cancer. 2013;132:617–624. doi: 10.1002/ijc.27637. [DOI] [PubMed] [Google Scholar]
- Ruff J.S., Suchy A.K., Hugentobler S.A., Sosa M.M., Schwartz B.L., Morrison L.C., Gieng S.H., Shigenaga M.K., Potts W.K. Human-relevant levels of added sugar consumption increase female mortality and lower male fitness in mice. Nat. Commun. 2013;4:2245. doi: 10.1038/ncomms3245. [DOI] [PMC free article] [PubMed] [Google Scholar]
- Saloman J.L., Albers K.M., Cruz-Monserrate Z., Davis B.M., Edderkaoui M., Eibl G., Epouhe A.Y., Gedeon J.Y., Gorelick F.S., Grippo P.J. Animal Models: Challenges and Opportunities to Determine Optimal Experimental Models of Pancreatitis and Pancreatic Cancer. Pancreas. 2019;48:759–779. doi: 10.1097/MPA.0000000000001335. [DOI] [PMC free article] [PubMed] [Google Scholar]
- Sanchez G.V., Weinstein S.J., Stolzenberg-Solomon R.Z. Is dietary fat, vitamin D, or folate associated with pancreatic cancer? Mol. Carcinog. 2012;51:119–127. doi: 10.1002/mc.20833. [DOI] [PMC free article] [PubMed] [Google Scholar]
- Scintu M., Vitale R., Prencipe M., Gallo A.P., Bonghi L., Valori V.M., Maiello E., Rinaldi M., Signori E., Rabitti C. Genomic instability and increased expression of BUB1B and MAD2L1 genes in ductal breast carcinoma. Cancer Lett. 2007;254:298–307. doi: 10.1016/j.canlet.2007.03.021. [DOI] [PubMed] [Google Scholar]
- Scott R.A., Freitag D.F., Li L., Chu A.Y., Surendran P., Young R., Grarup N., Stancáková A., Chen Y., Varga T.V., CVD50 Consortium. GERAD_EC Consortium. Neurology Working Group of the Cohorts for Heart. Aging Research in Genomic Epidemiology (CHARGE) Alzheimer’s Disease Genetics Consortium. Pancreatic Cancer Cohort Consortium. European Prospective Investigation into Cancer and Nutrition–Cardiovascular Disease (EPIC-CVD) EPIC-InterAct. CHARGE Consortium. CHD Exome+ Consortium. CARDIOGRAM Exome Consortium A genomic approach to therapeutic target validation identifies a glucose-lowering GLP1R variant protective for coronary heart disease. Sci. Transl. Med. 2016;8:341ra76. doi: 10.1126/scitranslmed.aad3744. [DOI] [PMC free article] [PubMed] [Google Scholar]
- Siegel R.L., Miller K.D., Jemal A. Cancer statistics, 2016. CA Cancer J. Clin. 2016;66:7–30. doi: 10.3322/caac.21332. [DOI] [PubMed] [Google Scholar]
- Sievert C. CRC Press; 2020. Interactive Web-Based Data Visualization with R, plotly, and shiny. [Google Scholar]
- Smith C.A., Want E.J., O’Maille G., Abagyan R., Siuzdak G. XCMS: processing mass spectrometry data for metabolite profiling using nonlinear peak alignment, matching, and identification. Anal. Chem. 2006;78:779–787. doi: 10.1021/ac051437y. [DOI] [PubMed] [Google Scholar]
- Tevethia M.J., Bonneau R.H., Griffith J.W., Mylin L. A simian virus 40 large T-antigen segment containing amino acids 1 to 127 and expressed under the control of the rat elastase-1 promoter produces pancreatic acinar carcinomas in transgenic mice. J. Virol. 1997;71:8157–8166. doi: 10.1128/jvi.71.11.8157-8166.1997. [DOI] [PMC free article] [PubMed] [Google Scholar]
- Therneau T.M., Grambsch P.M. Springer; 2000. Modeling Survival Data: Extending the Cox Model. [Google Scholar]
- Vander Heiden M.G., Cantley L.C., Thompson C.B. Understanding the Warburg effect: the metabolic requirements of cell proliferation. Science. 2009;324:1029–1033. doi: 10.1126/science.1160809. [DOI] [PMC free article] [PubMed] [Google Scholar]
- Wang Z., Katsaros D., Shen Y., Fu Y., Canuto E.M., Benedetto C., Lu L., Chu W.M., Risch H.A., Yu H. Biological and Clinical Significance of MAD2L1 and BUB1, Genes Frequently Appearing in Expression Signatures for Breast Cancer Prognosis. PLOS ONE. 2015;10:e0136246. doi: 10.1371/journal.pone.0136246. [DOI] [PMC free article] [PubMed] [Google Scholar]
- Whitcomb D.C., Shelton C.A., Brand R.E. Genetics and Genetic Testing in Pancreatic Cancer. Gastroenterology. 2015;149:1252–1264.e4. doi: 10.1053/j.gastro.2015.07.057. [DOI] [PubMed] [Google Scholar]
- Wyant G.A., Abu-Remaileh M., Wolfson R.L., Chen W.W., Freinkman E., Danai L.V., Vander Heiden M.G., Sabatini D.M. mTORC1 Activator SLC38A9 Is Required to Efflux Essential Amino Acids from Lysosomes and Use Protein as a Nutrient. Cell. 2017;171:642–654.e2. doi: 10.1016/j.cell.2017.09.046. [DOI] [PMC free article] [PubMed] [Google Scholar]
- Yu G., Wang L.G., Han Y., He Q.Y. clusterProfiler: an R package for comparing biological themes among gene clusters. OMICS. 2012;16:284–287. doi: 10.1089/omi.2011.0118. [DOI] [PMC free article] [PubMed] [Google Scholar]
- Zhang Y., Proenca R., Maffei M., Barone M., Leopold L., Friedman J.M. Positional cloning of the mouse obese gene and its human homologue. Nature. 1994;372:425–432. doi: 10.1038/372425a0. [DOI] [PubMed] [Google Scholar]
- Zhang A.M.Y., Magrill J., de Winter T.J.J., Hu X., Skovsø S., Schaeffer D.F., Kopp J.L., Johnson J.D. Endogenous Hyperinsulinemia Contributes to Pancreatic Cancer Development. Cell Metab. 2019;30:403–404. doi: 10.1016/j.cmet.2019.07.003. [DOI] [PubMed] [Google Scholar]
Associated Data
This section collects any data citations, data availability statements, or supplementary materials included in this article.
Supplementary Materials
Data Availability Statement
Data and code availability are provided through Data Resource files on Mendeley Data (https://doi.org/10.17632/wcb2xsg6pj.3 https://data.mendeley.com/datasets/wcb2xsg6pj/3). Dietary composition data is available in Data Resource 1. Full R analysis script and processed data for age tumor onset and tumor growth comparisons, as well as cumulative incidence and mortality curves in mice are available in Data Resource 2. Full R analysis script for nutritional landscape modeling analysis and processed data are available in Data Resource 3. The normalized RNaseq data is given in Data Resource 4 and the original data is available at ArrayExpress as dataset E-MTAB-8227 (https://www.ebi.ac.uk/arrayexpress/experiments/E-MTAB-8227/). The full dataset of Liquid chromatography mass spectrometry is provided in Data Resource 5. Cox proportional hazards models for effect of dietary nutrients on pancreatic cancer susceptibility are available on Data Resource 6. Data characteristics and matrix of Pearson correlation coefficients are available in Data Resource 7.