Abstract
Two-photon microscopy is widely used to investigate brain function across multiple spatial scales. However, measurements of neural activity are compromised by brain movement in behaving animals. Brain motion-induced artefacts are typically corrected using post-hoc processing of 2D images, but this approach is slow and does not correct for axial movements. Moreover, the deleterious effects of brain movement on high speed imaging of small regions of interest and photostimulation cannot be corrected post-hoc. To address this problem, we combined random access 3D laser scanning using an acousto-optic lens and rapid closed-loop FPGA processing to track 3D brain movement and correct motion artifacts in real-time at up to 1 kHz. Our recordings from synapses, dendrites and large neuronal populations in behaving mice and zebrafish demonstrate real-time movement corrected 3D two-photon imaging with sub-micrometer precision.
Editor summary:
Real-time 3D movement correction by tracking a fluorescent bead in the field of view enables functional imaging with 3D two-photon random access microscopy in behaving mice and zebrafish.
Introduction
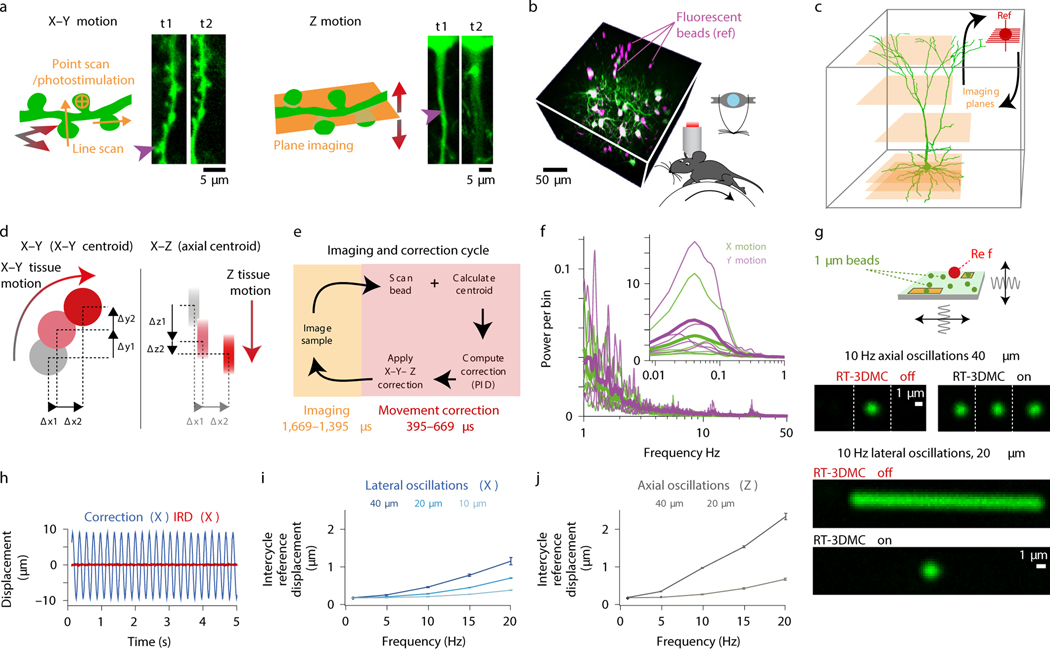
Two-photon microscopy is widely used for investigating circuit function because of its penetration depth in scattering tissue and high spatial resolution1,2. Recent improvements in laser scanning technologies have enabled signalling to be monitored in 3D at high temporal resolution3–12. However, brain movement remains a serious limitation when recording from awake animals. In mice, tissue displacements occur during limb movements, locomotion13,14 and licking15; and in zebrafish, brain movements during swimming are so large that some studies have estimated behaviour using “fictive” recordings in paralysed animals16. Even when animals are immobilised, movements due to heart-beat17 and breathing8,18 remain. Post-hoc image processing can correct movement artefacts in the 2D plane13,14,19, but cannot typically correct axial movements. Axial motion is particularly problematic for small structures such as dendrites and synapses, which can rapidly move in and out of the focal plane (Fig. 1a). Brain movement is also problematic for methods using point measurements or line scans to increase temporal resolution or perform photostimulation3–6,8,12,20–23, since these methods cannot be corrected post-hoc. Thus, brain movement limits both functional imaging and photostimulation methods for investigating circuit function.
Figure 1: Design and performance of the real-time 3D movement correction system.
a: Schematic of dendrite and fluorescence images at two timepoints (t1, t2) illustrating effect of lateral (left) and axial (right) brain motion. Purple arrows indicate lost features.
b: Z-stack of L2/3 cortical pyramidal cells (green) and 4 μm fluorescent beads (magenta) used to track brain motion (left) in head-fixed mice running on a treadmill (right).
c: Schematic illustration of interleaving functional imaging (orange planes) and monitoring of a reference object (red).
d: Schematic of reference object tracking using lateral (left) and axial (right) centroid analysis performed by the acquisition FPGA.
e: Time utilisation of the imaging cycle with RT-3DMC steps in light red and the functional imaging in orange for a 500 Hz update rate.
f: Power spectrum of X (green) and Y (purple) motion of motor cortex from head-fixed mice during locomotion (thick lines means, thin lines individual animals, n=5). Inset shows frequencies of < 1 Hz.
g: Top: Schematic of the oscillating stage with 1 μm imaged beads (green) and 5 μm reference bead (ref; red). Center: image of the bead without and with RT-3DMC at three timepoints while oscillating axially. Bottom: Maximum projection of a recording during oscillation in the Y direction, without and with RT-3DMC. Single example from 5 experiments.
h: Displacement of tracked 4-μm bead (blue) and the IRD (red) during lateral oscillations at 5 Hz for 20X objective (single example from n=4 experiments).
i: Relationship between mean IRD and oscillation frequency for different amplitudes of lateral sinusoidal displacements (n=4 beads, mean±SEM).
j: Same as i, for axial sinusoidal displacements.
To compensate for 3D brain movements during region-of-interest (ROI) imaging and photostimulation, real-time correction is required. Frame-by-frame motion correction algorithms that run during image acquisition have been developed24,25, but such 2D methods are too slow for real-time correction if there are intraframe distortions (requiring line-by-line13,14 or non-affine correction24). Galvanometer-based correction is available in some commercial software (e.g ScanImage, Vidrio Technologies), but this is relatively slow, as are motorised-stage18,26 and electrically tunable lens (ETL)15-based solutions for online axial correction, due to inertia and the slow feedback. Fast 3D tracking has been developed8,27, but motion corrected functional imaging was restricted to one or two cells at a time27. To address these limitations, we developed a high-speed closed-loop system that utilises the agility of acousto-optic lens (AOL) 3D Random Access Pointing and Scanning (3D-RAPS)4, 28, 29 and field programmable gate array (FPGA)-based parallel processing to track and correct for 3D tissue movements in real-time (Extended Data Fig. 1). We show that this real-time 3D movement correction (RT-3DMC) system can track brain movements at up to 1 kHz and correct imaging with sub-micrometer precision in behaving animals.
Results
Implementation of real time 3D movement corrected imaging
Our approach involves monitoring tissue movement by imaging a fluorescent reference object within the imaging volume of an AOL 3D laser scanner (up to 400×400×400 μm; Extended Data Fig. 2). We injected 4 μm red fluorescent beads into the tissue when implanting the cranial window (Fig. 1b), since they are bright, spherical and resistant to bleaching. We achieved tracking by periodically interrupting functional imaging with an ultra-high speed scan of the reference object, consisting of a small square XY image patch (typically 10–18 pixels per side) followed by 3 Z-scans through the vertical axis of the bead, using non-linear AOL drives29. Tracking of a reference object does not affect the imaging field of view (FOV), because the inertia-free AOL 3D scanner takes a fixed time (24.5 μs) to jump from the imaging location to the reference object, irrespective of the distance or depth between them (Fig. 1c). An FPGA on the image acquisition board rapidly calculated the 3D position of the reference object using a weighted centroid algorithm (Fig. 1d; Extended Data Fig. 1). We defined the Intercycle Reference Displacement (IRD) as the distance between the location of the reference object and its location on the previous cycle. The IRD was then fed to a Proportional-Integral-Derivative (PID) controller and added to the cumulative 3D displacement before being sent to a second FPGA board controlling the AOL 3D laser scanner (Extended Data Fig. 1). The AOL controller calculated the drives required to shift the FOV in concert with the 3D tissue movement. Imaging the reference object, together with tracking and correction of imaging drives, took 395–669 μs (Fig. 1e, Supplementary Note 1).
We quantified brain movement in head-fixed mice by imaging neocortex and cerebellum at >100 Hz. In motor cortex, locomotioninduced tissue movements of up to 0.32 μm/ms (mean maximum speed 0.14±0.1 μm/ms; mean±SD, n=5 mice) and displacements up to 5.7 μm (mean maximum 2.5±1.1 μm) with most movement occurring below 1 Hz (Fig. 1f). These properties were comparable in other brain regions (Extended Data Fig. 3), consistent with previous observations13,14 and well below the theoretical maximum tracking speed using a reasonable reference image size, dwell time, bead diameter and update rate (Supplementary Note 2). To test the RT-3DMC system, we imaged fluorescent beads (dispersed in agarose) mounted on a piezoelectric microscope stage driven with sinusoidal waveforms of different amplitude and frequency (Fig. 1g; Supplementary Videos 1-2). The IRD increased with the amplitude and frequency of movements, but remained below 1 μm for frequencies up to 20 Hz and peak-to-peak sinusoids up to 20 μm, for both lateral and axial motion (0.62±0.02 μm laterally and 0.73±0.06 μm, axially at 20 Hz, 20X objective, n=4 experiments; Fig. 1h,i,j). For a higher-resolution optical configuration with a 40X 0.8 NA objective, the IRD was even lower (Extended Data Fig. 4). Finally, we performed 3D random access point measurements (3D-RAP4, also known as 3D-RAMP5) from fluorescent beads since this imaging mode is particularly sensitive to movement (Extended Data Fig. 5). Our results confirm that RT-3DMC can track a 1 μm bead and keep a laser beam focused on it at speeds and displacements comparable to the maximum observed for brain tissue during locomotion.
Interleaving functional imaging with reference scans leads to a trade-off between the time used for tracking the reference object and functional imaging (Extended Data Fig. 2). By matching the size and resolution of the reference image to the speed and displacement of movements, we reduced the overhead of RT-3DMC to 17–30% of the total available imaging time for 500 Hz update rates. The RT-3DMC overhead reduced the maximal imaging rate of the AOL 3D scanner from 36 kHz to 25–30 kHz for 3D-RAP or line scan measurements, and from 39 Hz to 27–32 Hz for full frame (512×512 voxels) imaging. RT-3DMC ran continuously during experiments, either interleaved with imaging, or in the background between imaging sessions.
Performance of movement-corrected imaging in behaving mice
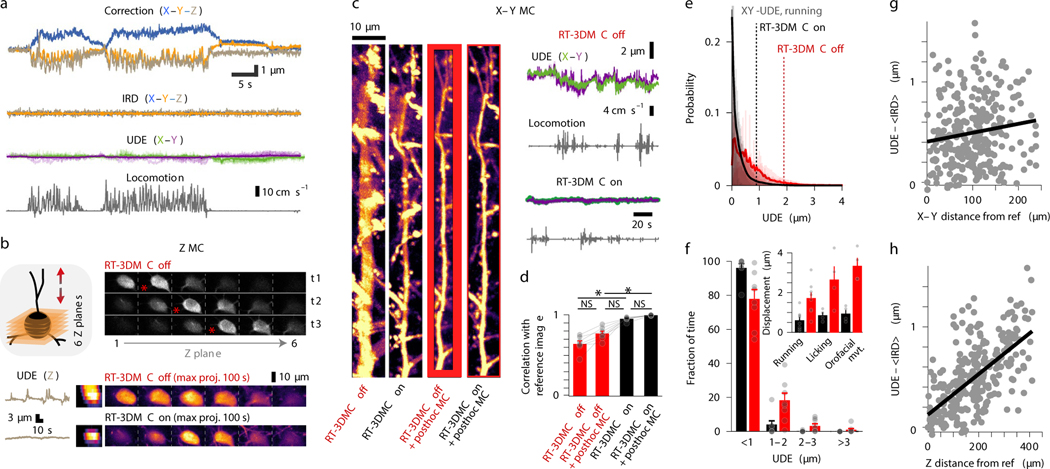
To test RT-3DMC in vivo, we imaged layer 2/3 pyramidal cells sparsely expressing GCaMP6f30 and tdTomato in motor cortex in head-fixed mice on a treadmill. Real-time tracking of beads in the tissue revealed locomotion-induced movements, comparable with our measurements from somata (Fig. 2a). We determined the effectiveness of RT-3DMC by quantifying the residual movement present in images, which we refer to as uncorrected displacement error (UDE), using 2D post-hoc registration19. We used tdTomato fluorescence to quantify movements in the absence of activity-dependent signals. With RT-3DMC switched off, the UDE corresponds to the total displacement of the brain in X and Y. With RT-3DMC switched on, the mean UDE was maintained below 0.5 μm (Fig. 2a). To examine axial motion, we performed volumetric imaging of a pyramidal cell soma. Without RT-3DMC, the midpoint of the soma moved between planes over time (Fig. 2b). When RT-3DMC was on, the midpoint of the soma remained within the same focal plane, and the residual movement was substantially reduced (Fig. 2b; Supplementary Video 3). Indeed, 88% of timepoints had a Z motion error of < 1 μm with RT-3DMC compared to 59% with RT-3DMC off (Extended Data Fig. 6), and the error remained below 1 μm for 95% of timepoints for RT-3DMC with a 40X objective. RT-3DMC was also effective over much larger displacements in X, Y and Z (±74 μm; Supplementary Video 4).
Figure 2: Monitoring and compensating for brain movement in behaving mice.
a: Top: Example of displacement estimated by tracking a bead in motor cortex during locomotion (X, blue; Y orange, Z, brown). Center: IRD after RT-3DMC and X and Y UDE (green and purple) from 9 patches across the imaging volume. Bottom: locomotion speed (grey).
b: Example of volumetric imaging (schematic left) of a tdTomato-expressing soma during locomotion for 6 XY planes at 3 time points (t1, t2, t3; one of 11 experiments). Cell center corresponds to the brightest image (red star). Bottom: UDE for axial motion (grey) without and with RT-3DMC and corresponding maximum intensity projections (MIPs) in the XZ (left) and XY planes (right) during a 100 s recording. Z motion reduced from 4.4 μm to 0.88 μm.
c: Example of MIPs of a pyramidal cell dendrite over 140 s during locomotion, with RT-3DMC off, RT-3DMC on, after post-hoc correction with RT-3DMC off and after post-hoc correction with RT-3DMC on (left to right; one of 7 experiments). Red region cannot be corrected post hoc due to out-of-frame movement. Right panel uncorrected X (green) and Y (purple) UDE for RT-3DMC off (top) and on (bottom).
d: Bar chart of the image correlation with the sharpest image (RT-3DMC on + post-hoc MC) for RT-3DMC off, RT-3DMC off with post-hoc MC and RT-3DMC (n=7 experiments, 58 patches, 5 mice, mean±SEM, points show values per experiment). Multiple comparison (Friedman test) indicates improved sharpness between RT-3DMC off vs RT-3DMC on (*p=0.023), and no further improvement between RT-3DMC on and RT-3DMC on + post-hoc (p=0.884).
e: Distribution of UDE values with RT-3DMC on (black) or off (red) and mean (thick lines) during locomotion (n=20 experiments, 8 mice). Dotted lines show distance below which 95% of the values are located.
f: Similar to e but grouped into 1 μm bins to quantify large infrequent movements. Inset shows the distance below which 95% of UDEs fall for different behaviours with (black) and without (red) RT-3DMC (p = 1 × 10⁻⁴, Friedman test; running, n=8 mice; licking, n=4 mice; perioral movement n=4 mice, mean±SEM, points show individual values).
g: Difference between UDE and time-averaged IRD as a function of XY distance from the reference bead during running. Regression line (black; slope = 0.09 μm per 100 μm from the reference; R2 = 0.02, n=305 patches, n=20 experiments, 8 mice).
h: As for g but showing the axial (Z) distance from the reference bead. Regression line (black; slope = 0.21 μm per 100 μm, R2 = 0.43).
To examine the effectiveness of RT-3DMC for selective imaging of smaller structures we compared time-averaged images of a section of dendrite. In contrast to when RT-3DMC is switched off, images acquired with RT-3DMC switched on are crisp with spines visible along the dendritic shaft (Fig. 2c, Supplementary Video 5). To quantify the image quality, we compared images with the best-case scenario (RT-3DMC on + post-hoc MC) using cross-correlation. We observed a mean correlation coefficient of 0.64±0.1 for RT-3DMC off, 0.77±0.08 for RT-3DMC off + post-hoc MC and 0.96±0.02 for RT-3DMC on. While post-hoc correction produced an image of comparable sharpness (Fig. 2d), tissue movement resulted in a much smaller usable area than for RT-3DMC, which maintained the structures within the imaged ROI (Fig. 2c). RT-3DMC is therefore key for high-speed selective imaging of small structures in head-fixed mice.
Monitoring the trajectory of an object and dynamically altering the imaging frame of reference to compensate for movement assumes that tissue movements consist of rigid translations. To assay the effectiveness of RT-3DMC over the imaging volume we calculated the UDE in ROIs during locomotion. Without RT-3DMC the average error was > 1 μm for 32±16% of timepoints, but this percentage dropped to < 5% when RT-3DMC was on (Fig. 2e,f), indicating the vast majority of ROIs had little residual error (88±16% of the timepoints were < 0.5 μm error). To investigate how non-rigid brain movement contributed to the UDE we subtracted the time-averaged IRD (<IRD>) as this approach removed uncorrected movement measured at the bead. Plotting UDE-<IRD> as a function of distance in the XY plane revealed little spatial dependence (Fig. 2g). However, uncorrected error moderately increased with Z-distance from the bead (Fig. 2h). These results suggest that non-rigid tissue motion increases with depth, but is sufficiently small to enable submicrometer RT-3DMC over the imaging volume. Comparison of Z-stacks with and without RT-3DMC illustrate the correction’s effectiveness throughout the imaging volume (Supplementary Video 6).
We next investigated how depth and brightness of the tracked object affected RT-3DMC performance. Submicrometer correction was maintained for beads up to 450 μm deep (maximum depth investigated; Extended Data Fig. 7). We also examined whether cell bodies could be used as reference objects. Although the RT-3DMC system could track somata, tracking was less effective than for beads, even when their fluorescence was comparable (mean UDE: 0.44±0.11 μm for beads, 0.66±0.44 μm for tdTomato soma and 0.70±0.31 μm for GCaMP6f soma: Extended Data Fig. 7). Nevertheless, these results show that cell bodies can also be used as reference.
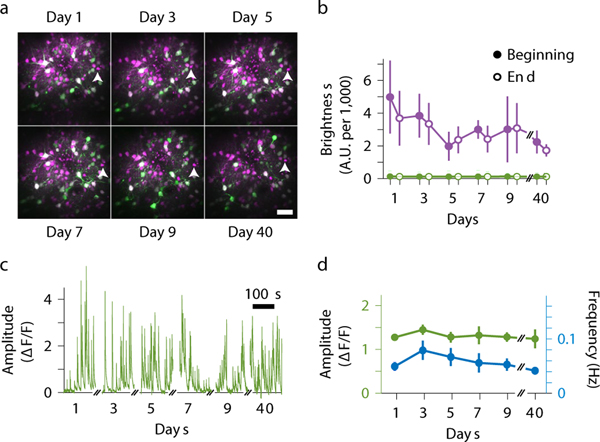
To determine the impact of RT-3DMC on the health and stability of tissue during functional Ca2+ imaging we performed longitudinal recordings from L2/3 pyramidal cells by imaging multiple times from the same volume, using the same bead as the reference (Fig. 3a). The fluorescence of the bead remained more than 20-fold brighter than the background fluorescence over 5 imaging sessions over 9 days, plus 1 session at day 40, despite each imaging session lasting 1–2 hours with RT-3DMC continuously locked onto the bead (Fig. 3b). Baseline GCaMP6f fluorescence of identified pyramidal cells and the amplitude and frequency of their somatic activity remained stable (Fig. 3c,d), suggesting that the cells remained healthy. These results demonstrate that RT-3DMC is compatible with repeated functional imaging of the same neuronal structures.
Figure 3: Longitudinal imaging using real-time 3D movement correction.
a: Example of maximum intensity projections of Z stacks from the motor cortex expressing GCaMP6f (green) and tdTomato (magenta) after > 1 hour imaging sessions of the same region every other day for 9 days (4 mice) and a month later (3 mice). The white arrowhead indicates the same reference bead chosen for RT-3DMC over time for each mouse.
b: Mean fluorescence of red reference beads used for RT-3DMC (magenta) and surrounding neuropil fluorescence (green) at the beginning (filled points) and end (unfilled points) of the experiment (n=4 animals for days 1–9, n=3 for day 40, Values indicate mean±SEM).
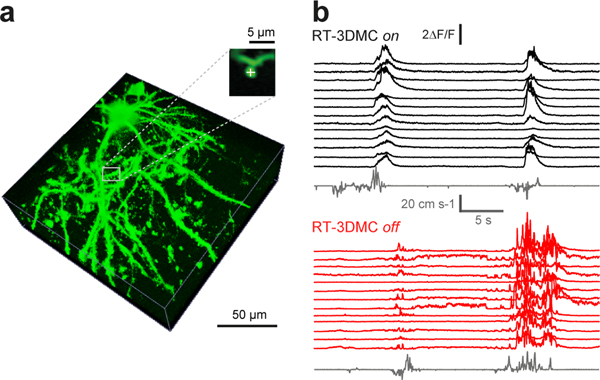
c: Example calcium transients from the same pyramidal cell somata expressing GCaMP6f, with RT-3DMC on (1 of 28 cells).
d: Mean amplitude (green) and mean frequency (blue) of GCaMP6f fluorescence transients in the 28 identified neurons imaged during the longitudinal study for RT-3DMC on (Mean ΔF/F amplitude p=0.5, frequency, p=0.12, n=28 cells). Values indicate mean±SEM.
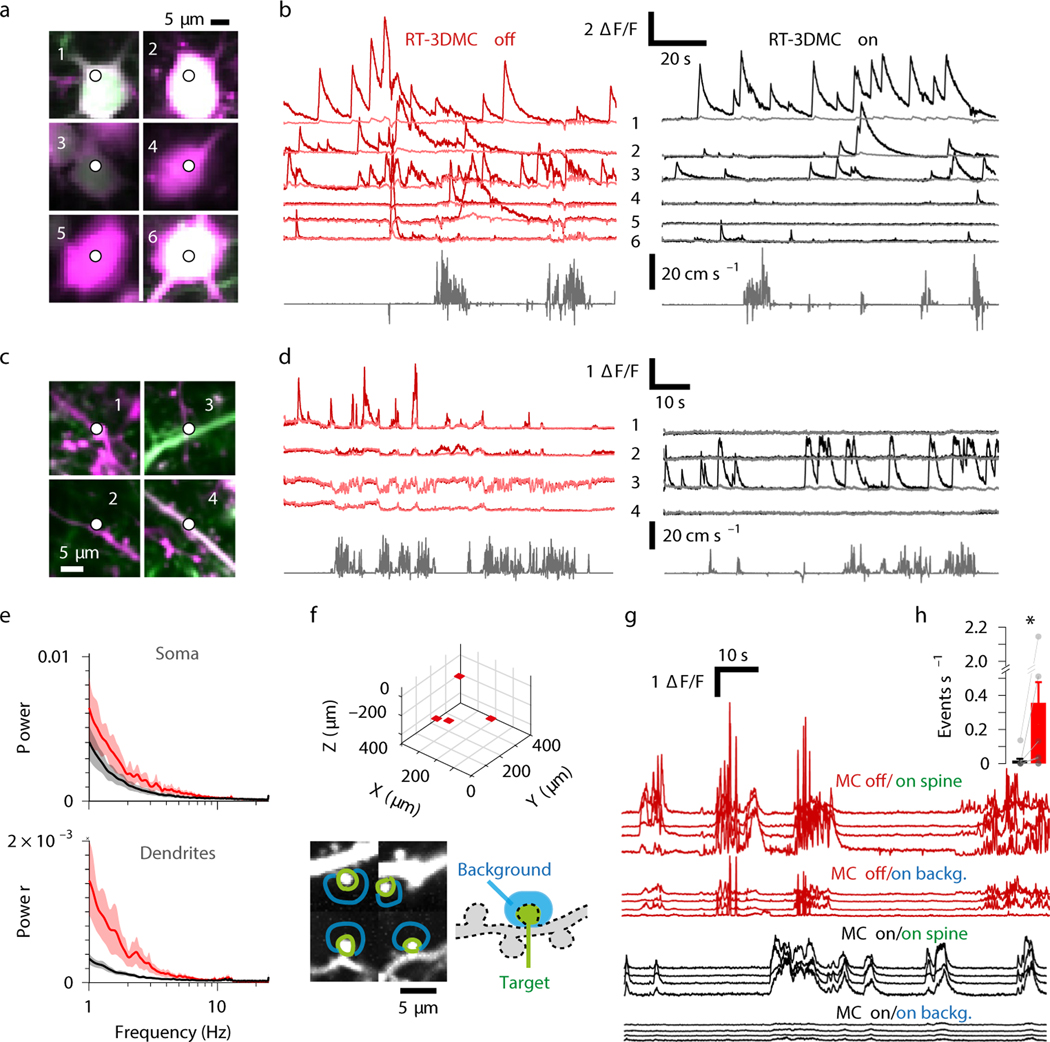
To test RT-3DMC at higher acquisition rates we performed 3D-RAP. With RT-3DMC switched off, somatic 3D-RAP measurements of the activity-independent tdTomato fluorescence revealed fluctuations during locomotion bouts, which were largely absent with RT-3DMC switched on (Fig. 4a,b). However, the large amplitude of the activity-dependent GCaMP6f signals and the large size of pyramidal cell somata, resulted in movement artifacts being relatively small, so only a modest improvement in the functional signals was observed when brain movements were compensated for with RT-3DMC (Fig. 4b). Locomotion-induced fluctuations were more problematic for dendrites, but these artefacts disappeared with RT-3DMC switched on (Fig. 4c,d). The difference in movement-induced fluctuations was evident in the power spectra (Fig. 4e) and coefficient of variation (CV) of the tdTomato fluorescence with RT-3DMC switched on or off in both somatic (39% reduction of CV, p = 9 × 10⁻¹⁴, Wilcoxon test) and dendritic (31% reduction, p = 2.6 × 10⁻⁹, Wilcoxon test) 3D-RAP recordings (32 structures, 4 animals). Overall, the maximal fluctuations in tdTomato fluorescence were reduced from 0.8±0.48 ΔF/F to 0.39±0.23 with RT-3DMC switched on (p = 1.5 × 10⁻⁶, Wilcoxon test, n=4 animals). These results show that RT-3DMC is essential for using 3D-RAP in behaving animals in all but the largest neuronal compartments with the brightest indicators.
Figure 4: High-speed recordings of somatic, dendritic and spine activity during locomotion.
a: Location of 3D random access point measurements (3D-RAP) on six selected pyramidal cell somata expressing GCaMP6f (green) and tdTomato (magenta) in the motor cortex.
b: Example of 3D-RAP measurements of GCaMP6f activity from the somas in panel a, with RT-3DMC off (left/red) and on (right/black). The 6 pale-red (MC off) and grey traces (MC on) show ΔF/F for activity-independent tdTomato. Bottom traces show the running speed (one of 4 mice).
c: As for a but for 4 selected dendrites, imaged with a 40X objective.
d: Same as b but for the 4 dendrites in panel c (one of 4 mice).
e: Mean power spectrum of tdTomato fluorescence intensity from soma (top) and dendrites (bottom) during running bouts with RT-3DMC off (red) and on (black) (n=4 animals, 32 structures). Shaded area indicates SEM.
f: Imaging volume with 3D location (top) of 4 imaged ROIs with dendritic spines (red patches) on a layer 2/3 pyramidal cell expressing GCaMP6f in motor cortex. Bottom: Imaged patches with regions on (green) and adjacent to (blue) the spines from which functional signals were extracted.
g: Example of ΔF/F traces from green and blue regions in panel f when RT-3DMC was off (top, red) or on (below, black; one of 8 animals).
h: Average rate ±SEM of false positive events (peak > 2X background in the dark background area) during locomotion with RT-3DMC on (black; 0.01±0.06 events s−1) or off (red; 0.36±0.13 events s−1), (*) p=0.04, Wilcoxon test, n=8 animals, points show individual values.
To examine the effectiveness of RT-3DMC for imaging structures close to the optical resolution limit, we imaged regions located on and adjacent to spines (Fig. 4f). In contrast to when RT-3DMC is switched off, images obtained with RT-3DMC exhibited activity localised to spine heads with almost no activity spilling into adjacent pixels (Fig. 4g,h). To test whether RT-3DMC was sufficiently accurate to perform 3D-RAP spine measurements, we focused the laser beam onto a single point on a spine. Without RT-3DMC the fluorescence transient was jagged, particularly when the animal was moving (Extended Data Fig. 8), due to the spine moving in relation to the imaging point (Supplementary Video 7). Our results show that RT-3DMC can track and compensate for brain movements with high precision, enabling high-speed 3D-RAP measurements from synapses and dendrites in awake behaving mice.
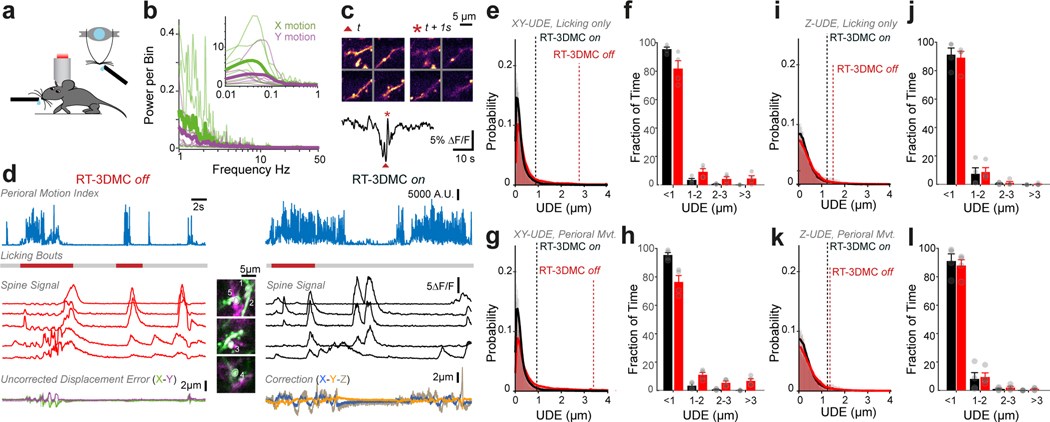
To test RT-3DMC during other types of behaviour, we examined licking, which induces large brain movements15. Licking from a water dispenser generated movements comparable to those during locomotion with speeds of up to 0.54 μm/ms (mean maximum speed 0.2±0.1 μm/ms) and displacements up to 8.2 μm (mean maximum displacement 3.1±2.0 μm for n=6 mice), but more transient in nature. Fast biphasic transients in the GCaMP6f fluorescence from dendrites occurred during licking and perioral movement, but these disappeared when RT-3DMC was on (Fig. 2f, Extended Data Fig. 9). Analysis of the UDE showed that RT-3DMC was effective at correcting movements induced by licking and perioral movement, suggesting that RT-3DMC is suitable for a range of head-fixed behaviours in mice.
Performance of movement corrected imaging in behaving zebrafish
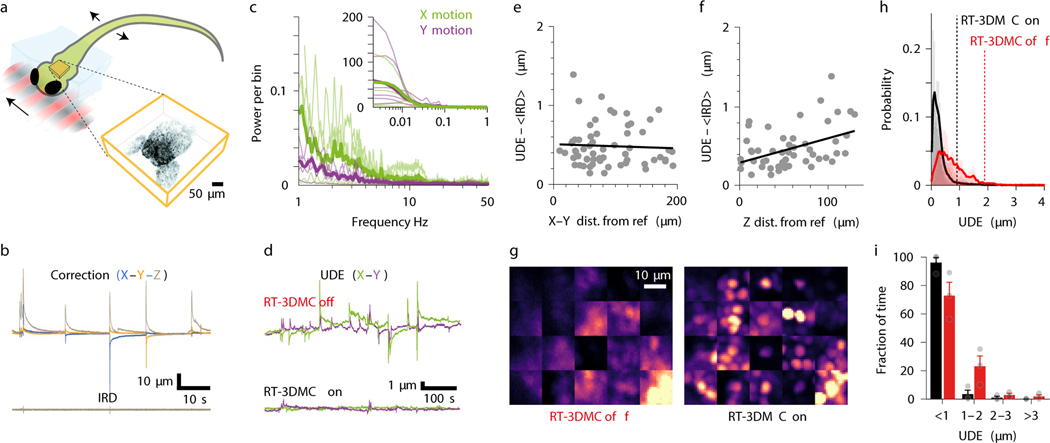
To investigate whether RT-3DMC generalises to other model systems we imaged tethered zebrafish presented with visual stimuli (Fig. 5a). Larval zebrafish expressing nuclear-localised GCaMP6s30 were partially embedded in agarose such that their eyes and tail could move freely. Tracking of injected beads revealed speeds up to 7.2 μm/ms (mean maximum 3.6±2.3 μm/ms) and displacements up to 32.8 μm (mean maximum 20.8±7.5 μm, n=5 fish; Fig. 5b) substantially larger than observed in head-fixed mice, but within the maximum speed that can be corrected with RT-3DMC (Supplementary Note 2). These displacements included abrupt fast and large movements associated with powerful tail movements and slow offsets that relaxed over tens of seconds. The distribution of these lower frequency components was comparable to those in mice (Fig. 5c). After increasing the update rate to 1 kHz (Extended Data Fig. 2), RT-3DMC could track and correct the motion, with the IRD exceeding 1 μm only during the fastest, largest movements (Fig. 5b,d). The dependence of the uncorrected error on distance from the reference bead was weak in X-Y and had a steeper depth dependence than for mice, but remained <1 μm to depths of 225 μm during swim bouts (Fig. 5e,f). To quantify the performance of RT-3DMC over time we took Z-stacks (350×350×175 μm) capturing a large portion of the zebrafish forebrain and selected twenty 15-μm square ROIs (Fig. 5g, Supplementary Video 8). Analysis of movement in multiple fish revealed displacements of > 1 μm for 27% of timepoints during swimming bouts with RT-3DMC switched off, but these displacements dropped to < 4.5% when RT-3DMC was on (Fig. 5h,i).
Figure 5: Monitoring and compensating for brain movement in partially tethered larval zebrafish.
a: Cartoon of zebrafish larva with the rostral body section embedded in agarose (light blue). Inset shows a RT-3DMC Z-stack image of the forebrain expressing nuclear-localized GCaMP6s within the imaging volume.
b: Example of displacement of brain during swimming bouts triggered by the moving gratings measured by tracking a bead (X, blue; Y orange; Z, brown). Bottom trace shows Intercycle Reference Displacement (IRD) in X, Y and Z with RT-3DMC on (one of 3 zebrafish).
c: Power spectrum analysis of X (green) and Y (purple) brain motion during an experiment with bouts of swimming. Individual animals (thin lines), average from 5 zebrafish (thick lines). Inset shows spectra for frequencies < 1 Hz.
d: Mean UDE from 20 patches in X and Y directions (purple) with RT-3DMC off (top) and on (bottom).
e: Difference between UDE and time-averaged IRD as a function of XY distance from the reference bead. Solid line indicates linear fit (0.03 μm per 100 μm, R2 = 0.00, n=60 patches, 3 zebrafish).
f: Same as e but axially. Slope of fit 0.31 μm per 100 μm, R2 = 0.18.
g: Time-averaged images of neurons distributed throughout the forebrain in twenty imaging patches during swimming bouts without (left) and with (right) RT-3DMC (n=1 fish).
h: Distribution of UDEs with RT-3DMC on (black) or off (red) and mean residual movement (thick lines, n=3 fish). Dotted lines indicate the distance below which 95% of the values are located.
i: Similar to h but grouped into 1 μm bins to quantify large infrequent movements. With RT-3DMC, 95.5% of timepoints had a residual error of < 1 μm, compared to 72.4% without RT-3DMC (mean±SEM, points show individual values).
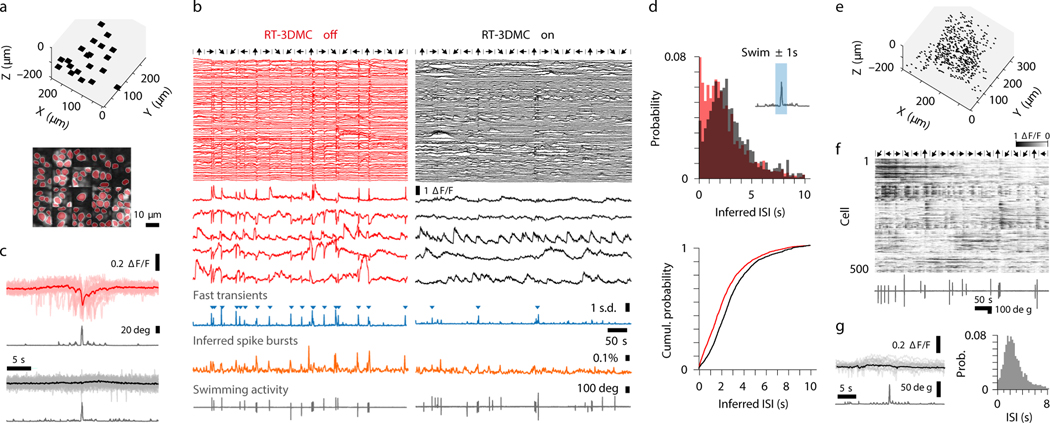
To examine the effectiveness of RT-3DMC for functional imaging in fish we recorded populations of neurons in the forebrain (Fig. 6a). When RT-3DMC was switched off, swimming bouts were associated with fast, positive and negative transients in the GCaMP6s fluorescence (Fig. 6b,c). In contrast, when RT-3DMC was switched on, fluorescence transients were largely positive and had slower, smoother decays as expected for Ca2+ transients. Indeed, locomotion-triggered averaging across the neuronal population revealed fast transient events, which were rare when RT-3DMC was on (Fig. 6c). To assess the potential impact of these motion artefacts we used a maximum likelihood algorithm to infer spikes from GCaMP6s traces. Bursts of inferred spikes were observed more often during swimming with RT-3DMC off (Kolmogorov-Smirnov test p=1 × 10−81, Fig. 6b,d), due to large fast positive and negative going fluorescence transients (Fig. 6b,c). Complete loss of the ROI during swim bouts (Supplementary Video 8) in some preparations made it difficult to further quantify the impact of movement on activity in the absence of RT-3DMC. Nevertheless, these results show that the occurrence of movement-induced artefacts is substantially reduced by RT-3DMC.
Figure 6: Functional imaging in behaving zebrafish larvae.
a: Location of 20 imaging patches distributed within the volume (top), image of 90 neurons monitored for functional imaging (bottom).
b: Nuclear-localised GCaMP6s activity extracted from patches of cells in panel a without (left, red) and with RT-3DMC (right, black), with 5 enlarged examples below. Direction of moving gratings for 10 s every 30 s indicated by black arrows. Averaged fast transient (blue traces, triangles indicate transients > 1 sd) without and with RT-3DMC and averaged inferred spike bursts (orange traces, probability of having an inter-spike interval < 2s). Bottom: tail motion (grey traces).
c: Average ΔF/F response aligned to swim bouts, for neurons in b without (pale red, individual means; dark red, overall average) and with RT-3DMC (gray, individual means; black, overall average), together with averaged absolute value of tail angle (grey) below each.
d: Top: Distribution of inter-spike Intervals from inferred spike trains with (black) and without (red) RT-3DMC, for spikes occurring ±1s around swimming bouts (inset, light blue region). Interval was computed between the detected spike and the preceding one. Bottom: cumulative probability of the ISIs with RT-3DMC off (red) or on (black) for all neurons (n=3 fish).
e: Location of 500-point measurements from neurons expressing nuclear-localised GCaMP6s distributed across the forebrain (n= 1 fish).
f: GCaMP6s fluorescence traces for 500 neurons using 3D-RAP and RT-3DMC together with tail motion (grey traces, bottom) for 10 minutes. Black arrows indicate direction of visual grating. Neurons were sorted for visualisation purpose using the unsupervised GenLouvain clustering method.
g: Left: Same as c, but for 3D-RAP measurements, same animal as in c. Right: Same as d, but for 3D-RAP with RT-3DMC on, swim±1s.
For the strongest swimming bouts, tracking was occasionally lost even with RT-3DMC. We developed a tracking recovery mechanism that rapidly located the bead position when the bead came back into the last reference frame FOV (typically < 50 ms). This enabled nearly continuous (estimated 99.97% of time) RT-3DMC recordings over hours and minimised movement artefacts, which were negligible after light low-pass filtering (Fig. 6b). RT-3DMC allowed us to make prolonged somatic 3D-RAP measurements from a large population of neurons distributed in 3D from the forebrain during swimming (22 Hz; Figure 6e,f and Supplementary Video 9). As with patch recordings, no systematic fast transient events were observed with 3D-RAP during swimming bouts (Fig. 6f,g), confirming the effectiveness of RT-3DMC.
Discussion
Our RT-3DMC design, combining an AOL and FPGA processing, is an order of magnitude faster than previous approaches15,18,26, enabling precise, movement-stabilised 3D two-photon imaging in behaving mice and zebrafish. It complements the use of motorised 3D stages for imaging freely moving zebrafish larvae31 and C. elegans32,33 over large spatial scales by enabling faster 3D tissue movements to be corrected with submicrometer precision.
Compensating for movement in real-time removes the need for 2D post-hoc movement correction prior to analysis. Moreover, without RT-3DMC, post-hoc correction of axial shifts7 requires multiplane scanning to keep track of ROIs, but using volumetric imaging would be approximately 10-fold slower in mice and 100-fold slower in zebrafish (Extended Data Fig. 10). RT-3DMC can therefore improve temporal resolution of functional imaging in the presence of 3D tissue movement.
RT-3DMC can be incorporated into conventional two-photon microscopes by fixing their galvanometer mirrors and adding an AOL 3D laser scanner and open-source custom software (Supplementary Note 3). This enables high-speed, 3D selective imaging of ROIs in behaving animals. Such 3D ROI imaging can be used to image large numbers of neurons, dendrites, axons and synapses3,4,7,12, but without RT-3DMC, tissue motion artefacts are a constant challenge. Maximising imaging speed by selectively imaging ROIs is likely to become more widespread as faster genetically encoded neurotransmitter and calcium indicators and voltage probes are developed34–37. RT-3DMC will ensure that such high-speed multiscale imaging of neural circuits is reliable during behaviour.
In addition to imaging neuronal activity, applications for RT-3DMC include two-photon uncaging of neurotransmitters38 and spatial light modulator (SLM)-based 3D two-photon optogenetic methods20–23, 39 in behaving animals. Moreover, RT-3DMC’s high speed makes the technology well suited for closed-loop optogenetic photostimulation40 as RT-3DMC corrects for inter-frame motion without incurring any host processing overhead. Adding RT-3DMC to these dual path methods would require an AOL 3D scanner in the imaging path that fed back the X, Y, Z movement to the galvanometer mirrors and SLM in the 3D photostimulation path. A dual path solution for RT-3DMC imaging would also be advantageous for voltage imaging, since it would enable kilohertz update rates without compromising the maximum imaging rate. Tracking tissue movement could also be used to drive micromanipulators to stabilise in vivo whole-cell patch-clamp recordings during behavioural tasks, correct for slow tissue drift in acute brain slices, and move a 3D motorised stage to track movement of small animals over distances beyond the imaging volume27,31–33. RT-3DMC is also likely to have applications beyond neuroscience, in fields such as cardiac physiology, where movement is an intrinsic property of the system.
Online Methods
Microscope and real-time 3D movement correction system
The Acousto-Optic Lens (AOL) 3D two-photon microscope layout and real-time movement correction system is shown in Extended Data Figure 1. Briefly, an 80 MHz pulsed Ti:Sapphire laser (Chameleon, Coherent, CA, USA) tuned to a wavelength of 920 nm was routed to the compact configuration AOL28 via a custom designed prism-based pre-chirper (APE GmbH, Berlin), a Pockels cell (Model 302CE, Conoptics) and a custom made beam expander that increased the beam diameter to fill the 15 mm aperture of the AOL. The AOL consisted of two orthogonally arranged pairs of on-axis TeO2 Acousto-optic deflectors (AODs Gooch and Housego) interleaved with quarter wave plates and polarisers to couple them together4,28. The AOL was controlled from an FPGA control board (Xilinx VC707) which had a custom designed, on-chip digital waveform synthesiser that generated radio frequency (RF) signals, which were passed to four digital-to-analog converters (DACs) at 275 MS s−1 (Two Texas Instruments DAC5672) and then amplified (PA-4 from InterAction Corp).
Relay optics coupling the AOL to a customised SliceScope microscope (Scientifica, UK) were arranged to under-fill a 20X water immersion objective (Olympus XLUMPlanFLN, NA 1.0), giving an NA of ~0.6 on the illumination path, or overfill a 40X objective (Olympus LUMPlanFLN, NA 0.8). These objectives gave two-photon point spread functions with full width half maxima 0.69±0.04 μm (mean±SD) in XY and 6.54±0.27 μm in Z, and 0.58±0.03 μm in XY and 4.3±0.39 μm in Z, respectively, for 0.1 μm beads. Red and green channels were detected with GaAsP photomultiplier tubes (PMTs) (H7422, Hamamatsu, Japan) and digitised using high-speed 800 MSPS ADCs (NI-5772, National Instruments) via 200 MHz Pre-Amplifiers (Series DHPCA 100/200 MHz, FEMTO) and downsampled with a digital acquisition FPGA board (NI FlexRIO – 7966R, National Instruments) before sending frames to the host PC via the National Instruments PXIe interface.
Custom 3D microscope interfaces written in MATLAB and LabVIEW environments and implemented on the host PC, were used to control the microscope and define imaging modes for Z stack acquisition, line scan and point-based functional imaging and motion correction. Imaging speed depends on the time required for the acoustic wave to propagate across the AOL aperture (fill time = 24.5 μs) and the dwell time per voxel (50 ns-13 μs). The fill time determines the time to jump from one location in the imaging volume to any other location and is required for each line scan or point measurement. Thus without Real-time 3D motion correction (RT-3DMC) the fastest frame time for imaging 512 line scans of 512 voxels each is 512x(24.5 + 512×0.05) = 25,651 μs or 39 Hz. Lower resolution images of the same FOV, or smaller FOVs, can be acquired much more rapidly (e.g. 256×256 voxels at 104 Hz) and point measurements can be performed at up to 40 kHz (i.e. 1/(24.5 + 0.5) = 0.04 MHz).
RT-3DMC was achieved by periodically scanning a bead or soma located within the imaging volume, tracking its motion and adjusting the AOL 3D laser scanner to compensate for the motion (Fig. 1c). The acquisition FPGA contained a programmable timer that determined the feedback period for motion correction (typically, every 1–2 ms) and synchronised the AOL controller to correctly interleave reference scans with the main imaging sequence (Extended Data Fig. 1). The RT-3DMC logic first scans a lateral XY reference image, calculates the XY offset and corrects the XY FOV prior to performing the Z-line scans. Pipelining this process per pixel reduced the time to perform the lateral update to 50–60 μs. Having centered the reference feature, Z line scans were performed to determine the axial position of the bead. The RT-3DMC logic contains a PID controller to optimise the current offset estimate (Δx, Δy, Δz) which are sent to the AOL controller via a serial link running the Serial Peripheral Interface (SPI) protocol. The SPI interface used a 16 bit field (±7 bits integer and 8 bits fractional), limiting the maximum tracking to ±128 reference pixels.
The control FPGA converts the pixel offset to the acoustic frequency drives needed to track the brain motion in 3D, including compensating for any optical field distortions (Supplementary Note 4). On-chip DSP blocks on the Xilinx Virtex 7 were used to calculate the movement corrected RF drive waveforms for each of the four AODs in parallel by executing fixed point-arithmetic operations at 125 MHz. Pre-fetching and calculating the four frequency offsets took <1 μs enabling the data acquisition board to be updated within the AOL fill time. Once initiated, RT-3DMC maintained the selected frame of reference by performing RT-3DMC continuously until disabled.
Performance tests
To test the RT-3DMC performance we tracked and imaged fluorescent beads (Phosphorex) embedded in an agarose and mounted on a piezoelectric stage that was driven sinusoidally in either X, Y or Z directions (10–40 μm peak-to-peak at 1–20 Hz). An isolated 4 μm bead was selected as a reference object and imaged every 2 ms using an 18×18 pixel XY imaging patch and 3 axial scans. The Intercycle Reference Displacement (IRD) was calculated online by the FPGA. The total displacement from the original reference frame was calculated from the cumulative offset in X, Y and Z. The uncorrected displacement error (UDE), which provided an independent measure of the frame-by-frame displacement in XY, was calculated by performing a post-hoc subpixel 2D motion correction19. When performed on images acquired with RT-3DMC on, it gives the residual 2D error after RT-3DMC correction. With RT-3DMC off, the XY-UDE gives the total displacement of the tissue in X and Y. Since Z-UDE could not be extracted from imaging patches we imaged 25×25×60 μm volumes around tdTomato-expressing soma with and without RT-3DMC, and calculated the axial displacement from the movement of cell bodies.
In vivo imaging in awake behaving mice
All experimental procedures were approved by the UCL Animal Welfare Ethical Review Body and the UK Home Office under the Animal (Scientific Procedures) Act 1986. Stereotaxic injections were performed under sterile aseptic conditions in the left primary motor cortex (0.5 mm anterior to Bregma, 1.5 mm lateral to midline) or the right primary visual cortex (0.5 mm anterior to Lambda, 2.5 mm lateral to midline) of adult C57BL/6J mice (male and female), or in homozygous Ai9 cre-reporter transgenic mice (B6;129S6-Gt(ROSA)26Sortm9(CAG-tdTomato)Hze/J) for tdTomato30 expression. Sparse labelling was achieved by co-injecting Cre recombinase (AAV9.CamKII0.4.Cre.SV40, diluted 1:10,000 and 1:20,000, UPenn Vector Core) with Flex-GCaMP6f (AAV1.Syn.Flex.GCaMP6f.WPRE.SV40, diluted 1:2, UPenn Vector Core). For characterisation of motion in the cerebellar cortex, we monitored GFP-expressing neurons in homozygous GAD65-GFP and heterozygous mGluR2-Cre-IRES-eGFP (B6;FVB-Tg(Grm2-cre,-EGFP)631Lfr/Mmuc) mouse lines.
A custom head plate was attached to the skull using acrylic dental cement and a 4 mm craniotomy was then formed and sealed with a glass coverslip and fixed with cyanoacrylate glue. In some animals the head plate was attached at the time of viral injection while in others it was added 2–5 weeks later. In the former, anaesthesia was induced by fentanyl-midozolam-medetomidine (sleep mix). For the latter, ketamine-xylazine anaesthesia was used during the initial viral injections and the sleep mix was used when attaching the head plate. Red fluorescent beads (4 μm FluoSpheres, ThermoFisher), suspended in artificial cerebrospinal fluid at a dilution of 1:20 were injected into the superficial layers of the brain (~200 nl over ~1 min) when the imaging window was formed or at the time of viral injection. This resulted in a density of beads in the tissue that usually ensured at least one bead was present in the imaging volume and that the chosen bead was well isolated from any others (i.e. >2x reference image frame size away).
The experimental imaging procedure was as follows: RT-3DMC was set up by selecting a reference object for tracking, and an initial RT-3DMC Z-stack was acquired, from which the imaged structures (plane, subvolume, patches or points) were selected. All recordings with RT-3DMC were then done with this frame of reference. Following the RT-3DMC on sessions, the stage was manually realigned for the RT-3DMC off session to compensate for slow drift that had developed (RT-3DMC compensates for drift by adjusting the scans, without any stage movement). This allowed us to compare the same ROI across RT-3DMC on and off sessions.
All mice were familiarised with the experimental setup and monitored to ensure they exhibited no signs of distress. During recordings, mice were free to stand or run on a cylindrical Styrofoam wheel. Locomotion was monitored with a rotary encoder and for experiments investigating brain movement during licking, a metal lick spout water dispenser was placed in front of the mouth. The water was enriched with 0.5 M sucrose. Running, licking and perioral motion were monitored with a video camera tracking at 50 Hz. The occurrence of perioral movement bouts were detected using a motion index (Motion Index = sum of the intensity difference between consecutive pixels values within the ROI) assay using ROIs drawn around the perioral region and among these, clear licking bouts were identified by visual inspection.
For the longitudinal study we selected a 300×300×300–450 μm imaging volume in the motor cortex of each mouse. To precisely align the volume in XY we located a cell from the reference Z-stack taken on day 1, noted its pixel location, and moved the stage until it was precisely centred in the FOV. To align the volume in Z, we ensured the same bead used for tracking was 30 μm below the top of the Z-stack. We used the same PMT gain settings on the red and green channels, as well as laser power intensity per animal. To quantify changes in bead and tissue fluorescence, we collected RT-3DMC stabilised volumetric Z-stacks at the beginning and end of the imaging session. Longitudinal imaging sessions were 1–2 hrs per mouse per day.
In vivo imaging in awake behaving zebrafish larvae.
Zebrafish imaging:
Tg(elavl3:H2B-GCaMP6s) 41 larvae carrying the mitfa−/− skin-pigmentation mutation were used for all experiments 42. Larvae were raised in fish facility water at 28°C on a 14/10 h light/dark cycle and fed Paramecia from 4 days post fertilisation (dpf). All experimental procedures were approved by the UCL Animal Welfare Ethical Review Body and the UK Home Office under the Animal (Scientific Procedures) Act 1986.
Injection of fluorescent beads:
Larvae at 4 dpf were anaesthetised using MS222 (Sigma), and mounted upright in 3% low-melting point agarose (Sigma-Aldrich). A small piece of agarose was cut away with an ophthalmic scalpel to expose an area of the larvae’s head around the hindbrain ventricle. Yellow-green fluorescent beads with a diameter of 5 μm (Invitrogen) were suspended in Ringer’s solution (in mM: NaCl 123, CaCl2 1.53, KCl 4.96 and pH 7.4), and injected into the hindbrain ventricle. Once the presence of fluorescent beads in the brain was confirmed, fish were unmounted from the agarose and left to recover. Where beads did not become securely embedded, fish were discarded as the bead tended to move during swims.
Presentation of visual stimuli and behavioural tracking during two-photon microscopy:
Larval zebrafish were partially restrained in agarose similar to ref. 43. Larvae at 5–6 dpf were anaesthetised using MS222 and mounted upright in 3% agarose. Agarose around the eyes and tail were removed and the fish left to recover overnight before calcium imaging the following day.
Visual stimuli consisted of optomotor gratings projected onto a diffusive screen below the fish using a sub-stage projector (AAXA P2 Jr Pico Projector). A Number 29 Wratten filter (Kodak) was placed in front of the projector to block green light from the PMT. Stimuli were designed using Psychophysics Toolbox44 and moved in different directions (90°, 135°, 225°, 270° with respect to fish heading direction) at 1 cycle/s and with a period of 10 mm. A stimulus was presented every 30 s and drifted for 10 s.
For behavioural tracking, the fish was illuminated by two 850 nm LEDs and imaged at 400 Hz by a sub-stage GS3-U3–41C6NIR-C camera (Point Grey). The tail was tracked online using machine vision algorithms45. Positive angles describe rightward tail bends, and negative angles describe leftward bends.
Characterisation of brain motion and its relation to feedback time
To quantify brain movement we imaged sparsely labelled somata in mouse primary motor cortex, visual cortex, cerebellar molecular layer at > 110 Hz during locomotion and licking and in zebrafish forebrain during swimming bouts. Tissue movement was quantified using post-hoc centroid analysis of selected cells and XY displacements, speed and frequency analysis were calculated using custom MATLAB scripts.
Tuning the PID controller:
We initially tuned the PID controller using a MATLAB simulation of the system using Z stack images from a mouse cortex with a feedback time of 2 ms. For this we used the Ziegler–Nichols method46 to get initial values and then simulated oscillations with lateral RT-3DMC at frequencies from 1– 20 Hz and peak-to-peak amplitudes of 10–40 μm. An error metric was used to find the optimal value for P (0.8) and I (400) for 20 μm peak-to-peak amplitude oscillations at 1–20 Hz. We found that adding any differential term increased the feedback noise and caused instability, so we set D (0) for all experiments. We then reproduced the tuning on the microscope using 4-μm fluorescent beads and a piezo stage, and found these settings were optimal for up to 20 Hz and 20 μm peak-to-peak which is well within the range of mouse brain motion. Although these settings were optimal for sinusoidal oscillations, we found for the stochastic brain motion observed in animals (particularly zebrafish), that changing the proportional setting to P=0.9 was more robust and also worked well with mice. So for the vast majority of experiments reported in this paper, we used P=0.9, I = 400 and D = 0, for both mice and zebrafish. Supplementary Table 1 shows the parameters that can be adjusted to optimise motion correction.
Quantification of the distance dependence of RT-3DMC
To test the assumption that the brain is rigid across the imaging volume and assess the accuracy of RT-3DMC at locations away from the reference object, we performed patch scanning on dendrites or somata throughout the imaged volume during locomotion and licking in mice and tail movements in the fish. We then ran post-hoc, Discrete Fourier Transform (DFT)19-based sub-pixel motion correction on the patches to quantify the uncorrected displacement error (UDE). To isolate non-rigid components of the motion, we subtracted the time averaged Intercycle Reference Displacement (<IRD>) from the remaining movement of all patches.
Data Analysis and Image Processing
Data Acquisition:
Image sequences were acquired using in-house software developed in MATLAB or LabVIEW. For real-time monitoring of motion and errors during imaging, the total offset and IRD were recorded in the acquisition FPGA and sent to the host PC to be logged during experiments. Treadmill speed was measured with a rotary encoder, recorded every 2 ms and sent to the host PC via ethernet communication. Information about microscope settings, acquisition rate, power used or imaging resolution are listed for each figure in Supplementary Table 2.
Data selection:
All reported UDE values, CV values, and power spectrum values are only reported for periods of time when the animal was running, licking, or swimming, in order to normalise for variability in the frequency of activity between animals. We observed that quiet wakeful periods typically show less or no movements. One mouse was excluded from the last timepoint of the longitudinal study because bone regrowth prevented the imaging of the area, and one fish was excluded because the reference bead was not stable in the tissue.
Drift correction:
For data comparison, RT-3DMC off recordings were always re-aligned prior to recordings to correct for drift. This may have underestimated its impact on experiments with RT-3DMC off. Such time-consuming realignment steps are avoided with our RT-3DMC system, which corrects for large displacements.
Software:
Most analyses used standard MATLAB toolboxes, except the UDE estimate for mice which used a DFT based sub-pixel registration19, and the UDE estimate for fish data that used ImageJ trackmate toolbox for subpixel tracking of neuron somata and were manually verified since other registration algorithms failed to automatically register small patches due to excessively large movements, including changes in Z-focus. ImageJ was used to adjust brightness and contrast of the images and videos for display purposes, except for Supplementary Video 6 where an equalisation filter was applied to reveal dim structures.
Normalisation and Filtering:
For UDE estimates, no time smoothing was applied to the data, as frame-to-frame movement could be large, suggesting that a small part of the residual movement in RT-3DMC on (and off) may be due to noise in the estimate. Therefore UDEs reported here are conservative and are likely to be slightly overestimated. Ca2+ signals were smoothed with a 200 or 500 ms asymmetric gaussian kernel (using only data that precedes the current data point), to reduce noise but minimise the impact on the kinetics of events, since transients are usually characterised by fast rise time and slow decay. For CV value and pointing mode recordings (Extended Data Figure 5) we used a 50-ms asymmetric gaussian filter to reduce noise. Power spectrum traces were used unfiltered. F0 baseline value in ΔF/F traces was always computed using the 10th percentile of the signal, except for traces 2–4 in Fig. 4d (RT-3DMC off) where the baseline was computed on the first 10s only as the signal was fluctuating too much when the animal was running.
Event Detection:
Fluorescence transients that coincided with fast lateral and/or axial movements that were too fast to arise from nuclear-localised GCaMP6s Ca2+ signalling were defined as ‘fast transients’ (Fig. 6b). These were isolated by subtracting a median filtered version of the fluorescence trace from the unfiltered signal (both expressed as z-scores). The filtering was first tuned to conserve the GCaMP6s kinetics. The difference was computed, and values above 1 standard deviation are indicated with a marker. The fast component of brain motion in fish during tail movements are much faster than the kinetics of nuclear-localised GCaMP6s, and can be detected with this technique. Slower uncorrected movements, such as the relaxation phase following a swim bout are not detected. To estimate the impact of these transients on analysis, we ran a spike inference algorithm47 (Fig. 6b,d). Tau decay was calculated as 1/log(x) where x is the parameter of the first order auto-regressive process in OASIS48 and set at 7.5s, and drift parameters were constrained to a value 0.001, preventing the algorithm from interpreting slow kinetics of GCaMP6s as drifting baseline. With these parameters the inferred spike rates were low (overall population firing rate was 0.23 ± 0.03 Hz). We defined any inter-spike-interval (ISI) shorter than 2 s as a burst. For Fig. 6d, the ISI indicated corresponds to the interval between a spike occurring during a window of ±1 s around a swim bout and the preceding spike. If a motion artefact caused a premature spike, this will be reflected as a shortened ISIs.
Statistics:
Unless specified, all figures display mean ± standard error of mean (SEM), and mean ± standard deviation (SD) is reported in the text. Statistics were computed with SPSS v26 (IBM). RT-3DMC on/off comparisons were analysed using Wilcoxon rank sum test, or two-tailed Friedman test for repeated measures (sharpness estimate in Fig. 2d and longitudinal study in Fig. 3, Bonferroni post-hoc test for multiple comparisons was used). All UDE comparisons were done using the 95th percentile displacement value during locomotion. Image sharpness (Fig. 2d) was estimated using the maximal value of the normalised cross correlation between the RT-3DMC + post-hoc motion corrected image and the other images.
Extended Data
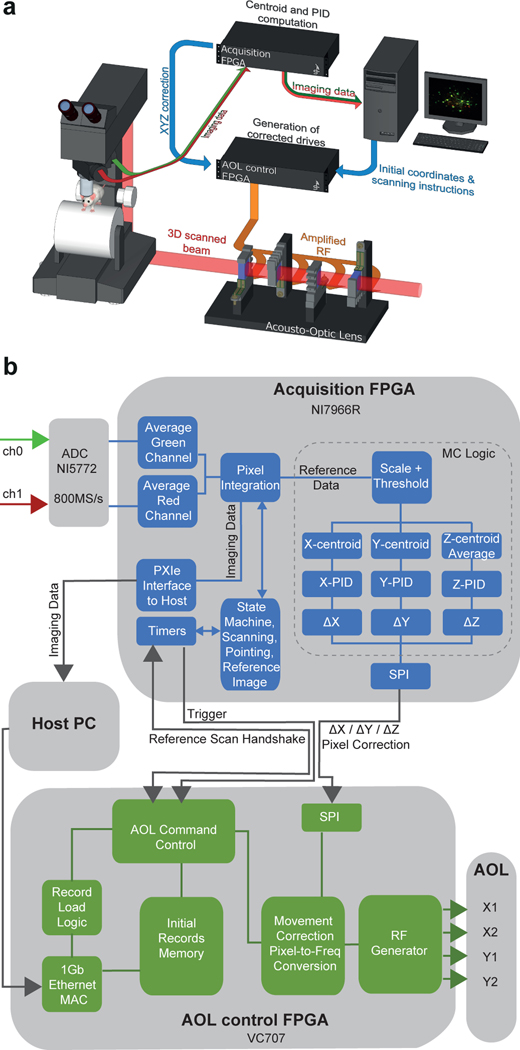
Extended Data Fig. 1. Two-photon microscope and real time 3D movement correction system.
a: Schematic diagram of acousto-optic lens (AOL) microscope and FPGA-based closed loop control and acquisition system for real time 3D movement correction (RT-3DMC). Scanning instructions are sent from the host PC to the AOL controller for imaging and reference scans. The acquisition FPGA estimates the brain movement with centroid analysis and implements a proportional–integral–derivative controller (PID). A fast serial link sends estimated movement information to the controller which uses this to modify the AOL acoustic drives to correct the imaging for brain motion.
b: Architecture of acquisition FPGA (blue) and AOL control system FPGA (green) for reference tracking and motion corrected imaging. The acquisition FPGA contains a state machine to integrate pixels from image data and motion tracking reference frames. The averaging logic down-samples four 1.25 ns samples to a single value at 200 MHz and pixel integration adds these over the pixel dwell time (controlled by the state machine). During acquisition the imaging data is sent to the host PC via the PXIe interface. When reference frames are being acquired the pixels are scaled and thresholded prior to a centroid analysis by the movement correction (MC) logic (dotted line box). Updated offset errors were fed to a PID controller that estimated the optimal sub-pixel offset to send to the AOL controller via a serial protocol interface (SPI). The AOL controller is initialised by sending record parameters for each point or line scan via a Gb Ethernet interface. The Record Load Logic parses the record protocol to store the records for reference imaging or functional imaging in on-chip memory. The host configures the AOL controller to perform the desired mode of operation such as random access line scanning or pointing with or without RT-3DMC. On receiving a trigger from the acquisition FPGA, the AOL Command Control logic block on the AOL control FPGA reads records from on-chip memory in the configured pattern. The records are then passed to the Movement Correction Pixel to Frequency Conversion block, which adjusts the records to compensate for 3D motion, when in RT-3DMC mode. The radio frequency (RF) generator block uses the records to generate the required acoustic-frequency drive waveform, which are then sent to the four AOL crystals after amplification. In RT-3DMC mode, an interrupt from the reference scan handshake signal causes a reference frame to be scanned. Also, in RT-3DMC mode, when a new offset is received via the X, Y, Z pixel correction serial interface, the new offset is applied to each record prior to syntheses by the Movement Correction Pixel to Frequency Conversion block, that calculates the required frequency offset for each line scan or point to correctly track the lateral and axial motion.
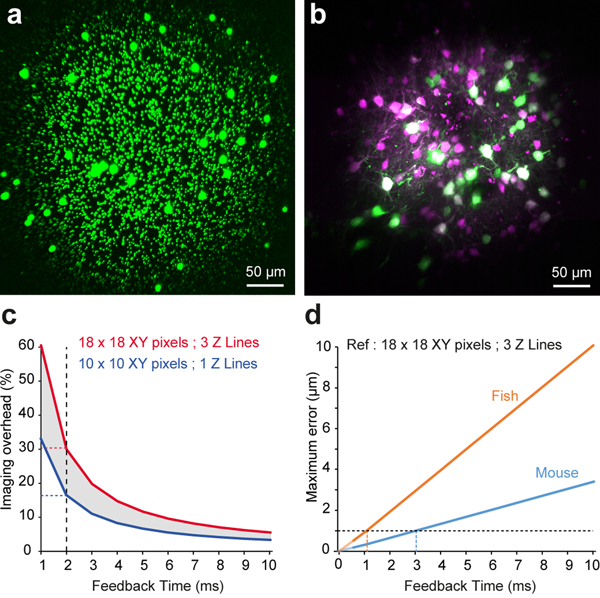
Extended Data Fig. 2. Real time 3D movement correction performance and AOL microscope field of view.
a: Example of 1- and 5-μm fluorescent beads distributed in agarose in a 400×400 μm FOV using the maximum scan angle for the AOL with an Olympus XLUMPlanFLN 20X objective lens. Fall off in intensity of image in corners due to reduced AOL light transmission efficiency at large angles.
b: Example of maximum intensity projection of a 400×400×400 μm Z-stack of localised expression of TdTomato (Magenta) and GCaMP6f (Green) in L2/3 pyramidal cells in motor cortex. Note that the expression levels were higher at the center of the FOV, contributing to a larger fall off in brightness (n=4 mice).
c: The trade-off between the imaging overhead of RT-3DMC and the feedback period for small 10 ×10 pixel reference patches with a single axial scan and larger 18 ×18 pixel patches with 3 axial scans. The dotted lines show the overhead for a reference scan cycle of 2 ms can vary between 17–30%.
d: Relationship between the maximum error and the feedback time in mouse and zebrafish. The graph assumes a maximum brain speed of 0.34 μm/ms in the mouse and 1.02 μm/ms maximum speed for 99.5% of swimming bouts in the zebrafish. To maintain a sub-micrometer error (dotted line) the feedback time should be less than 3 ms and 1 ms in the mouse and zebrafish, respectively.
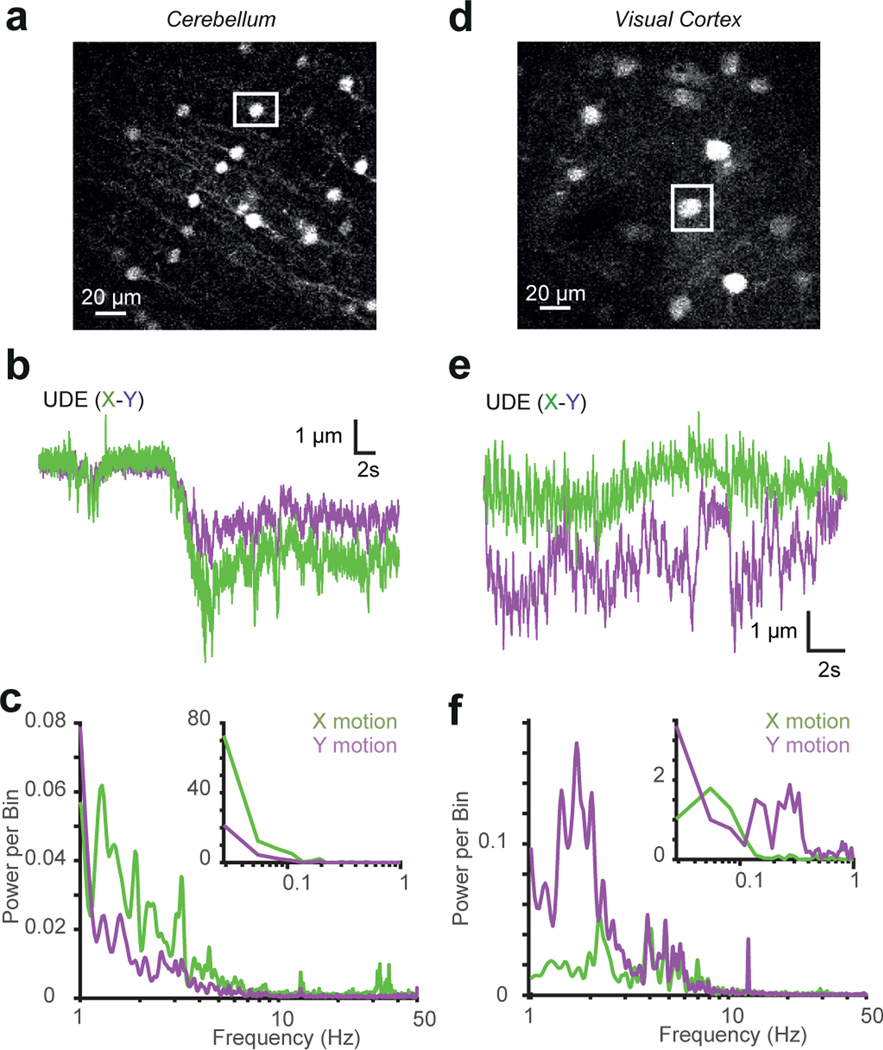
Extended Data Fig. 3. Characterisation of XY movement and frequency spectrum of brain movement.
a: Image of cerebellar molecular layer interneurons expressing GFP used to determine brain movement. The white square shows the selected soma that was used as a reference.
b: X (green) and Y (purple) movement of soma. X-axis is roughly aligned to the rostral-caudal plane (similar results were obtained from 9 experiments on n=1 mice).
c: Power spectrum analysis of X (green) and Y (purple) motion of cerebellum from head-fixed mouse free to run on a treadmill. Inset shows frequencies of < 1 Hz (similar results were obtained from 9 experiments on n=1 mice).
d: Image of pyramidal cells in L2/3 of visual cortex expressing tdTomato. The white frame shows a soma used to track movement.
e: as for b but for visual cortex (similar results were obtained from 13 experiments on n=1 mice).
f: As for c but for visual cortex (similar results were obtained from 13 experiments on n=1 mice).
Extended Data Fig. 4. Performance of real time 3D movement correction with a 0.8 NA 40X objective.
Left: Tracking of a 1-μm diameter bead on a piezoelectric stage driven with a sinusoidal drive at 5 Hz. The absolute reference bead displacement (blue) and the Intercycle Reference Displacement (IRD, red) during RT-3DMC for lateral oscillations (top). Right: Relationship between mean IRD and bead oscillation frequency for different peak-to-peak amplitudes of sinusoidal lateral (blue) and axial (grey) displacements (n=5 different reference beads, mean±SEM). Note that for the lateral motion of 40 μm at 20 Hz, 3 out of 5 reference beads lost tracking.
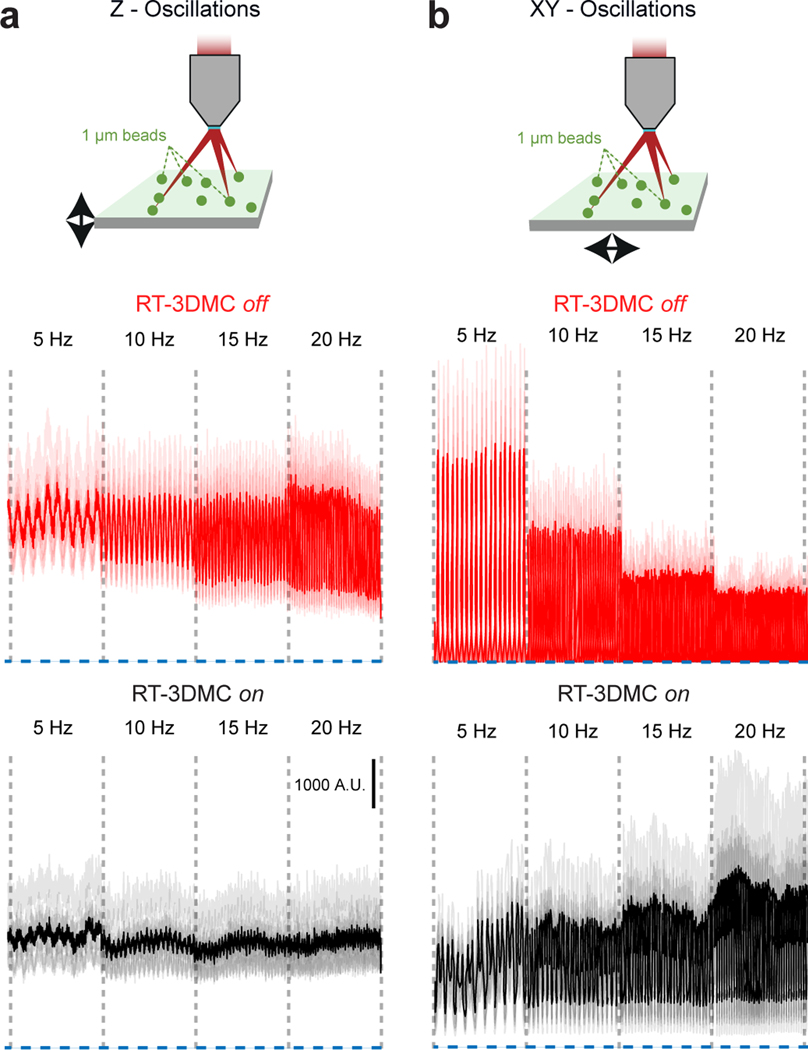
Extended Data Fig. 5. Performance of real-time 3D movement correction for 3D random access point measurements.
a: Top: Schematic diagram of imaging 1-μm fluorescent beads embedded in agarose, mounted on a piezoelectric driven microscope stage oscillating at 5 to 20 Hz in the axial direction. Bottom: Random access point measurements for 10 beads (light traces) in the 3D volume, and the average signal (dark trace) without (red) and with (black) RT-3DMC. Dotted blue line corresponds to background fluorescence level, indicating when the imaging is not pointing at the bead.
b: Top: as for a, but for lateral XY oscillations. Bottom: as for a, but for lateral XY oscillations. Without RT-3DMC (red) the beads move in and out of the focused laser beam. With RT-3DMC (black) the laser beam foci move with the beads thereby giving an intensity signal above background. The residual noise with RT-3DMC reflects small residual movements combined with the sharp intensity falloff of 1-μm beads.
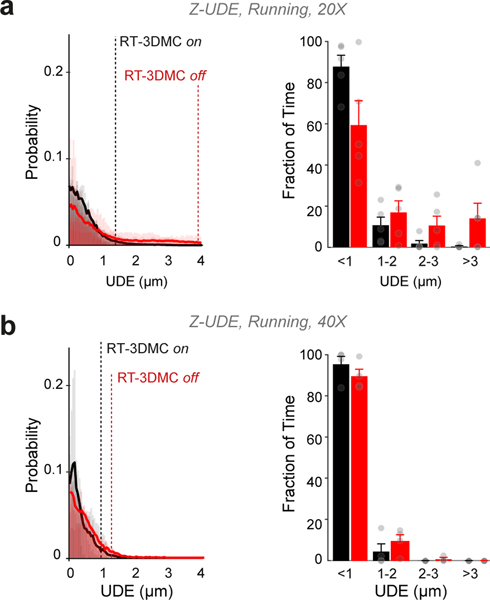
Extended Data Fig. 6. Axial correction of movement with 20X and 40X objective lenses.
a: Using a 20X lens: Left: Distribution of residual Z displacement as estimated by tracking the center of the cell with RT-3DMC on (black) or off (red) and mean residual movement during periods of locomotion (thick lines, n=5 mice). Dotted lines indicate the distance below which 95% of the values are located. Right: similar to left but grouped into 1 μm bins to quantify large infrequent movements (values indicate mean± SEM). With RT-3DMC, 87.9% of timepoints have a residual error of < 1 μm whereas without RT-3DMC about 59 % of the timepoints < 1 μm (p = 0.004, Wilcoxon test, n=11 experiments, 5 animals). Grey circles indicate individual measurements.
b: Using a 40X lens: Left: Distribution of residual Z displacement as estimated by tracking the center of the cell with RT-3DMC on (black) or off (red) and mean residual movement during periods of locomotion (thick lines, n=4 mice). Dotted lines indicate the distance below which 95% of the values are located. Right: similar to left but grouped into 1-μm bins to quantify large infrequent movements (values indicate mean± SEM). With RT-3DMC, 95% of timepoints have a residual error of < 1 μm whereas without RT-3DMC about 89% of the timepoints have mean errors < 1 μm. Grey circles indicate individual measurements.
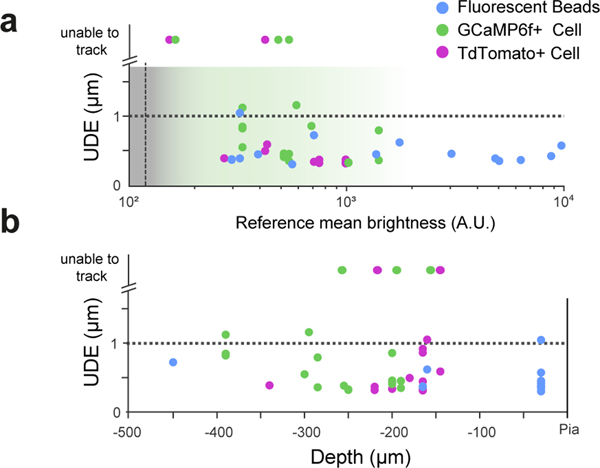
Extended Data Fig. 7. Comparison of beads and somas as reference objects.
a: Comparison of tracking performance for different fluorescence reference objects with different intensities during locomotion (20X objective, n=4 mice); 4-μm, red fluorescent beads (blue), activity dependent GCaMP6f soma (green) and activity independent tdTomato soma (magenta). The grey region indicates the range of fluorescence of the object below which it cannot be resolved, due to a lack of contrast with the background. The transparent green shaded region indicates the dynamic range of GCaMP6f fluorescence and the horizontal black dashed line indicates the 1-μm uncorrected displacement error (UDE) calculated with post-hoc motion detection on 9–10 features. Beads consistently give the best performance and were typically brighter than somata. Tracking was unstable over time or impossible with some soma, indicated on the top of the graph. (n=4 mice)
b: Comparison of tracking performance as a function of depth from the pia for different fluorescence reference objects during locomotion (20X objective, n=4 mice). Data as for a (n=4 mice).
Extended Data Fig. 8. Example of 3D random access point measurement from spines.
a: Example of high contrast 3D projection of layer 2/3 pyramidal cell and image of a single selected spine (n = 1).
b: An example of ΔF/F traces from random access point measurement from 13 spines with (black) and without (red) RT-3DMC together with locomotion speed below each (grey).
Extended Data Fig. 9. Brain movement and real time 3D movement correction during licking and perioral movements.
a: Cartoon of head fixed mouse and arrangement of water spout.
b: Power spectrum of X (green) and Y (purple) motion of the motor cortex during licking bouts. Green and purple thin lines show the average per mouse and the thick green and purple lines show averages across 6 mice. The inset shows frequencies of < 1 Hz.
c: Top: Images of 4 dendrites (15×15 μm) at two timepoints (red star and triangle) during a licking bout illustrating process moving out of focus. Bottom: Average tdTomato signal from the dendrites show intensity fluctuations during licking bout.
d: GCaMP6f recordings during licking bouts. Top: Motion index extracted from the perioral region (blue trace). Visually identified licking bouts (red lines below). Centre: GCaMP6f florescence extracted from active spines (grey ROIs in the middle, GCaMP6f in green, TdTomato in magenta) with RT-3DMC off (left, red) or on (right, black). Bottom: XY UDE (for RT-3DMC off, purple and green lines; left) and RT-3DMC (X, Y, Z blue, orange, grey, respectively; right) indicates the amount of brain movement during periods of licking (1 of 4 mice).
e: Distribution of XY UDE values with RT-3DMC on (black) or off (red) and mean (thick lines) during periods of licking (n=13 experiments, 4 mice). Dotted lines indicate the distance below which 95% of the values are located.
f: Similar to e but grouped into 1 μm bins to quantify large infrequent movements. With RT-3DMC, 95.6% of timepoints have a residual error of < 1 μm whereas only 81.9% without (n=4 mice, mean± SEM). Grey circles indicate individual measurements.
g: Same as e for XY UDE during all perioral movements (n=4 mice).
h: same as f for XY UDE during all perioral movements. With RT-3DMC, 95.2% of timepoints have a residual error of < 1 μm whereas only 76.3% without. (n=4 mice, mean± SEM). Grey circles indicate individual measurements.
i: Same as e for Z UDE during all licking (n=4 mice).
j: same as f for Z UDE during licking movements. With RT-3DMC, 91.4% of timepoints have a residual error of < 1 μm whereas 89.3.% without. (n=4 mice, mean± SEM). Grey circles indicate individual measurements.
k: Same as g for Z UDE during all perioral movements (n=4 mice).
l: same as h for Z UDE during all perioral movements. With RT-3DMC, 91.0% of timepoints have a residual error of < 1 μm whereas 87.8.% without. (n=4 mice, mean± SEM). Grey circles indicate individual measurements.
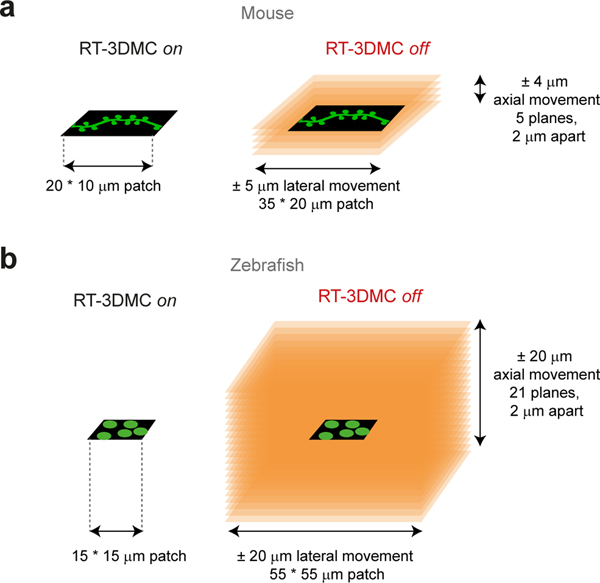
Extended Data Fig. 10. Speed improvements with real-time 3D movement correction.
Schematic diagrams comparing the size of patch versus subvolume needed to keep the ROIs in the imaging frame with RT-3DMC (left) and without RT-3DMC (right):
a: Imaging dendrites in a mouse with a 10×25 μm patch with 0.5 μm pixels, each with a dwell time of 0.4 μs takes Ny*(24.5 + Nx*dwell) μs = 890 μs with RT-3DMC on. Without RT-3DMC the dendrite may move both laterally and axially. Assuming lateral motion of ±5 μm and axial motion ±4 μm, imaging would require a volume scan of: 5x(20×35) μm patches taking 10,500 μs, to keep the dendrite within the FOV so that post-hoc XY and Z correction can be applied. That is about 12X slower than with RT-3DMC.
b: For zebrafish, patches over selected soma were typically 15×15 μm with a pixel size of 1 μm. With RT-3DMC and a dwell time of 0.4 μs a single patch would take 458 μs. Without RT-3DMC, typical maximum displacements are in the order of ±20 μm both laterally and axially requiring an imaging volume of 55×55×40 μm to monitor soma activity. The time to image a suitable sub-volume to keep the ROI in the FOV is 53,708 μs, about 117 times slower than with RT-3DMC
Supplementary Material
Acknowledgements
Research reported in this publication was supported by the Wellcome Trust (095667; 203048 to RAS), the ERC (294667 to RAS) and the National Institute Of Neurological Disorders And Stroke of the National Institutes of Health under Award Numbers U01NS099689 and U01NS113273(to RAS). The content is solely the responsibility of the authors and does not necessarily represent the official views of the National Institutes of Health. RAS is in receipt of a Wellcome Trust Principal Research Fellowship in Basic Biomedical Science (203048). VG was supported in part by a UCL/EPSRC Case studentship with Gooch and Housego. IHB and JYNL funded by the Wellcome Trust and a Royal Society Sir Henry Dale Fellowship (101195). T.J.Y. was supported by postdoctoral fellowships from the Human Frontier Science Program and the Marie Skłodowska-Curie Actions of the EC (707511). C.B. was funded by the Wellcome Trust PhD programme (097266). BM was funded by grant #2018/20277-0, São Paulo Research Foundation (FAPESP). We acknowledge the GENIE Program and the Janelia Research Campus, Howard Hughes Medical Institute for making the GCaMP6 material available. We thank Tomas Fernandez-Alfonso, Harsha Gurnani and Lena Justus for comments on the manuscript.
Ethics Declaration
A.V, J.Y.N.L., B.M., I.H.B., H.R., C.B., D.C., G.J.E., T.J.Y., and T.K. declare no competing financial interests. P.A.K., K.M.N.S.N. and R.A.S are named inventors on patents owned by UCL Business relating to linear and nonlinear Acousto-Optic Lens 3D laser scanning technology. P.A.K., K.M.N.S.N., G.K. and V.G. have a financial interest in Agile Diffraction Ltd which aims to commercialise the AOL and real-time 3D-MC technology.
Footnotes
Further information on research design is available in the Nature Research Reporting Summary linked to this article.
Data Availability Statement
Source data for Fig. 1-6 are available online. Processed data and code required to generate Fig. 1–6 and Extended Data Fig. 4-7 and 9 is available on FigShare49. Raw unprocessed data have a complex data structure (>20000 files, >1000 folders, >100GB), but original data can be made available upon request.
Code Availability Statement
The SilverLab Imaging Software together with an application programming interface (API) is available on GitHub at https://github.com/SilverLabUCL/SilverLab-Microscope
Peer review information: Nina Vogt was the primary editor on this article and managed its editorial process and peer review in collaboration with the rest of the editorial team.
References
- 1.Helmchen F. & Denk W. Deep tissue two-photon microscopy. Nat. Methods 2, 932–940 (2005). [DOI] [PubMed] [Google Scholar]
- 2.Svoboda K. & Yasuda R. Principles of Two-Photon Excitation Microscopy and Its Applications to Neuroscience. Neuron 50, 823–839 (2006). [DOI] [PubMed] [Google Scholar]
- 3.Froudarakis E. et al. Population code in mouse V1 facilitates readout of natural scenes through increased sparseness. Nat. Neurosci 17, 851–857 (2014). [DOI] [PMC free article] [PubMed] [Google Scholar]
- 4.Nadella KMNS et al. Random-access scanning microscopy for 3D imaging in awake behaving animals. Nat. Methods 13, 1001–1004 (2016). [DOI] [PMC free article] [PubMed] [Google Scholar]
- 5.Iyer V, Hoogland TM & Saggau P. Fast functional imaging of single neurons using random-access multiphoton (RAMP) microscopy. J. Neurophysiol 95, 535–545 (2006). [DOI] [PubMed] [Google Scholar]
- 6.Katona G. et al. Fast two-photon in vivo imaging with three-dimensional random-access scanning in large tissue volumes. Nat. Methods 9, 201–208 (2012). [DOI] [PubMed] [Google Scholar]
- 7.Szalay G. et al. Fast 3D Imaging of Spine, Dendritic, and Neuronal Assemblies in Behaving Animals. Neuron 92, 723–738 (2016). [DOI] [PMC free article] [PubMed] [Google Scholar]
- 8.Cotton RJ, Froudarakis E, Storer P, Saggau P. & Tolias AS Three-dimensional mapping of microcircuit correlation structure. Front. Neural Circuits 7, 151 (2013). [DOI] [PMC free article] [PubMed] [Google Scholar]
- 9.Yang W. et al. Simultaneous Multi-plane Imaging of Neural Circuits. Neuron 89, 269–284 (2016). [DOI] [PMC free article] [PubMed] [Google Scholar]
- 10.Ji N, Freeman J. & Smith SL Technologies for imaging neural activity in large volumes. Nat. Neurosci 19, 1154–1164 (2016). [DOI] [PMC free article] [PubMed] [Google Scholar]
- 11.Kong L. et al. Continuous volumetric imaging via an optical phase-locked ultrasound lens. Nat. Methods 12, 759–762 (2015). [DOI] [PMC free article] [PubMed] [Google Scholar]
- 12.Fernández-Alfonso T. et al. Monitoring synaptic and neuronal activity in 3D with synthetic and genetic indicators using a compact acousto-optic lens two-photon microscope. J. Neurosci. Methods 222, 69–81 (2014). [DOI] [PMC free article] [PubMed] [Google Scholar]
- 13.Dombeck DA, Khabbaz AN, Collman F, Adelman TL & Tank DW Imaging Large-Scale Neural Activity with Cellular Resolution in Awake, Mobile Mice. Neuron 56, 43–57 (2007). [DOI] [PMC free article] [PubMed] [Google Scholar]
- 14.Greenberg DS & Kerr JND Automated correction of fast motion artifacts for two-photon imaging of awake animals. J. Neurosci. Methods 176, 1–15 (2009). [DOI] [PubMed] [Google Scholar]
- 15.Chen JL, Pfäffli OA, Voigt FF, Margolis DJ & Helmchen F. Online correction of licking-induced brain motion during two-photon imaging with a tunable lens. J. Physiol 591, 4689–4698 (2013). [DOI] [PMC free article] [PubMed] [Google Scholar]
- 16.Ahrens MB et al. Brain-wide neuronal dynamics during motor adaptation in zebrafish. Nature 485, 471–477 (2012). [DOI] [PMC free article] [PubMed] [Google Scholar]
- 17.Paukert M. & Bergles DE Reduction of motion artifacts during in vivo two-photon imaging of brain through heartbeat triggered scanning. J. Physiol 590, 2955–2963 (2012). [DOI] [PMC free article] [PubMed] [Google Scholar]
- 18.Laffray S. et al. Adaptive movement compensation for in vivo imaging of fast cellular dynamics within a moving tissue. PLoS One 6, e19928 (2011). [DOI] [PMC free article] [PubMed] [Google Scholar]
- 19.Guizar-Sicairos M, Thurman ST & Fienup JR Efficient subpixel image registration algorithms. Opt. Lett 33, 156–158 (2008). [DOI] [PubMed] [Google Scholar]
- 20.Yang W. & Yuste R. Holographic imaging and photostimulation of neural activity. Curr. Opin. Neurobiol 50, 211–221 (2018). [DOI] [PubMed] [Google Scholar]
- 21.Packer AM, Russell LE, Dalgleish HWP & Häusser M. Simultaneous all-optical manipulation and recording of neural circuit activity with cellular resolution in vivo. Nat. Methods 12, 140–146 (2015). [DOI] [PMC free article] [PubMed] [Google Scholar]
- 22.Rickgauer JP, Deisseroth K. & Tank DW Simultaneous cellular-resolution optical perturbation and imaging of place cell firing fields. Nat. Neurosci 17, 1816–1824 (2014). [DOI] [PMC free article] [PubMed] [Google Scholar]
- 23.Mardinly AR et al. Precise multimodal optical control of neural ensemble activity. Nat. Neurosci 21, 881–893 (2018). [DOI] [PMC free article] [PubMed] [Google Scholar]
- 24.Pnevmatikakis EA & Giovannucci A. NoRMCorre: An online algorithm for piecewise rigid motion correction of calcium imaging data. J. Neurosci. Methods 291, 83–94 (2017). [DOI] [PubMed] [Google Scholar]
- 25.Mitani A. & Komiyama T. Real-time processing of two-photon calcium imaging data including lateral motion artifact correction. Front. Neuroinform 12, 1–13 (2018). [DOI] [PMC free article] [PubMed] [Google Scholar]
- 26.Haesemeyer M, Robson DN, Li JM, Schier AF & Engert F. A Brain-wide Circuit Model of Heat-Evoked Swimming Behavior in Larval Zebrafish. Neuron 98, 817–831.e6 (2018). [DOI] [PMC free article] [PubMed] [Google Scholar]
- 27.Karagyozov D, Mihovilovic Skanata M, Lesar A. & Gershow M. Recording Neural Activity in Unrestrained Animals with Three-Dimensional Tracking Two-Photon Microscopy. Cell Rep. 25, 1371–1383.e10 (2018). [DOI] [PMC free article] [PubMed] [Google Scholar]
- 28.Kirkby PA, Srinivas Nadella KMN & Silver RA A compact acousto-optic lens for 2D and 3D femtosecond based 2-photon microscopy. Opt. Express 18, 13720–13745 (2010). [DOI] [PMC free article] [PubMed] [Google Scholar]
- 29.Konstantinou G. et al. Dynamic wavefront shaping with an acousto-optic lens for laser scanning microscopy. Opt. Express 24, 6283–6299 (2016). [DOI] [PMC free article] [PubMed] [Google Scholar]
- 30.Chen TW et al. Ultrasensitive fluorescent proteins for imaging neuronal activity. Nature 499, 295–300 (2013). [DOI] [PMC free article] [PubMed] [Google Scholar]
- 31.Kim DH et al. Pan-neuronal calcium imaging with cellular resolution in freely swimming zebrafish. Nat. Methods 14, 1107–1114 (2017). [DOI] [PubMed] [Google Scholar]
- 32.Nguyen JP et al. Whole-brain calcium imaging with cellular resolution in freely behaving Caenorhabditis elegans. Proc. Natl. Acad. Sci. U. S. A 113, E1074–E1081 (2016). [DOI] [PMC free article] [PubMed] [Google Scholar]
- 33.Venkatachalam V. et al. Pan-neuronal imaging in roaming Caenorhabditis elegans. Proc. Natl. Acad. Sci. U. S. A 113, E1082–E1088 (2016). [DOI] [PMC free article] [PubMed] [Google Scholar]
- 34.Yang HHH et al. Subcellular Imaging of Voltage and Calcium Signals Reveals Neural Processing In Vivo. Cell 166, 245–257 (2016). [DOI] [PMC free article] [PubMed] [Google Scholar]
- 35.Badura A, Sun XR, Giovannucci A, Lynch LA & Wang SS-H Fast calcium sensor proteins for monitoring neural activity. Neurophotonics 1, 025008 (2014). [DOI] [PMC free article] [PubMed] [Google Scholar]
- 36.Helassa N. et al. Ultrafast glutamate sensors resolve high-frequency release at Schaffer collateral synapses. Proc. Natl. Acad. Sci. U. S. A 115, 5594–5599 (2018). [DOI] [PMC free article] [PubMed] [Google Scholar]
- 37.Marvin JS et al. Stability, affinity, and chromatic variants of the glutamate sensor iGluSnFR. Nat. Methods 15, 936–939 (2018). [DOI] [PMC free article] [PubMed] [Google Scholar]
- 38.Noguchi J. et al. In vivo two-photon uncaging of glutamate revealing the structure-function relationships of dendritic spines in the neocortex of adult mice. J. Physiol 589, 2447–2457 (2011). [DOI] [PMC free article] [PubMed] [Google Scholar]
- 39.Hernandez O. et al. , Three-dimensional spatiotemporal focusing of holographic patterns. Nat. Commun 7, 11928 (2016). [DOI] [PMC free article] [PubMed] [Google Scholar]
- 40.Zhang Z, Russell LE, Packer AM, Gauld OM & Häusser M. Closed-loop all-optical interrogation of neural circuits in vivo. Nat. Methods 15, 1037–1040 (2018). [DOI] [PMC free article] [PubMed] [Google Scholar]
Methods-only References
- 41.Vladimirov N. et al. Light-sheet functional imaging in fictively behaving zebrafish. Nat. Methods 11, 883–884 (2014). [DOI] [PubMed] [Google Scholar]
- 42.Lister JA, Robertson CP, Lepage T, Johnson SL & Raible DW Nacre Encodes a Zebrafish Microphthalmia-Related Protein That Regulates Neural-Crest-Derived Pigment Cell Fate. Development 126, 3757–3767 (1999). [DOI] [PubMed] [Google Scholar]
- 43.Bianco IH & Engert F. Visuomotor transformations underlying hunting behavior in zebrafish. Curr. Biol 25, 831–846 (2015). [DOI] [PMC free article] [PubMed] [Google Scholar]
- 44.Brainard DH The Psychophysics Toolbox. Spat. Vis (1997). doi: 10.1163/156856897X00357 [DOI] [PubMed] [Google Scholar]
- 45.Bianco IH, Kampff AR & Engert F. Prey capture behavior evoked by simple visual stimuli in larval zebrafish. Front. Syst. Neurosci 5, 1–13 (2011). [DOI] [PMC free article] [PubMed] [Google Scholar]
- 46.Ziegler JG & Nichols NB Optimum settings for automatic controllers. Transactions of ASME. 64, 759–768 (1942) [Google Scholar]
- 47.Deneux T. et al. Accurate spike estimation from noisy calcium signals for ultrafast three-dimensional imaging of large neuronal populations in vivo. Nat. Commun 7, :12190 (2016). [DOI] [PMC free article] [PubMed] [Google Scholar]
- 48.Friedrich J, Zhou P. & Paninski L. Fast online deconvolution of calcium imaging data. PLOS Computational Biology 13, e1005423 (2017) [DOI] [PMC free article] [PubMed] [Google Scholar]
- 49.Valera A, Griffiths V. & Silver A. Data and code for Figures for the article “Real-time 3D movement correction for two-photon imaging in behaving animals”. 10.5522/04/11949063 (2020). [DOI] [PMC free article] [PubMed] [Google Scholar]
Associated Data
This section collects any data citations, data availability statements, or supplementary materials included in this article.


