Abstract
Purpose
The novel coronavirus pandemic has caused significant morbidity and mortality since December 2019. Although the role of chest CT for diagnosing coronavirus disease 2019 (COVID-19) pneumonia is still debatable, the modality has been used in scenarios of constrained reverse-transcription polymerase chain reaction (RT-PCR) testing. The epidemiologic reports indicate an unexplored difference between men and women in disease severity. We aimed to study the role of sex on disease severity and its correlation with CT findings.
Materials and Methods
Authors retrospectively studied all confirmed cases of COVID-19 with thoracic CT scans obtained at three hospitals from February 25, 2020, to March 15, 2020, in Tehran, Iran. CT involvement patterns of COVID-19 were analyzed based on sex and age of patients.
Results
One hundred fifteen patients (64.3% [74/115] men) were enrolled, with a median age of 57 years (age range, 21–89). Thirty patients were admitted to the intensive care unit, and 30 patients died during the hospital stay. Seventy-seven percent (37/48) of patients with unfavorable prognosis were male. Peripheral distribution of opacities was more common in men than women. When grouped by an age cut-off of 60 years, the women in the elder group had a peribronchovascular distribution pattern, and younger men showed an anterior distribution of opacities. Women younger than 60 years had significantly lower severity scores (CT-scores) (7.5 ± 6.8). Receiver operating characteristic (ROC) curve analysis demonstrated a CT-score cut-off of 14.5 to have 100% sensitivity and 91.9% specificity for predicting poor prognosis in women younger than 60 years.
Conclusion
Opacity patterns on chest CT scans in COVID-19 are different based on sex and age, and men are at higher risk of disease severity and death.
© RSNA, 2020
Summary
Although there was no significant difference in chest CT involvement pattern between men and women with coronavirus disease 2019 (COVID-19) pneumonia, women younger than 60 years showed significantly lower COVID-19–related CT score.
Key Points
■ Women younger than 60 years with coronavirus disease 2019 pneumonia had significantly lower CT-scores.
■ Compared with women, men older than 60 years had peripheral distribution of opacities more frequently.
■ Men younger than 60 years tend to have an anterior distribution of opacities more commonly compared with the same age women.
Introduction
The coronavirus disease 2019 (COVID-19) pandemic has infected more than 6 million people since December 2019. It has killed more than 371 000 people in more than 210 countries and territories all over the world as of June 1, 2020 (1). Currently, reverse-transcription polymerase chain reaction (RT-PCR) is the standard diagnostic test for detection of severe acute respiratory syndrome coronavirus 2 (SARS-CoV-2)–infected patients; however, due to some limitations associated with this method (eg, unavailability, inappropriate sampling method, and differences in manufacturer technology), CT is considered to be of ancillary value for patient management and diagnosis. Although debatable, some studies have shown that chest CT could have higher sensitivity than RT-PCR (2,3). Some findings are commonly reported in COVID-19 chest CT scans, including ground-glass opacities, consolidation, and crazy paving pattern (4). Men and women have been reported to be equally infected, but different available epidemiologic analyses show sex-related differences in severity and mortality by the disease (5). Only recently, a brief report on the gendered impact of the current pandemic discussed the different roles of genetic background and societal structure on the vulnerability of men and women (6). Despite its importance, the role of sex difference in disease severity and mortality and its association with radiologic CT findings have not been explored sufficiently. This study aimed to compare the demographic, clinical, and radiologic findings of COVID-19 between men and women and to assess whether the sex factor could have prognostic implications on the management of this devastating disease.
Materials and Methods
From February 25, 2020, to March 15, 2020, the data of patients diagnosed with COVID-19 from three university hospitals of Imam Khomeini Hospital Complex, Amiralam Hospital, and Yas Women’s Hospital were evaluated retrospectively in Tehran, Iran. This multicenter study was approved by the ethics committee (protocol number: IR.TUMS.VCR.REC.1399.038), and informed consent was acquired from patients for using their admission data for research purposes. During the study period, all patients with a positive RT-PCR for COVID-19 who had undergone thoracic CT examination on admission were consecutively included for the evaluation. Only the first CT scan of the referring patients was considered for evaluation. One hundred fifteen patients were enrolled in the study, 67 of whom did not need admission, or were admitted, but not to the intensive care unit (ICU). Thirty patients needed ICU care, and 12 of them died in the course of their disease. An additional 18 patients died before admission to ICU. Patients were categorized into two groups according to prognosis, defined as unfavorable (those who needed ICU admission or died) and favorable (those who recovered and did not need ICU admission). All the discharged patients were checked for any disease-related health issue by telephone until March 20, 2020, and none of them had died by that time.
CT Protocol
Two CT systems (SOMATOM Emotion 16 scanner, Siemens, Erlangen, Germany; and SOMATOM Emotion 6 scanner, Siemens) were used to obtain the images. The images were obtained in the supine position and during full inspiratory pause. The range of volume CT dose index was 2.3–8.4 mGy. Radiation exposure was minimized by setting the acquisition parameters as the following: tube voltage, 80–110 kVp; effective current, 60–80 mA; pitch, 1–1.5; matrix, 512 × 512; slice thickness, 5 mm (reconstructed slice thickness, 1.5 mm), and pulmonary U90s kernel. Intravenous contrast material was not used.
Imaging Interpretation
Both lung (width, 1500 HU; level, −700 HU) and mediastinal (width, 350 HU; level, 40 HU) settings were used to interpret the CT images. Two radiologists (B.M., M.A.K.) experienced in the field of cardiothoracic imaging, with 5 and 10 years of experience, respectively, reviewed each CT scan at the same time. No information about patients’ outcomes or their clinical condition was available for them. The checklist was filled after a final agreement between the two radiologists, and conflicts were resolved by mutual discussion. If an agreement was not reached, a third radiologist experienced in interpretation of chest CT scans helped to resolve the disagreement. Opacities were categorized into four groups according to density, including ground-glass opacity, consolidation, mixed-type opacity with > 50% ground-glass opacity, and mixed-type opacity with > 50% consolidation. Reverse halo sign, nodular pattern, intralesional bronchial distortion, and linear opacity were also evaluated (7). Distribution of the lesions was recorded as peripheral (outer one-third of the lungs), axial (the patchy opacities that extend to lung hila and show lobar bronchial contact), peribronchovascular (opacities that occur along the peribronchovascular bundle), and diffuse. Paracardiac (more than 2 cm in contact with pericardium at lingula and right middle lobe) and anterior (the involvement of anterior one-fourth of lung periphery in both upper and lower areas) areas were evaluated additionally. A severity score (CT-score) was calculated for all lobes separately, according to the extension of the pulmonary opacities. The scores ranged from 0 to 5 based on the lobes’ percentile involvement, using 0 for lack of involvement, 1 for less than 5% involvement, 2 for 5%–24% involvement, 3 for 25%–49% involvement, 4 for 50%–74% involvement, and 5 for 75%–100% involvement (8). The total CT-score ranged from 0 to 25. Underlying emphysema, bronchiectasis, fibrosis, or masses were also recorded. Reactive lymphadenopathy (short axis diameter > 10 mm), pulmonary artery enlargement (diameter > 30 mm), and pleural effusion were evaluated in the mediastinal window.
Statistical Analysis
Statistical analysis was done using IBM SPSS Statistics version 26 (SPSS, Chicago, Ill). Descriptive statistics were reported by frequency and mean ± standard deviation for qualitative and quantitative data, respectively. Pearson χ2 and Mann-Whitney U tests were used to check the significant relationship between study variables. Spearman rank-order correlation test was used to assess the correlation of total CT-score and patient age. Receiver operating characteristic (ROC) curves were plotted to assess the performance of the total CT-score in predicting the patients who died or who were admitted to the ICU (unfavorable outcome). Cutoffs with the best trade-off for sensitivity and specificity (based on “closest top left” method) were also reported. A logistic regression analysis with backward stepwise Wald method was performed to ascertain the effects of age, sex, underlying comorbidities, different symptoms, and the total CT-score on the likelihood of patients’ prognosis.
Results
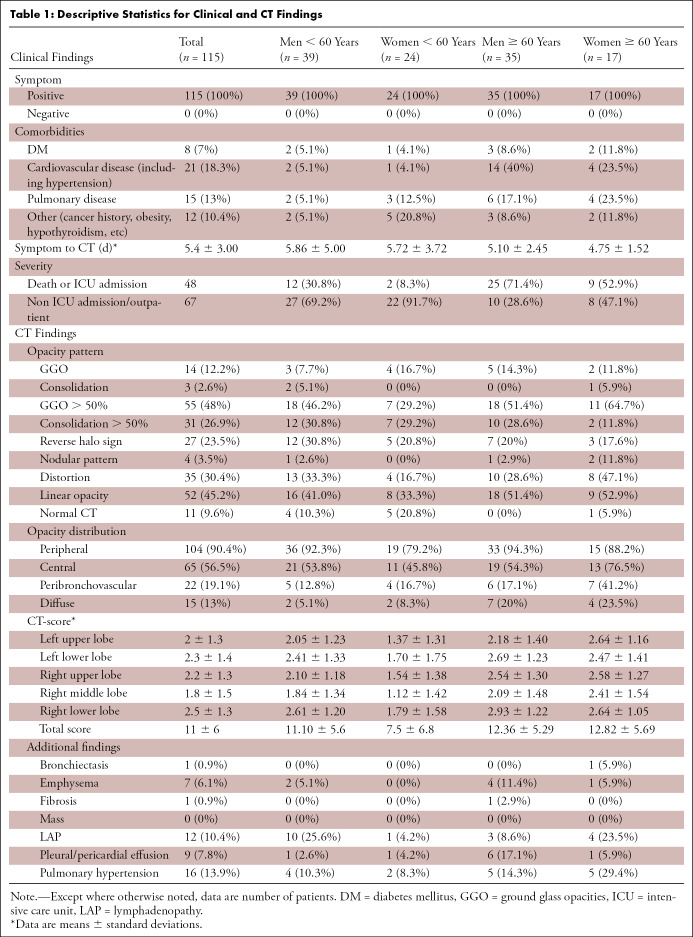
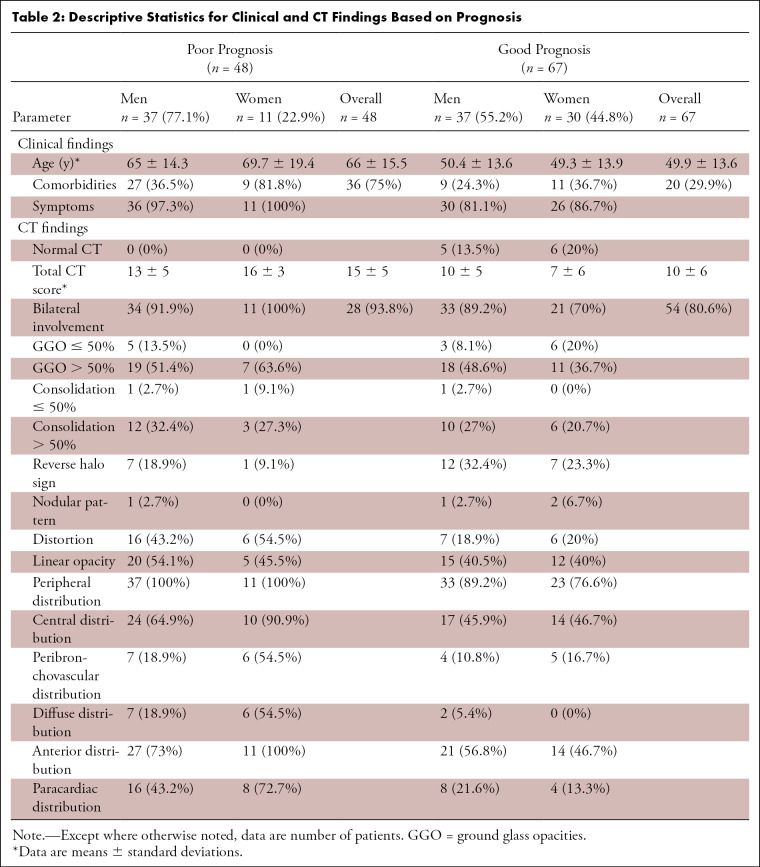
One hundred fifteen patients (74 [64.3%] men and 41 [35.7%] women) with a median age of 57 (age range, 21–89) were enrolled in the study. Thirty patients were admitted to the ICU, from which 12 patients died. A total of 30 patients (23 men) died during their disease at the hospital. Based on the plot and the median age of patients (ie, 57 years), we further categorized the study population into two groups: younger than 60 years, n = 63/115 (54.8%), and older than 60 years, n = 52/115 (45.2%). Table 1 summarizes the clinical and CT findings for the study participants based on their sex and age. Seventy-seven percent (37/48) of patients with unfavorable prognosis and 55.2% (37/67) of patients with favorable prognosis were male. This difference was statistically significant (χ2 = 5.82, P = .016, Phi = 0.22), indicating that patients with unfavorable prognosis are more likely to be men. Table 2 summarizes the descriptive statistics based on prognosis defined as poor for patients needing ICU, or those who died, and good prognosis for those who recovered.
Table 1:
Descriptive Statistics for Clinical and CT Findings
Table 2:
Descriptive Statistics for Clinical and CT Findings Based on Prognosis
Patients with unfavorable prognosis were older (66 years ± 15.5 vs 49.9 years ± 13.6, P < .0001), had more comorbidities (31.3% [36/48] vs 17.4% [20/67], P < .0001) and had higher CT-scores (15 ± 5 vs 10 ± 6, P < .0001) than patients with favorable prognosis.
None of the CT findings were significantly different between men and women, except for the peripheral distribution of opacities, which was more common in men (χ2 = 4.15, P = .04, Phi = 0.19). Sixty-six percent (69/104) of patients with peripheral involvement were men, while 63.6% (7/11) of cases with no peripheral involvement were women. Besides, bilateral CT involvement had a marginally significant difference between men and women (χ2 = 3.43, P = .064, Phi = 0.17); 94.3% (67/71) of men and 78.0% (32/41) of women had bilateral CT involvement (Figs 1–3).
Figure 1a:
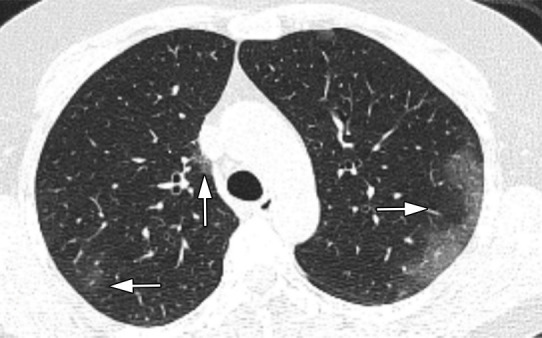
Images in a 52-year-old woman without underlying disease, who presented with fever, cough, and myalgia since 10 days before imaging with total CT-score of 8. (a) Axial thin-section CT image shows bilateral upper lobes ground glass opacities (arrows). (b) Linear opacities in both lower lobes (arrows). (c) Intralesional bronchial distortion (arrow).
Figure 3a:
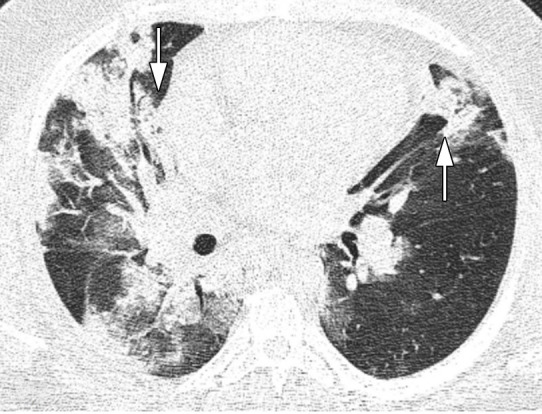
Images in a 43-year-old man who presented with fever, cough, and dyspnea 7 days before, without underlying disease, with total CT-score of 17, who died after a few days of intensive care unit admission. (a) Axial thin-section unenhanced CT image shows bilateral mostly consolidation opacities (arrows) with paracardiac involvement especially in right lung. (b) Right side trace plural effusion (arrow).
Figure 1b:
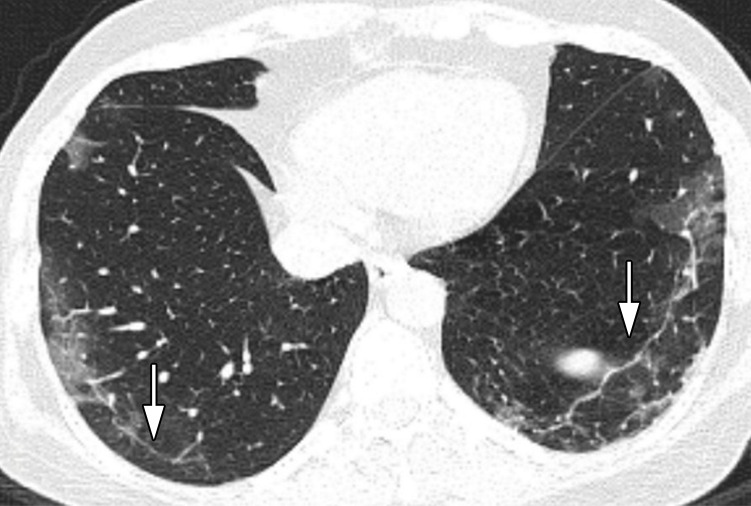
Images in a 52-year-old woman without underlying disease, who presented with fever, cough, and myalgia since 10 days before imaging with total CT-score of 8. (a) Axial thin-section CT image shows bilateral upper lobes ground glass opacities (arrows). (b) Linear opacities in both lower lobes (arrows). (c) Intralesional bronchial distortion (arrow).
Figure 1c:

Images in a 52-year-old woman without underlying disease, who presented with fever, cough, and myalgia since 10 days before imaging with total CT-score of 8. (a) Axial thin-section CT image shows bilateral upper lobes ground glass opacities (arrows). (b) Linear opacities in both lower lobes (arrows). (c) Intralesional bronchial distortion (arrow).
Figure 2:
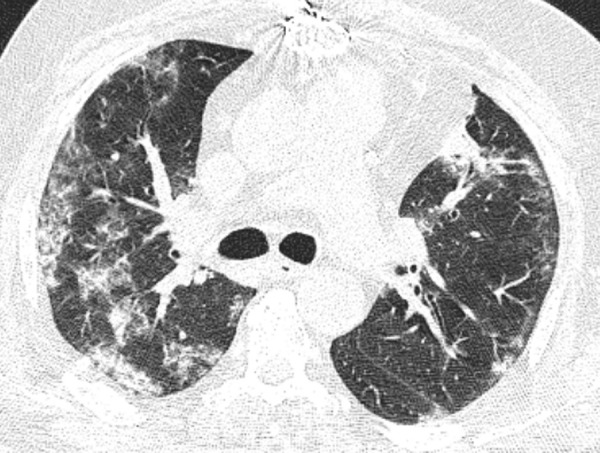
Image in a 64-year-old man who presented with fever since 2 days before CT examination with history of sternotomy and total CT-score of 14, who was admitted in intensive care unit. Axial thin-section unenhanced CT image shows bilateral mostly consolidation opacities.
Figure 3b:
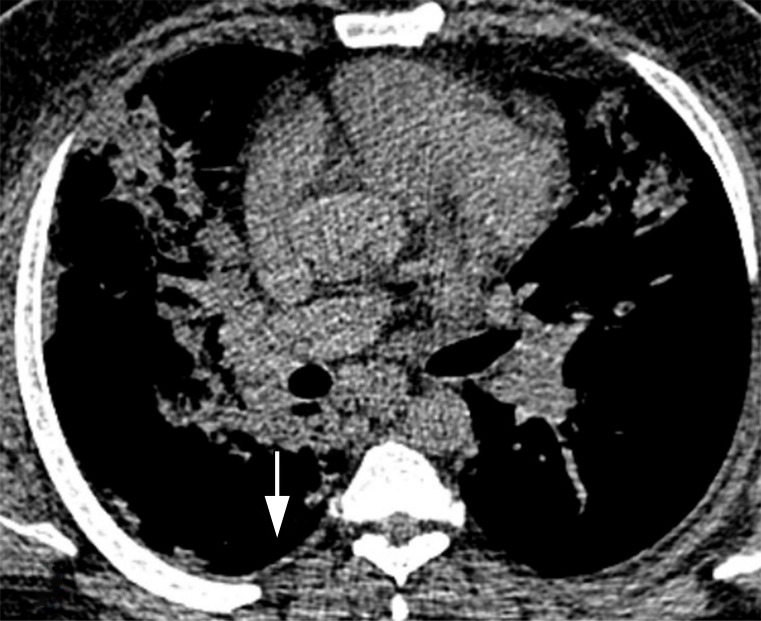
Images in a 43-year-old man who presented with fever, cough, and dyspnea 7 days before, without underlying disease, with total CT-score of 17, who died after a few days of intensive care unit admission. (a) Axial thin-section unenhanced CT image shows bilateral mostly consolidation opacities (arrows) with paracardiac involvement especially in right lung. (b) Right side trace plural effusion (arrow).
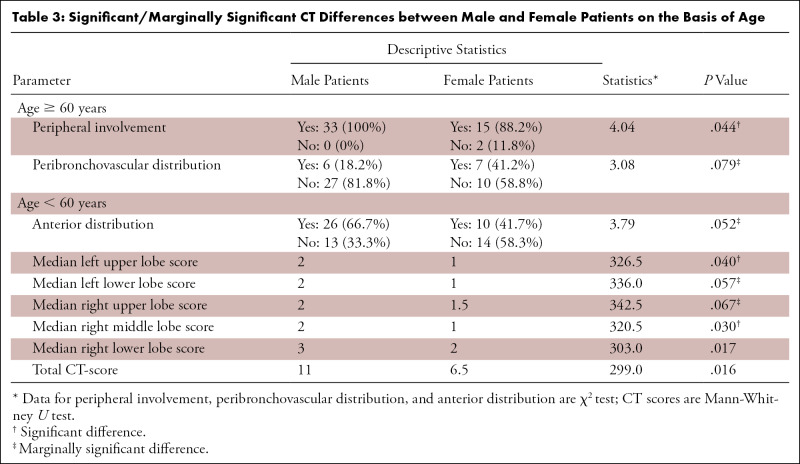
Age and total CT-scores were linearly correlated (Spearman rank-order correlation test rho = 0.27, P = .003). In the older patient group, the two parameters were significantly or marginally significantly different between men and women; the peripheral opacity distribution was more common among the men (P = .03), while the peribronchovascular distribution was more common among women (P = .08). In the other group (< 60 years), anterior distribution of opacities was significantly more common among men. Besides, almost all CT-scores were higher in men compared with women. Table 3 summarizes the significant and marginally significant differences in CT findings between men and women.
Table 3:
Significant/Marginally Significant CT Differences between Male and Female Patients on the Basis of Age
The best logistic regression model (χ2 = 76.592, P < .001) was developed by entering sex, age, underlying pulmonary disease, fever, dyspnea, and the total CT-score as input variables. The model explained 70.1% (Nagelkerke R2) of the variance in prognosis and correctly classified 85.4% of cases. The area under the ROC curve (AUC) for the model was 0.94 (95% CI: 0.89, 0.98). Considering the significant differences of CT-scores between men and women in patients younger than 60, ROC curves were plotted to determine the performance of total CT-score in predicting the patients’ prognosis (Fig 4). On the basis of the ROC curves, total CT-score has an AUC of 0.96 (95% CI: 0.88, 1.00] in predicting the prognosis of female patients and an AUC of 0.73 (95% CI: 0.57, 0.89) in predicting the prognosis of male patients. In men, the total CT-score of 10.5 was the best cut-off for prediction of patients’ prognosis (sensitivity, 91.7%; specificity, 59.3%), while in women, the best cut-off was 14.5 (sensitivity, 100%; specificity, 91.9%).
Figure 4a:
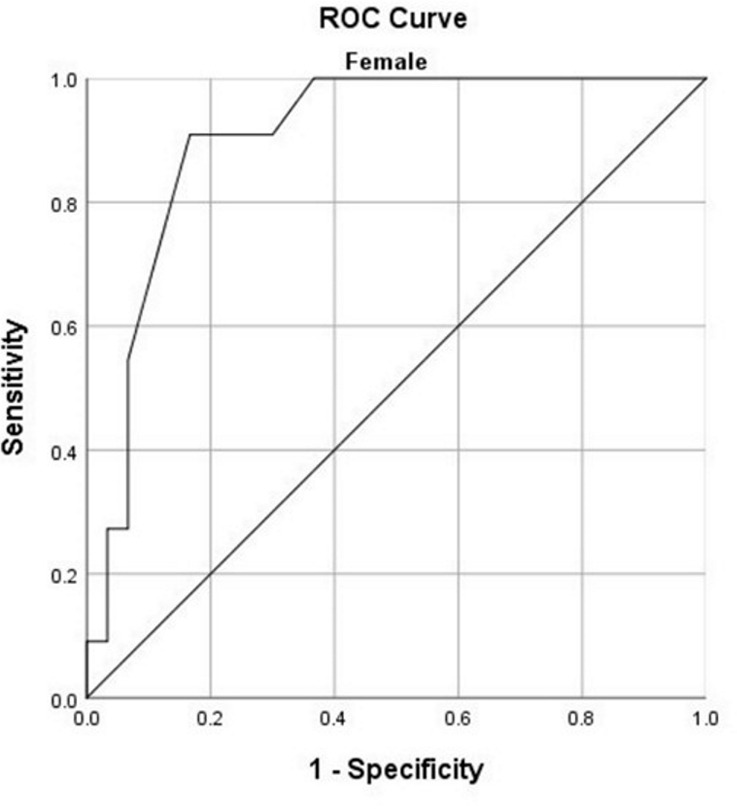
Receiver operating characteristic (ROC) curves for predicting the prognosis based on total CT-score for (a) women younger than 60 years and (b) men younger than 60 years.
Figure 4b:
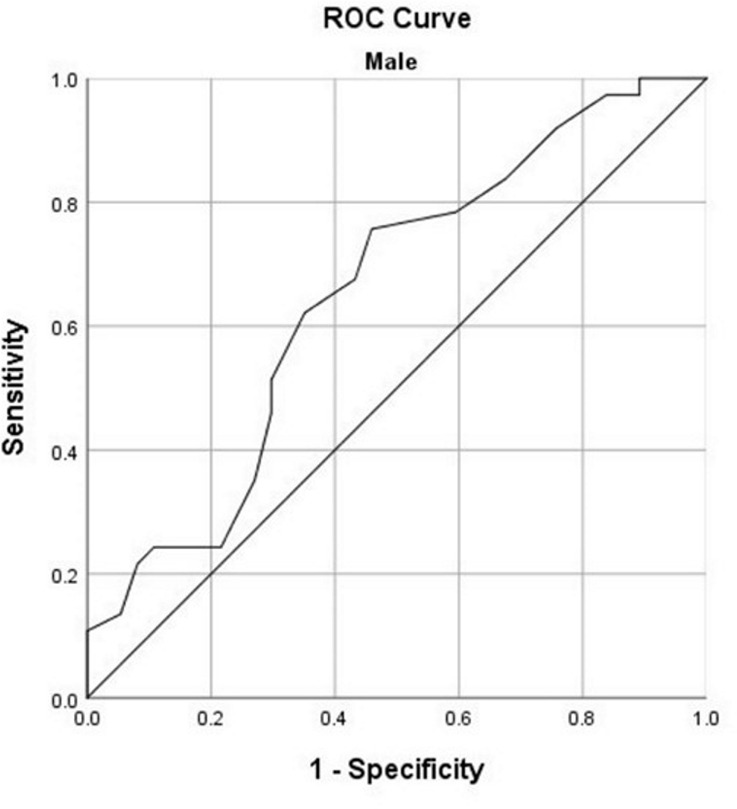
Receiver operating characteristic (ROC) curves for predicting the prognosis based on total CT-score for (a) women younger than 60 years and (b) men younger than 60 years.
Discussion
Sex, as an essential contributing factor to the prognosis of COVID-19 patients, has been understudied, and several genetic as well as societal factors need more attention in this regard. So far, different reports have indicated equal numbers of men and women with COVID-19 (5,9,10); however, in contrast to the expected vulnerability of women in outbreaks, the death toll has impacted men more frequently (11). The primary reasons for this observed fact seem to stem from genetic, immunologic, and also social differences between men and women (6). It has been proposed that due to the location of the angiotensin-converting enzyme 2 (ACE2) gene on the X chromosome, and subsequent higher expression of this gene in men, they are more susceptible to virus SARS-CoV-2 infection (12). Moreover, smoking is also associated with higher ACE2 receptor expression, and considering the sex-related patterns of smoking, men are again more susceptible to the virus entry (13). In a retrospective study on critically ill COVID-19 patients in Wuhan, China, the number of admitted men to the intensive care setting was twice that of women (10). Besides, in the pediatric population, the few studies surveying epidemiologic features indicate a male to female ratio of about 1:3 (14–16). In a recent study by Jin et al, male sex was reported to be more susceptible to higher severity and mortality independent of age in SARS-CoV and SARS-CoV-2 (12). Another study on clinical manifestations of refractory COVID-19 patients indicated that male sex and an initial presentation with anorexia and no fever predicted a poorer prognosis (17).
Men constituted the majority of this study’s population (74 men vs 41 women). The participants were enrolled consecutively, so the higher frequency of men with COVID-19 in this study could be due to the fact that they are more symptomatic or susceptible to COVID-19 pneumonia, and as a result, they look for treatment and hospital care more frequently. The limited number of cases during the short period of the study could be another reason for this disparity. Furthermore, our study results showed a statistically significant male preponderance in the unfavorable prognosis group.
Different studies have validated the role of chest CT in COVID-19 management. CT has been proposed as a remarkable method for diagnosis and determining disease severity besides other clinical and laboratory findings (18–20). In the present study, multiple CT patterns and specific characteristics of COVID-19 pneumonia lesions were analyzed. None of the CT findings were significantly different between the two sexes, except for the peripheral distribution of opacities, which was more common in men. However, when we adjusted the data considering an age cutoff of 60 years, notable differences were observed. In patients younger than 60 years, men had a higher overall CT-score and more commonly showed anterior distribution of pulmonary opacities in comparison with women. In patients older than 60 years, men showed a significantly more frequent number of peripherally distributed lesions, while women showed a tendency to have peribronchovascular lesions more frequently.
As it is apparent in Table 2, women younger than 60 years have a significantly lower CT-score (7.5 ± 6.8) compared with the mean CT-score of all the participants (ie, 11 ± 6). An explanation for the lower CT-scores in women younger than 60 years might reside in the previously reported immunoprotected mechanisms of estrogen (21) through activation of estrogen receptor α and subsequent decrease in viral genome transcription and increased immune clearance, versus the opposite effect of androgens via androgen receptor signaling in viral infections (22). Moreover, our study has shown that the use of severity CT-scores could predict short-term prognosis in both men and women younger than 60 years, especially in the latter group, with high sensitivity and specificity.
This study was not without limitations. First, this was a relatively small convenience sample with limited representation of the four subgroups of patients based on age and sex. Second, the follow-up time was relatively short, and the imaging assessment was solely based on the CT scan obtained on presentation. Third, some laboratory and clinical data (eg, smoking history and treatment regimens) could not be reliably retrieved from the medical chart.
Overall, we found no significant differences in chest CT involvement patterns between men and women. Our results showed that men with COVID-19 more frequently had unfavorable prognosis compared with women and that women younger than 60 years had a significantly lower CT-score. However, a CT-score of 14.5 or more in women younger than 60 could indicate an unfavorable prognosis (ICU admission or death) with high sensitivity and specificity.
Acknowledgments
The authors would like to thank all health care workers who risk their lives for the treatment of COVID-19 patients, radiology assistants, and nurses working in Imam Khomeini Hospital Complex, Amiralam Hospital, and Yas Women’s Hospital for their contributions in the conduct of this research.
Disclosures of Conflicts of Interest: B.M. disclosed no relevant relationships. H.G. disclosed no relevant relationships. M.A.K. disclosed no relevant relationships. M.G. disclosed no relevant relationships. H.H. disclosed no relevant relationships. F.D.T. disclosed no relevant relationships. M.C. disclosed no relevant relationships. P.R. disclosed no relevant relationships. K.K. disclosed no relevant relationships.
Abbreviations:
- ACE2
- angiotensin-converting enzyme 2
- AUC
- area under the ROC curve
- COVID-19
- coronavirus disease 2019
- CT-score
- severity score calculated according to extension of pulmonary opacities
- ICU
- intensive care unit
- RT-PCR
- reverse-transcription polymerase chain reaction
- ROC
- receiver operating characteristic
- SARS-CoV-2
- severe acute respiratory syndrome coronavirus 2
References
- 1.World Health Organization . Coronavirus disease (COVID-19) Situation Report – 133. https://www.who.int/docs/default-source/coronaviruse/situation-reports/20200601-covid-19-sitrep-133.pdf?sfvrsn = 9a56f2ac_4. Accessed June 2, 2020.
- 2.Ai T, Yang Z, Hou H, et al. Correlation of Chest CT and RT-PCR Testing in Coronavirus Disease 2019 (COVID-19) in China: A Report of 1014 Cases. Radiology 2020. 10.1148/radiol.2020200642. Published online February 26, 2020. [DOI] [PMC free article] [PubMed] [Google Scholar]
- 3.Fang Y, Zhang H, Xie J, et al. Sensitivity of Chest CT for COVID-19: Comparison to RT-PCR. Radiology 2020. 10.1148/radiol.2020200432. Published online February 19, 2020. [DOI] [PMC free article] [PubMed] [Google Scholar]
- 4.Simpson S, Kay FU, Abbara S, et al. Radiological Society of North America Expert Consensus Statement on Reporting Chest CT Findings Related to COVID-19. Endorsed by the Society of Thoracic Radiology, the American College of Radiology, and RSNA - Secondary Publication. J Thorac Imaging 2020;35(4):219–227. [DOI] [PMC free article] [PubMed] [Google Scholar]
- 5.Epidemiology Working Group for NCIP Epidemic Response, Chinese Center for Disease Control and Prevention . The epidemiological characteristics of an outbreak of 2019 novel coronavirus diseases (COVID-19) in China [in Chinese]. Zhonghua Liu Xing Bing Xue Za Zhi 2020;41(2):145–151. [DOI] [PubMed] [Google Scholar]
- 6.Wenham C, Smith J, Morgan R; Gender and COVID-19 Working Group. COVID-19: the gendered impacts of the outbreak. Lancet 2020;395(10227):846–848. [DOI] [PMC free article] [PubMed] [Google Scholar]
- 7.Hansell DM, Bankier AA, MacMahon H, McLoud TC, Müller NL, Remy J. Fleischner Society: glossary of terms for thoracic imaging. Radiology 2008;246(3):697–722. [DOI] [PubMed] [Google Scholar]
- 8.Pan F, Ye T, Sun P, et al. Time Course of Lung Changes at Chest CT During Recovery From Coronavirus Disease 2019 (COVID-19). Radiology 2020;295(3):715–721. [DOI] [PMC free article] [PubMed] [Google Scholar]
- 9.Wang L, Wang Y, Ye D, Liu Q. Review of the 2019 novel coronavirus (SARS-CoV-2) based on current evidence. Int J Antimicrob Agents 2020;55(6):105948. [DOI] [PMC free article] [PubMed] [Google Scholar]
- 10.Xu B, Gutierrez B, Mekaru S, et al. Epidemiological data from the COVID-19 outbreak, real-time case information. Sci Data 2020;7(1):106. [DOI] [PMC free article] [PubMed] [Google Scholar]
- 11.Yang X, Yu Y, Xu J, et al. Clinical course and outcomes of critically ill patients with SARS-CoV-2 pneumonia in Wuhan, China: a single-centered, retrospective, observational study. Lancet Respir Med 2020;8(5):475–481 [Published correction appears in Lancet Respir Med 2020;8(4):e26.]. [DOI] [PMC free article] [PubMed] [Google Scholar]
- 12.Jin JM, Bai P, He W, et al. Gender differences in patients with COVID-19: Focus on severity and mortality. medRxiv. 10.1101/2020.02.23.20026864. Posted March 5, 2020. Accessed April 20, 2020. [DOI] [PMC free article] [PubMed]
- 13.Cai H. Sex difference and smoking predisposition in patients with COVID-19. Lancet Respir Med 2020;8(4):e20. [DOI] [PMC free article] [PubMed] [Google Scholar]
- 14.Zheng F, Liao C, Fan QH, et al. Clinical Characteristics of Children with Coronavirus Disease 2019 in Hubei, China. Curr Med Sci 2020;40(2):275–280. [DOI] [PMC free article] [PubMed] [Google Scholar]
- 15.Xia W, Shao J, Guo Y, Peng X, Li Z, Hu D. Clinical and CT features in pediatric patients with COVID-19 infection: Different points from adults. Pediatr Pulmonol 2020;55(5):1169–1174. [DOI] [PMC free article] [PubMed] [Google Scholar]
- 16.Dong Y, Mo X, Hu Y, et al. Epidemiology of COVID-19 Among Children in China. Pediatrics 2020;145(6):e20200702. [DOI] [PubMed] [Google Scholar]
- 17.Mo P, Xing Y, Xiao Y, et al. Clinical characteristics of refractory COVID-19 pneumonia in Wuhan, China. Clin Infect Dis 2020. 10.1093/cid/ciaa270. Published online March 16, 2020. Accessed April 17, 2020. [DOI] [PMC free article] [PubMed] [Google Scholar]
- 18.Yuan M, Yin W, Tao Z, Tan W, Hu Y. Association of radiologic findings with mortality of patients infected with 2019 novel coronavirus in Wuhan, China. PLoS One 2020;15(3):e0230548. [DOI] [PMC free article] [PubMed] [Google Scholar]
- 19.Li K, Wu J, Wu F, et al. The Clinical and Chest CT Features Associated With Severe and Critical COVID-19 Pneumonia. Invest Radiol 2020;55(6):327–331. [DOI] [PMC free article] [PubMed] [Google Scholar]
- 20.Zhao W, Zhong Z, Xie X, Yu Q, Liu J. Relation Between Chest CT Findings and Clinical Conditions of Coronavirus Disease (COVID-19) Pneumonia: A Multicenter Study. AJR Am J Roentgenol 2020;214(5):1072–1077. [DOI] [PubMed] [Google Scholar]
- 21.Oertelt-Prigione S. The influence of sex and gender on the immune response. Autoimmun Rev 2012;11(6-7):A479–A485. [DOI] [PubMed] [Google Scholar]
- 22.Wang SH, Chen PJ, Yeh SH. Gender disparity in chronic hepatitis B: Mechanisms of sex hormones. J Gastroenterol Hepatol 2015;30(8):1237–1245. [DOI] [PubMed] [Google Scholar]


