

Abstract
The purpose of this study was to assess the accuracy of absolute cerebral blood flow (CBF) measurements obtained by dynamic contrast-enhanced (DCE) near-infrared spectroscopy (NIRS) using indocyanine green as a perfusion contrast agent. For validation, CBF was measured independently using the MRI perfusion method arterial spin labeling (ASL). Data were acquired at two sites and under two flow conditions (normocapnia and hypercapnia). Depth sensitivity was enhanced using time-resolved detection, which was demonstrated in a separate set of experiments using a tourniquet to temporally impede scalp blood flow. A strong correlation between CBF measurements from ASL and DCE-NIRS was observed (slope = 0.99 ± 0.08, y-intercept = −1.7 ± 7.4 mL/100 g/min, and R2 = 0.88). Mean difference between the two techniques was 1.9 mL/100 g/min (95% confidence interval ranged from −15 to 19 mL/100g/min and the mean ASL CBF was 75.4 mL/100 g/min). Error analysis showed that structural information and baseline absorption coefficient were needed for optimal CBF reconstruction with DCE-NIRS. This study demonstrated that DCE-NIRS is sensitive to blood flow in the adult brain and can provide accurate CBF measurements with the appropriate modeling techniques.
Keywords: Arterial spin labeling, cerebral blood flow, near-infrared spectroscopy, brain imaging, brain trauma
Introduction
Monitoring cerebrovascular health is central to the management of critical-care patients because of the brain's reliance on cerebral blood flow (CBF) for a continuous supply of oxygen and nutrients.1 This reliance has been demonstrated in animal stroke models in which the severity of brain injury could be directly linked to the magnitude and duration of reduced CBF.2 Clinically, the importance of maintaining adequate CBF is well appreciated since delayed cerebral ischemia (DCI) is a major cause of secondary brain injury in patients under neurointensive care.3 This is perhaps best exemplified by subarachnoid hemorrhage (SAH), which is one of the most life-threatening acute neurological diseases. Even after an aneurysm is secured, DCI develops in one-third of patients within the first two weeks.4 The prevalence of DCI has led to treatments focused on maintaining adequate CBF such as ventricular drainage to alleviate intracranial pressure (ICP) and the use of pharmacological vasodilators (e.g. nimodipine).5
Cerebral perfusion is commonly assessed by dynamic contrast-enhanced (DCE) imaging using either computed tomography (CT) or magnetic resonance imaging (MRI).6 Unfortunately, transporting critical-care patients to imaging facilities is risky and complicated and thus, severely reduces the frequency of assessments.7 Transcranial Doppler provides bedside monitoring of blood velocity in large cerebral arteries. However, its accuracy is operator dependent, the signal cannot be found in 30% of patients, and velocity in the main arteries is an indirect measure of tissue perfusion.8 These limitations highlight the need to develop a minimally invasive method for assessing cerebral hemodynamics at the bedside.
Near-infrared spectroscopy (NIRS) is recognized as a promising method for bedside neuromonitoring, principally because tissue oxygenation can be inferred from the light-absorbing properties of hemoglobin. Cerebral hemodynamics can also be assessed using the light-absorbing dye indocyanine green (ICG) as an intravascular contrast agent, analogous to DCE CT and MRI. ICG is a relatively nontoxic dye that is used clinically as an optical marker of liver function, in ophthalmology and to identify tumor margins during surgery.9–11 Results of previous studies have shown that ICG doses typically administrated to animals and humans have no toxic effects on neuronal cells,12 and the most common side-effect is a possible allergic reaction.13 Therefore, adequate resuscitation facilities and properly trained personnel must be available when the dye is injected. Because of its high absorption properties, ICG can be used as a contrast agent for assessing CBF.14 Like all optical methods, however, the main limitation of adopting this technique in clinical practice arise due to signal contamination from light absorption in extracerebral tissues. Without correcting for this limitation, DCE-NIRS has been shown to underestimate CBF by more than 50%.15,16
One approach to enhance the depth sensitivity of reflectance measurements is time-resolved (TR) detection since late-arriving photons travel farther (i.e. deeper) and therefore have a higher probability of interrogating the brain. DCE-NIRS has been adapted to TR detection and used to detect perfusion deficiencies in patients with intracerebral hematoma, acute ischemic stroke and posttraumatic edema.17–21 In all of these studies, a time series of the distribution of times-of-flight (DTOF) of photons recorded after a bolus injection of ICG was characterized in terms of statistical moments (number of photons, N; mean time-of-flight, <t>; and variance, V), since higher moments are weighted towards late-arriving photons. The validity of this approach was supported by a study involving pigs with a scalp/skull layer comparable in thickness to adult humans.22 ICG kinetic curves based on <t > and V derived from probes placed on the scalp were similar in shape to those acquired directly on the brain. Quantification of CBF requires converting the time-varying absorption changes into an ICG concentration curve and applying the principles of indicator dilution.23 Good agreement between CBF measurements from DCE-NIRS and DCE CT was reported in an initial validation study involving pigs.24
Previous studies involving patients and animal models provide strong evidence that DCE-NIRS combined with depth-enhanced TR detection can measure CBF accurately in adult humans. The primary purpose of the present study was to derive a benchmark comparison of CBF in healthy participants measured by the MRI perfusion technique, arterial spin labeling (ASL), and the optical ICG-bolus technique based on TR NIRS.25 The study involved a series of experiments acquired at two sites (Western University and the University of Pennsylvania, UPenn). Under the Western protocol, TR-NIRS data were acquired while participants were in the MRI scanner to provide simultaneous measurements. Data were acquired at normocapnia and hypercapnia to determine if DCE-NIRS was sensitive to the expected CBF increase caused by the latter. In a separate experiment, the influence of scalp contamination was assessed by acquiring ICG curves with and without inflating a tourniquet placed around the head to cause transient scalp ischemia. For the UPenn protocol, DCE-NIRS and ASL data were collected sequentially at normocapnia. This enabled a series of injections with different amounts of ICG to be administered to investigate the relationship between the optical signal and the contrast agent dose. ASL was selected for this comparison study because it can measure CBF accurately in the healthy brain and is well suited to tracking perfusion changes caused by hypercapnia.26,27
Materials and methods
ASL validation experiment (Western protocol)
Ten healthy subjects (three females, seven males, aged 22 to 54 y, mean = 30 ± 11 y) with no history of any neurological or psychiatric disorders were recruited. Written informed consent was obtained from all participants and all protocols/procedures were approved by the Western University Health Sciences Research Ethics Board, which adheres to the guidelines of the Tri-Council Policy Statement (TCPS), Ethical Conduct for Research Involving Humans.
Experimental design
Experiments were performed using a 3T Biograph mMR scanner (Siemens Medical Systems, DE) using a 12-channel head coil. The head was immobilized with foam padding to minimize motion artifacts. The TR-NIRS optodes were held on a subject's forehead using a 3D-printed holder made of NinjaFlex© (NinjaTek, PA). MRI fiducial marks were placed on the holder to identify the location of the optodes on structural MRIs. A catheter was inserted into an arm vein for injecting ICG and a clip for dye densitometry attached to a finger to measure the arterial ICG concentration. A nonrebreathing facemask attached to a large non-diffusible gas reservoir bag (Hans Rudolph Inc., MO) was used to deliver an air/CO2 mixture (6% CO2, 21% O2, balance N2) to induce hypercapnia. A line connected to the mask recorded end-tidal partial pressure of CO2 (PETCO2) (Invivo Expression MR400, Invivo Corp., FL).
Simultaneous DCE-NIRS and ASL data sets were collected at baseline (i.e. normocapnia) and hypercapnia. For the baseline measurements, ASL data were acquired continuously while subjects breathed room air for 5 min and at the 3-minute mark, a bolus of ICG was rapidly injected in less than 2 s. Each bolus consisted of 2.4 mL solution of 25 mg of ICG dissolved in 10 mL of saline. Because of differences in weight across subjects (60 to 120 kg), the injected dose varied from 0.05 to 0.1 mg/kg. There was a delay of at least 15 min between the end of the baseline acquisition and the start of the hypercapnia protocol to allow for ICG clearance. The hypercapnia protocol consisted of 7 min of ASL acquisition starting with the subjects breathing room air. Hypercapnia was induced by switching to the air/CO2 mixture at the 2-min mark, which continued for the remaining 5 min. The second ICG bolus injection was administered 3 min after the start of CO2 inhalation to allow sufficient time for CBF to reach a new steady state.27 DTOFs were acquired continuously at a sampling frequency of 3 Hz and for a duration of 90 s to capture the cerebral kinetics of the dye. Concurrently, the time-varying arterial concentration of ICG was measured on the subject's finger by dye densitometry (DDG-2001, Nihon Kohden, JP).
MRI acquisition
Sagittal T1-weighted images were acquired using a 3D magnetization-prepared rapid gradient-echo (MPRAGE) sequence (repetition time (TR) = 2000 ms, echo time (TE) = 2.98 ms and inversion time (TI) = 900 ms, flip angle = 9°, field of view (FOV) = 256 × 256 mm, isotropic voxel size = 1.0 mm3). ASL images were acquired using a transverse 2D gradient-echo echo planar imaging (EPI) sequence (TR/TE = 3500/12 ms, FOV = 240 × 240 mm, 12 slices, voxel size = 3.8 × 3.8 × 6 mm, bandwidth = 2298 Hz/pixel). A pseudo-continuous labeling method was used with the labeling plane set 9 cm below the center of the imaging volume, a labeling duration of 1.5 s and a post-label delay of 1 s. A nonselective inversion pulse was applied during the post-label delay for background suppression. For CBF quantification, a proton density scan (M0) was acquired with the same sequence using a TR of 7 s and no labeling or background suppression pulses.
DCE NIRS
The TR-NIRS system was built in-house and is described in detail elsewhere.28 Picosecond pulses from a single laser emitting at λ = 803 nm were transmitted to the surface of the subject head using 8-m long fiber (φ = 200 μm, NA = 0.39, FT200UMT, Thorlabs, NJ). Diffusely reflected light was measured at source-detector separations (rSD) of 1 and 4 cm using an 8-m fiber at 1 cm (φ = 62.5 μm, NA = 0.275, GIF625, Thorlabs, NJ) and an 8-m fiber bundle at 4 cm (φ = 3.2 mm, NA = 0.25, Fiberoptics Technology, CT). The output of each was coupled to a hybrid photomultiplier tube (Hybrid 50, PicoQuant, Germany). The instrument response function (IRF) was measured according to Liebert et al.29
Scalp contamination experiments
Experiments were conducted on a subset of five participants from the validation experiments (one female, four males, mean age = 28 ± 4 y). Each experiment was performed in a dark room with the participant sitting in a reclining posture with the optodes positioned on the forehead at rSD = 1, 3, and 4 cm (φ = 3.6 mm, NA = 0.55, Fiberoptics Technology, CT). A pneumatic tourniquet was wrapped around the head just above the ears. It had a 10 cm slit positioned around the optode holder to avoid any pressure on the holder when inflated. Two sets of ICG data were acquired following the same DCE protocol outlined above, one prior to and the other after inflating the tourniquet to 200 mm·Hg. There was a delay of 20 min between injections to enable ICG clearance.
ASL validation experiment (UPenn protocol)
Seven healthy participants were studied (four females, three males, age = 26 ± 4 years). Written consent for all subjects was provided by legally authorized representatives, and all protocols/procedures were approved by the institutional review board at the University of Pennsylvania, which adheres to the guidelines of the Common Rule and the Food and Drug Administration's Institutional Review Board and human subject regulations.
Experimental design
Experiments were carried out in two steps: (1) A series of DCE NIRS data were first acquired with varying ICG bolus concentrations; (2) CBF imaging with ASL. Step one was performed in the MRI anteroom. An intravenous cannula was placed in the subject's arm for injecting ICG. The TR-NIRS optodes were secured above the frontoparietal cortex (marked with pens), and a customized DDG was secured to the subject's index finger to measure the arterial ICG concentration.20 A series of ICG boluses (0.02, 0.04, 0.08, and 0.16 mg/kg) were rapidly injected (<2 s), while the subject lied supine (note, the appropriate volume of a 2.5 mg/mL stock solution was injected to achieve the desired mg/kg dose). For each injection, the TR-NIRS and DDG data were acquired for 4 min (2 min prior and 2 min after injection); there was a delay of 5 min between injections.
After acquisition of the DCE-NIRS data sets, the subject was moved into the MRI scanner while remaining supine with fiducial markers on the forehead indicating the position of TR-NIRS probes. MRI experiments were performed using a 3T Siemens Prisma scanner (Siemens Medical Systems, DE) using a 64-channel Head/Neck coil.
MRI acquisition
High-resolution T1-weighted MPRAGE images were collected (TR = 1810 ms, TE = 3.51 ms, TI = 1100 ms, flip angle = 9°, bandwidth = 130 Hz/px, isotropic voxel size = 1 mm3, FOV = 192 × 256 mm2, 160 slices). Perfusion images were acquired with an unbalanced pCASL technique with a labeling time of 1.8 s and a post-labeling delay of 1.8 s. The position of the labeling plane was based on time-of-flight angiography.30 Data were acquired with 2-shot 3D spiral acquisition with TR = 4.5 s, TE = 10.19 ms, matrix = 64 × 64, 90% background suppression, isotropic voxel resolution of 3.75 mm3, flip angle = 90°, FOV = 240 mm, pixel bandwidth = 400 Hz/px. Two volumes of M0 images were acquired for CBF quantification.
DCE NIRS
Details regarding the TR-NIRS instrumentation and optical probe are described elsewhere.20 Briefly, a supercontinuum fiber laser (NKT Photonics Inc., New Jersey) was used to generate light pulses centred at 808 nm (78 MHz). Two hybrid photomultiplier tubes (Hybrid 50, PicoQuant, Germany) acquired light at rSD = 0.7 and 3.2 cm and at a sampling rate of 0.9 Hz. The instrument response function was measured shortly after the ASL scan.
ASL image analysis
Similar analyses of ASL data were performed at both sites using a combination of MATLAB (Mathworks Inc., MA), SPM8 or SPM12 (www.fil.ion.ucl.ac.uk), and FSL.27,31 ASL time series and M0 images were aligned to correct for head motion and subsequently coregistered to the structural image. A time series of perfusion-weighted (ΔM) images was generated by either surround subtraction (Western) or pairwise subtraction (UPenn). Mean CBF images were generated using the standard single-compartment flow model32 and by temporal averaging. For the UPenn data, averaging was performed using 25 label/control pairs. For the Western data, each time series was separated into baseline (60 pairs) and hypercapnia (26 pairs, acquired during the last 3 min of CO2 inhalation to provide time for CBF to reach steady state27). For the Western data, the resulting normocapnia and hypercapnia CBF images were smoothed using a Gaussian filter with a FWHM of 12 mm.
For comparison with the CBF measurements from DCE NIRS, masks of grey matter (GM), white matter (WM) and cerebrospinal fluid (CSF) were generated by segmenting the corresponding T1-weighted images. A GM mask was created by selecting only voxels with 80% or more GM content. The mask was applied to the CBF images to extract mean cortical CBF estimates from the two imaging slices closest to the location of the NIRS optodes.
DCE NIRS analysis
The same analysis approach was applied to data from both sites, which began by subtracting the background signal from each DTOF in a time series. The background signal was defined as the mean number of photons measured prior to the initial rise of the DTOF. Next the statistical moments (N, <t> and V) were calculated and the resulting times series smoothed with a 5-s moving average.33 CBF was calculated using only the <t> data measured at the long separation, i.e. <t>L. Using <t>L alone represents a compromise between the greater depth sensitivity provided by higher moment analysis versus the reduction in signal-to-noise with each successive moment.34,35 Moreover, the scalp contamination experiments demonstrated that <t> at rSD ≥ 3 cm was insensitive to scalp blood flow (see Results).
Determining CBF required converting the time-varying change in <t>L caused by the passage of ICG through the cerebral microvasculature, Δ<t>L(T), into the corresponding change in the brain absorption coefficient, Δμa,B(T), where T refers to the time scale of the ICG experiment.17 A two-layer model of the head was used that was composed of a semi-infinite bottom layer representing the brain with absorption and reduced scattering coefficients, μa,B and μs,B′, respectively, and an extracerebral top layer representing scalp and skull with thickness (dC) and optical coefficients denoted by μa,e and μs,e′. Each subject's structural MRI was used to measure dC, which was measured at the centre of the optical probe.
Typically the relationship between Δ<t>L and Δμa,B is assumed to be linear;17,24 however, our multi-dose experiments (see Results) indicated that this assumption is not valid for the absorption changes induced by the ICG boluses (i.e. boluses> 0.08 mg/kg) used in the CBF experiments. Accordingly, a third-order Taylor expansion of <t>L was used to relate Δ<t>L to Δμa,B(T). Assuming that Δ<t>L(T) was not affected by scalp absorption changes, the relationship is given by
| (1) |
where α, β, and γ coefficients are weighting factors that were calculated numerically by taking the appropriate derivative of the baseline <t> obtained from the photon diffusion equation for a two-layer medium36,37 (see Supplementary Material).
At this stage, the analysis of the data from the two sites deviated slightly. The 8-m long optical fibers required to collect DCE-NIRS and ASL data simultaneously at Western led to significantly broadened the IRF, making it difficult to obtain accurate subject-specific optical properties. At UPenn, shorter optical probes could be used since DCE-NIRS and ASL data were acquired sequentially, resulting in a narrower IRF. Consequently, αB, βB, and γB, where determined using baseline optical properties averaged across subjects under the Western protocol (μao = 0.17 cm−1 and μso′ = 8.0 cm−1), while individual μao and μso′ values were used under the UPenn protocol. The final step was to use the αB, βB and γB values to convert Δ<t>L(T) to Δμa,B(T) using equation (1).
To assess the sensitivity to the brain, the kinetics of the measured Δ<t>L were compared to that for the short separation (i.e. Δ<t>S). These two curves should appear different since scalp blood flow is expected to be lower than CBF. Specifically, the time-to-peak (TTP) of Δ<t>L and Δ<t>S data were computed, and any case wherein ǀTTPS-TTPL ǀ < 0.6 sec was excluded from further analysis. This criterion resulted in the exclusion of one subject from Western and one from UPenn.
For each subject, Δμa,B(T) was converted into cerebral tissue ICG concentration, CB(T), using the wavelength specific extinction coefficient,38 εICG(λ) (Western protocol: 803 nm, 0.186 OD/μM/cm; UPenn protocol: 808 nm, 0.190 OD/μM/cm). Because baseline ICG concentration is zero, CB(T) = εICG(λ)·Δμa,B(T).39
The final step was to determine CBF by indicator dilution theory
| (2) |
where * is the convolution operator and Ca(T) is the arterial ICG concentration curve measured by a DDG. R(T) represents the ICG brain concentration for an idealized bolus injection of unit concentration. Since R(T = 0) = 1 by definition, the initial height of CBF·R(T), determined by the deconvolution,23 equals CBF. Deconvolution was performed using the first 45 s of the ICG concentration curves as the first pass of the contrast agent provides the greatest sensitivity to blood flow.
Statistical analysis
All data are presented as mean ± standard deviation unless otherwise noted. Statistical significance was defined as p < 0.05. Linear regression analysis was performed on the CBF measurements from TR-NIRS and ASL to examine the correlation between the two techniques. Student's t-tests were used to assess if the regression slope and intercept were different from 1 and 0, respectively. Additionally, Bland–Altman analysis was conducted to access the similarity between the two sets of CBF measurements. A paired t-test was used to assess CBF differences between normo- and hypercapnia, and before and after inflating the head tourniquet (scalp contamination experiment).
Error analysis
Error analysis was conducted to investigate the sensitivity of the CBF estimates to changes in the input parameters (μao, μso′, and dC) used to generate the Taylor expansion coefficients. For this purpose, data sets from nine subjects were reanalyzed after varying each input parameter by −20% to 20% from its original value. The Taylor coefficients were recalculated for every incremental change in an individual input parameter and were subsequently used to convert measured Δ<t>L to Δμa,B (i.e. equation (1)), from which CBF was calculated via equation (2). The fractional difference between the CBF calculated for every incremental change and the original CBF value was computed.
Results
Scalp contamination experiment
Time-varying changes in the photon count (ΔN) and mean time-of-flight (Δ<t>) in response to IV injections of ICG are shown in Figure 1. These time courses were averaged across the five subjects who participated in this experiment. Data are presented for rSD = 1, 3, and 4 cm before and after inflating the tourniquet wrapped around the head. At all source-detector distances, the average ΔN time series exhibited noticeable differences before and after inflation. In contrast, differences were small between Δ<t> time series recorded at rSD = 3 and 4 cm pre and post tourniquet inflation, while noticeable difference was observed at rSD = 1 cm (see Figure 1 zoomed in view). However, the effects of the tourniquet on the time series recorded at rSD = 1 cm were smaller for Δ<t> compared to ΔN, which can likely be explained by differences in depth sensitivity. That is, Δ<t> at this distance is more sensitive to the skull than scalp, while the reverse is true for ΔN. CBF was determined for the Δ<t> time series acquired at rSD = 3 and 4 cm, and no significant difference was found between average values before and after inflating the tourniquet (i.e. 63 ± 14 and 66 ± 16 mL/100g/min, respectively at rSD = 3 cm, and 67 ± 6 and 68 ± 10 mL/100 g/min, respectively, at rSD=4 cm). These results indicate that Δ<t> acquired at rSD = 3 and 4 cm was insensitive to scalp flow.
Figure 1.

Change in the number of photons (top row) and mean time-of-flight (bottom row) plotted as a function of time following an intravenous bolus injection of ICG at time = 0 s. Time courses acquired at three source-detector distances (rSD = 1, 3, and 4 cm) are shown before (black) and after (red) inflating the tourniquet (see Scalp Contamination Experiments protocol in Methods). Each time series was averaged across five subjects, and the grey shadowing represents the standard deviation.
Time-of-flight measurements as a function of ICG doses
The maximum change in <t> at the long separation, Δ<t>L,max, is presented in Figure 2(a) as a function of ICG dose. Each data point was averaged over four participants who had good quality TR data at all four doses (three females, mean age = 25 ± 5 y). This figure demonstrates that the relation between Δ<t>L,max and ICG dose was not linear. This was confirmed by simulated data (Figure 2(b)) generated using the two-layer head model (i.e. equation (S3)) over a wide range of Δμa,B values (baseline optical properties: μao = 0.12 cm−1, μso = 11 cm−1, rSD = 3.2 cm, and dC = 1.4 cm).
Figure 2.

(a) Average Δ<t>L,max across four subjects (mean ± SD) plotted against ICG dose. The measurements deviate substantially from the expected linear relationship (red line) determined from the average Δ<t>L,max at the smallest dose (0.02 mg/kg), i.e. the line connecting the origin with Δ<t>L,max at 0.02 mg/kg. (b) Simulated Δ<t>L,max plotted against Δμa,Bmax from a two-layer head model (blue circles). The simulated Δ<t>L,max values was generated using equation (S3) with μao = 0.12 cm−1, μso = 11 cm−1, rSD = 3.2 cm, and dC = 1.4 cm. The reconstructed Δ<t>L,max obtained by Taylor expansion (black line, αB = −0.91, βB = 5.47, and γB = −29.92) agreed well with the simulated Δ<t>L,max, while the reconstructed Δ<t>L,max from a linear model (red line) was substantially lower.
Comparison of CBF measurements from DCE-NIRS and ASL
Axial CBF images acquired at normocapnia and hypercapnia for a representative subject under the Western protocol are shown in Figure 3. This imaging slice corresponded to the location of the NIRS optodes. Included in the figure are the arterial and tissue ICG concentration curves acquired simultaneously under the two capnic conditions.
Figure 3.

(a) Structural MR image showing the location of the fiducial markers. CBF images acquired from one subject at (b) normocapnia (mean grey matter CBF = 67 mL/100g/min, PETCO2 = 35.8 mmHg) and (c) hypercapnia (mean grey matter CBF = 112 ml/100g/min, PETCO2 = 43.5 mmHg). Corresponding brain (black) and arterial (red) ICG concentration curves are shown in the bottom row. For illustration purposes, the brain concentration curves were scaled by a factor of 20. Included in (d) and (e) are the derived CBF·R(T) function obtained by deconvolution. The grey shaded interval indicates the 45-second window used for the deconvolution. The CBF estimates from the ICG data were 76 and 106 mL/100g/min at normo- and hypercapnia, respectively.
Average normocapnic CBF measurements obtained by DCE-NIRS and ASL for the two sites are reported in Table 1. For the UPenn data, CBF was determined for each subject using the ICG dose with best signal-to-noise ratio for CB(T) and the data with minimum motion artifacts for Ca(T) (i.e. one subject at 0.04 mg/kg, three subjects at 0.08 mg/kg, one subject at 0.16 mg/kg). Table 1 also reports the average baseline tissue optical properties, the Taylor expansion coefficients, and the dC measurements from the anatomical MRIs.
Table 1.
Average baseline CBF, optical properties, Taylor expansion coefficients for the brain, and extracerebral layer thickness.
| CBF |
Parameters |
|||||||
|---|---|---|---|---|---|---|---|---|
| NIRS (mL/100 g/min) | ASL (mL/100 g/min) | μao (cm−1) | μso′ (cm−1) | αB (ns·cm) | βB (ns·cm2) | γB (ns·cm3) | dC (cm) | |
| UPenn | 65.8 ± 21.7 | 72.8 ± 10.2 | 0.12 ± 0.02 | 11.1 ± 0.8 | −0.9 ± 0.4 | 5.6 ± 2.2 | −29.8 ± 11.3 | 1.4 ± 0.2 |
| Western | 74.4 ± 13.6 | 76.1 ± 14.6 | 0.17 ± 0.04 | 8.0 ± 1.5 | −0.8 ± 0.1 | 3.8 ± 0.6 | −16.9 ± 2.4 | 1.5 ± 0.1 |
CBF: cerebral blood flow; NIRS: near-infrared spectroscopy; ASL: arterial spin labeling.
From the Western site, the average PETCO2 increased was 7.7 ± 1.8 mmHg due to inhaling 6% CO2. The average hypercapnic CBF measured by ASL and DCE-NIRS were 109 ± 21 and 107 ± 18 mL/100g/min, respectively. A significant increase in CBF caused by hypercapnia was measured by both techniques (p < 0.001).
Figure 4 shows the linear regression plot of CBF data from DCE-NIRS and ASL. This figure includes all data from both sites (nine from Western and five from UPenn). Each data point represents a CBF estimate from a single ICG injection. The regression slope was 0.99 ± 0.08 (±95% Confidence Interval = ±0.16), the square of the Pearson's correlation coefficient (R2) was 0.88, and the intercept was −1. ± 7.4 mL/100g/min. The slope was significantly different from the null (p < 0.001), but not from the line of identity. Similar results were obtained by analyzing the Western data separately (slope = 0.89 ± 0.06, y-intercept = 9.5 ± 6.0 mL/100g/min, and R2 = 0.92). Although the UPenn data does not have a sufficient sample size to perform regression analysis based on an alpha of 0.05 and a power of 0.8, the slope of the best-fit line to the UPenn data with intercept forced to zero is 0.93 ± 0.08, which is similar to the Western data (see Supplementary Material).
Figure 4.
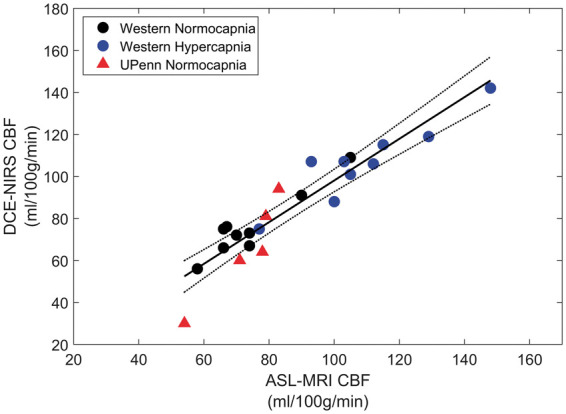
Regression plot comparing CBF values from DCE-NIRS and ASL. Dashed lines are 95% confidence intervals, and the solid line is the best-fit from linear regression (slope = 0.99 ± 0.08, intercept = −1.7 ± 7.4 mL/100g/min and R2 = 0.88).
The corresponding Bland–Altman plot comparing CBF measurements from the two techniques is shown in Figure 5. Again, the analysis was conducted by pooling data from both sites. The average difference between ASL and DCE-NIRS (1.9 mL/100g/min) was not significantly different from the (p = 0.32).
Figure 5.

Bland–Altman plot comparing CBF measurements from DCE-NIRS and ASL. Date were grouped by site as described in Figure 4. Mean difference between the two methods across data from both sites is indicated by the solid black line (1.9 mL/100 g/min), which was bound by a 95% confidence interval of −15 to 19 mL/100 g/min.
Error analysis
Figure 6 shows the results of the error analysis performed to investigate the sensitivity of CBF to changes in the input parameters (μao, μso′, and dC). Findings are presented for nine subjects under the Western protocol. The error in CBF due to varying μao by ± 20% ranged from −38 ± 9% to 50 ± 23% at baseline and from −37 ± 7% to 44 ± 14% at hypercapnia. A similar magnitude of error was caused by varying dC by ± 20%: −41 ± 10% to 61 ± 31% at baseline and −39 ± 6% to 54 ± 19% at hypercapnia. By contrast, the estimated CBF was rather insensitive to changes in μso′ under both flow conditions.
Figure 6.

Predicted error in estimated CBF due to the use of erroneous input parameters used to generate the Taylor expansion coefficients. The mean error values and standard deviation across subjects data at baseline (left column) and hypercapnia (right column) are presented.
Discussion
The two main outcomes of this study were to show that DCE-NIRS can accurately measure cortical blood flow in the adult human brain and that the technique is sensitive to changes in CBF. These outcomes were demonstrated by comparison to CBF measurements obtained with ASL at normocapnia (Western and UPenn protocols) and hypercapnia (Western protocol) in healthy adults. The results of the regression analysis showed a strong correlation (slope = 0.99 and R2 = 0.88) between CBF values from DCE-NIRS and ASL-MRI over a range from 50 to 150 mL/100g/min (Figure 4). This good agreement was confirmed by the Bland–Altman analysis, which revealed a nonsignificant bias between the two methods of approximately 2 mL/100g/min (Figure 5). This sensitivity to CBF benefited from two major factors: using TR detection to enhance depth sensitivity and using a two-layer tissue head model to estimate the signal contribution from the brain.
Enhanced depth sensitivity with TR detection
Enhanced depth sensitivity by using the mean time-of-flight instead of the total photon count was demonstrated in the tourniquet experiments (Figure 1). Unlike the total photon count, the mean time-of-flight for rSD ≥ 3 cm showed little sensitivity to the passage of ICG through the scalp. Only at the shortest separation (rSD = 1 cm), which will have the greatest sensitivity to scalp blood flow, did Δ<t> exhibit changes due to inflating the tourniquet. By contrast, large differences in the ΔN time series at all three rSD values were evident before and after tourniquet inflation. This finding confirms the predictions of sensitivity analysis and is in agreement with animal studies showing the similarity between ICG time courses from optodes placed directly on the brain to those obtained on the scalp through the analysis of higher moments.17,19,22 In addition, DCE-NIRS simulation based on input parameters reflecting a healthy adult receiving a 0.1 mg/kg ICG bolus (e.g. CBF = 60 mL/100g/min, a cerebral-to-scalp blood flow ratio of 6, dC = 1.4 cm) predicted that neglecting the extra-cerebral terms resulted in a 15% underestimation in retrieved CBF (see Supplementary Material). This prediction is moderately higher than observed in the scalp contamination experiments, which is likely due to discrepancies between the input parameters used in the simulation versus the hemodynamic and optical properties of a head.
Accurate estimation of <t> sensitivity to brain
In addition to improving depth sensitivity, the second critical factor for measuring CBF was estimating the signal contribution from the brain. Since the adult head cannot be modeled accurately as a semi-infinite medium, determining CBF required accurately modeling the change in light absorption in the brain. For this purpose, a two-layer model was used to generate the sensitivity factors needed to convert an optical signal change to Δμa,B.17,23 Generally, linear sensitivity factors are used for this step; however, this approach was not valid for these experiments. The observed nonlinearity of Δ<t>L with respect to ICG concentration diminished the expected signal change predicted by a linear relationship (Figure 2). To address this issue, a third-order Taylor expansion of <t>L was employed to accurately model the relationship between Δ<t>L and Δμa,B.
Alternatively, nonlinear modeling could be avoided by limiting the ICG dose—albeit at the cost of reducing contrast to noise ratio—or by deriving CB(T) from the change in the number of photons (N). However, using N/N0 comes at the cost of reduced depth sensitivity and substantially greater scalp contamination. A scalp component could in principle be included in the modeling, but inclusion will add complexity since the accuracy of a CBF estimate will depend on properly characterizing sensitivity functions for both scalp and brain layers.
The key simplification enabled by the depth sensitivity of <t>L was neglecting extra-cerebral terms in equation (1). Experimental results (Figure 1) and simulations (Supplementary Material) suggest this simplification is likely reasonable at long source-detector separations. However, further work is needed to investigate the validity of this approach in patient populations with lower CBF since the cerebral-to-scalp blood flow ratio will be reduced. We recommend that DCE data should continue to be collected at two distances in order to assess if the single long-distance approach remains valid or if the analysis has to be modified to incorporate scalp contributions.
For further studies, practical issues should be considered regarding the selected ICG dose. Selection must provide sufficient signal contrast for both NIRS and dye densitometry. In our experience, doses below 0.04 mg/kg generally resulted in poor quality arterial input functions measured by the DDG. In addition, the selected dose should not be too large in order to minimize the nonlinearity effect shown in Figure 2(a). Based on these considerations, the optimal dose is likely between 0.05 to 0.08 mg/kg.
Finally, despite the general agreement between DCE-NIRS and ASL, our error analysis demonstrated that the accuracy of the CBF estimates was highly dependent on the input parameters μao, and dC used to generate the sensitivity factors (Figure 6). The sensitivity to dC is perhaps not unsurprising considering that accurately estimating Δμa,B(T) requires separating light propagation through the extracerebral and cerebral layers of the head. For this study, dC was measured from each subject's structural MRI. With respect to clinical translation, a priori anatomical measurements should be available because patients with neurological emergencies will typically undergo either a CT or MRI. It should be possible to measure dC directly by ultrasound, which would facilitate a stand-alone approach.40
The sensitivity of the method to μao indicates that it is desirable to measure the baseline optical properties accurately. In the Western protocol, the patient-averaged μao and μso′ values were used because of large inter-subject variability. This limitation can be attributed to the relatively wide IRF (800 ± 115 ps) due to the 8-m fibers required for simultaneous MRI/NIRS. Since the IRF was comparable to the temporal width of the measured DTOFs (1000 ± 173 ps), the fitting routines used to derive μao and μso′ were sensitive to small errors in the measured IRF and DTOF. Despite this limitation, the good agreement between CBF values from NIRS and ASL (slope = 0.89 ± 0.06, y-intercept = 9.5 ± 6.0 mL/100g/min, and R2 = 0.92) indicates that the inter-subject variability in μao was comparatively small. The average optical properties were also in good agreement with a previous study that measured μao (0.176 ± 0.002 cm−1) and μso′ (7.5 ± 0.1 cm−1) at 803 nm in newborn piglets.39
The IRF under the UPenn protocol was less than 200 ps due to the use of a supercontinuum laser and shorter fibers. Consequently, individual optical properties were measured and used in the analysis. In general, the variability between individual μao values was small; however, μao for one participant (0.09 cm−1) was 30% lower than the group average. The NIRS CBF estimate for this participant was also 40% lower than from ASL (33 versus 54 mL/100g/min), suggesting that an error in μao may have contributed to the underestimation of CBF.
The sensitivity of the method to μao could present a challenge to future clinical studies if factors such as head injury caused significant changes in baseline optical properties. Consequently, accurately accurate measurement of the optical properties of each individual will be important, which will require robust and accurate measurement of optical properties by TR NIRS in clinical settings. Future work is also needed to characterize errors arising from the use of the same baseline optical properties for brain and the superficial tissue layer in the two-layer head model, and thus to ascertain whether more complex head models beyond two-layer are needed in clinical patient populations.
Confirming adequate depth sensitivity to the brain
Another concern with the current study was the lack of sensitivity to CBF found in two subjects, one from Western and the other from UPenn. These data sets were excluded because the ICG concentration curves recorded at the longer rSD value (3.2 or 4 cm) were very similar to those recorded at shorter rSD value (0.7 or 1 cm), thereby suggesting a lack of sensitivity to the faster kinetics of blood flow in the brain relative to scalp tissue. For the subject in the Western protocol, this lack of depth sensitivity was attributed to poor probe contact on the skin, as it was sometimes challenging to ensure the probes stayed in position once the subject was moved into the MRI scanner. A similar problem may have contributed to the subject's data acquired under the UPenn protocol, although the experimental setup was simpler. Alternately, the lack of sensitivity suggests that it would be advantageous to use a larger source-detector separation (e.g. 4 cm), higher order DTOF moments,42,43 or gated detection to capture late-arriving photons44,45 and thereby increase the sensitivity to the brain.
Other DCE-NIRS applications
While quantitative, DCE-NIRS is not conducive to continuous monitoring since it requires a bolus injection of ICG. This limitation can be overcome by combining it with diffuse correlation spectroscopy (DCS). In this scheme a single CBF measurement from DCE-NIRS is used to calibrate relative flow data from DCS.46 This approach can be extended to longitudinal monitoring by generating a calibration curve between CBF and the blood flow index measured by DCS.20,47 However, measuring an absolute blood flow index with DCS also requires measuring μa and μs′, and some method to account for scalp blood flow, such as acquiring multi-distance DCS data.48,49
DCE-NIRS can also be used to measure blood–brain barrier permeability and oxidative metabolism when combined with tissue oxygenation data.28,50 Adapting these approaches to adult patients will require careful assessment. Measuring permeability is dependent on ICG clearance, which may be more prone to scalp contamination since ICG is likely to leak into scalp tissue due to the lack of tight conjunctions between endothelium cells. Likewise, tissue oxygenation requires measuring absolute μa,B at multiple wavelengths. Subtraction TR-NIRS, which uses higher moment analysis of DTOFs collected at multiple source-detector distances to enhance depth sensitivity, is one approach that may be promising for isolating μa,B.42,43 Finally, it should be noted that an alternative to TR NIRS would be the frequency-domain NIRS since the measured phase change is directly proportional to the mean time-of-flight.51,52
Conclusion
In summary, this is the first study to show that DCE NIRS, i.e. NIRS combined with depth-sensitive detection, can quantify CBF in healthy adults. The good agreement, when compared to CBF measurements from ASL, suggests this method could provide quantitative CBF data at the bedside of critically ill patients. Further studies involving relevant patient populations are needed to verify that DCE-NIRS can detect cerebral perfusion deficiencies.
Supplemental Material
Supplemental Material for Quantification of cerebral blood flow in adults by contrast-enhanced near-infrared spectroscopy: Validation against MRI by Daniel Milej, Lian He, Androu Abdalmalak, Wesley B Baker, Udunna C Anazodo, Mamadou Diop, Sudipto Dolui, Venkaiah C Kavuri, William Pavlosky, Lin Wang, Ramani Balu, John A Detre, Olivia Amendolia, Francis Quattrone, W Andrew Kofke, Arjun G Yodh and Keith St Lawrence in Journal of Cerebral Blood Flow & Metabolism
Funding
The author(s) disclosed receipt of the following financial support for the research, authorship, and/or publication of this article: This work was funded through grants from the Canadian Institutes of Health Research (130391) and the National Institutes of Neurological Disorders and Stroke (R01-NS082309-01A1, R01-NS060653, P41-EB015893). Dr. Milej was supported by a postdoctoral fellowship (MFE-146770) from the Canadian Institutes of Health Research.
Declaration of conflicting interests
The author(s) declared no potential conflicts of interest with respect to the research, authorship, and/or publication of this article.
Authors’ contribution
DM, LH, WB, MD, RB, WK, JD, AY, and KStL contributed to the conception and design of the study. DM, LH, AA, WB, UA, LW, VK, WP, OA, FQ, RB, and WK contributed to the acquisition of data. DM and LH with input from WB, KStL, and AY carried out the primary optical data analysis; DM, SD performed ASL data analysis with input from UA, KStL, and JD. DM and LH wrote the article with input from all other authors; WB, AY, and KStL contributed to revising the article critically for important intellectual content. All authors have approved the final version of the article for publication.
Supplemental material
Supplemental material for this paper can be found at the journal website: http://journals.sagepub.com/home/jcb
References
- 1.Helmy A, Vizcaychipi M, Gupta AK. Traumatic brain injury: intensive care management. Br J Anaesth 2007; 99: 32–42. [DOI] [PubMed] [Google Scholar]
- 2.Jones TH, Morawetz RB, Crowell RM, et al. Thresholds of focal cerebral ischemia in awake monkeys. J Neurosurg 1981; 54: 773–782. [DOI] [PubMed] [Google Scholar]
- 3.Wartenberg KE. Critical care of poor-grade subarachnoid hemorrhage. Curr Opin Crit Care 2011; 17: 85–93. [DOI] [PubMed] [Google Scholar]
- 4.Al-Tamimi YZ, Orsi NM, Quinn AC, et al. A review of delayed ischemic neurologic deficit following aneurysmal subarachnoid hemorrhage: historical overview, current treatment, and Pathophysiology. World Neurosurg 2010; 73: 654–667. [DOI] [PubMed] [Google Scholar]
- 5.Budohoski KP, Guilfoyle M, Helmy A, et al. The pathophysiology and treatment of delayed cerebral ischaemia following subarachnoid haemorrhage. J Neurol Neurosurg Psychiatry 2014; 85: 1343–1353. [DOI] [PubMed] [Google Scholar]
- 6.Wintermark M, Sesay M, Barbier E, et al. Comparative overview of brain perfusion imaging techniques. Stroke 2005; 36: e83–e99. [DOI] [PubMed] [Google Scholar]
- 7.Gallagher CN, Hutchinson PJ, Pickard JD. Neuroimaging in trauma. Curr Opin Neurol 2007; 20: 403–409. [DOI] [PubMed] [Google Scholar]
- 8.Wright WL. Multimodal monitoring in the ICU: when could it be useful?. J Neurol Sci 2007; 261: 10–15. [DOI] [PubMed] [Google Scholar]
- 9.Desmettre T, Devoisselle JM, Mordon S. Fluorescence properties and metabolic features of indocyanine green (ICG) as related to angiography. Surv Ophthalmol 2000; 45: 15–27. [DOI] [PubMed] [Google Scholar]
- 10.De Gasperi A, Mazza E, Prosperi M. Indocyanine green kinetics to assess liver function: ready for a clinical dynamic assessment in major liver surgery?. World J Hepatol 2016; 8: 355–367. [DOI] [PMC free article] [PubMed] [Google Scholar]
- 11.Hill TK, Mohs AM. Image-guided tumor surgery: will there be a role for fluorescent nanoparticles?. Wiley Interdiscip Rev Nanomed Nanobiotechnol 2016; 8: 498–511. [DOI] [PMC free article] [PubMed] [Google Scholar]
- 12.Toczylowska B, Zieminska E, Goch G, et al. Neurotoxic effects of indocyanine green -cerebellar granule cell culture viability study. Biomed Opt Express 2014; 5: 800. [DOI] [PMC free article] [PubMed]
- 13.Hope-Ross M, Yannuzzi LA, Gragoudas ES, et al. Adverse reactions due to indocyanine green. Ophthalmology 1994; 101: 529–533. [DOI] [PubMed] [Google Scholar]
- 14.Keller E, Nadler A, Alkadhi H, et al. Noninvasive measurement of regional cerebral blood flow and regional cerebral blood volume by near-infrared spectroscopy and indocyanine green dye dilution. Neuroimage 2003; 20: 828–839. [DOI] [PubMed] [Google Scholar]
- 15.Gora F, Shinde S, Elwell CE, et al. Noninvasive measurement of cerebral blood flow in adults using near-infrared spectroscopy and indocyanine green: a pilot study. J Neurosurg Anesthesiol 2002; 14: 218–222. [DOI] [PubMed] [Google Scholar]
- 16.Schytz HW, Wienecke T, Jensen LT, et al. Changes in cerebral blood flow after acetazolamide: an experimental study comparing near-infrared spectroscopy and SPECT. Eur J Neurol 2009; 16: 461–467. [DOI] [PMC free article] [PubMed] [Google Scholar]
- 17.Liebert A, Wabnitz H, Steinbrink J, et al. Time-resolved multidistance near-infrared spectroscopy of the adult head: intracerebral and extracerebral absorption changes from moments of distribution of times of flight of photons. Appl Opt 2004; 43: 3037–3047. [DOI] [PubMed] [Google Scholar]
- 18.Weigl W, Milej D, Gerega A, et al. Assessment of cerebral perfusion in post-traumatic brain injury patients with the use of ICG-bolus tracking method. Neuroimage 2014; 85: 555–565. [DOI] [PubMed] [Google Scholar]
- 19.Liebert A, Wabnitz H, Steinbrink J, et al. Bed-side assessment of cerebral perfusion in stroke patients based on optical monitoring of a dye bolus by time-resolved diffuse reflectance. Neuroimage 2005; 24: 426–435. [DOI] [PubMed] [Google Scholar]
- 20.He L, Baker WB, Milej D, et al. Noninvasive continuous optical monitoring of absolute cerebral blood flow in critically ill adults. Neurophotonics 2018; 5: 1. [DOI] [PMC free article] [PubMed] [Google Scholar]
- 21.Steinkellner O, Gruber C, Wabnitz H, et al. Optical bedside monitoring of cerebral perfusion: technological and methodological advances applied in a study on acute ischemic stroke. J Biomed Opt 2010; 15: 061708. [DOI] [PubMed] [Google Scholar]
- 22.Elliott JT, Milej D, Gerega A, et al. Variance of time-of-flight distribution is sensitive to cerebral blood flow as demonstrated by ICG bolus-tracking measurements in adult pigs. Biomed Opt Express 2013; 4: 206. [DOI] [PMC free article] [PubMed] [Google Scholar]
- 23.St Lawrence K, Verdecchia K, Elliott J, et al. Measuring cerebral hemodynamics and energy metabolism by Near-Infrared spectroscopy. Neuromethods 2014; 90: 265–292. [Google Scholar]
- 24.Elliott JT, Diop M, Morrison LB, et al. Quantifying cerebral blood flow in an adult pig ischemia model by a depth-resolved dynamic contrast-enhanced optical method. Neuroimage 2014; 94: 303–311. [DOI] [PubMed] [Google Scholar]
- 25.Detre JA, Rao H, Wang DJJ, et al. Applications of arterial spin labeled MRI in the brain. J Magn Reson Imag 2012; 35: 1026–1037. [DOI] [PMC free article] [PubMed] [Google Scholar]
- 26.Fan AP, Jahanian H, Holdsworth SJ, et al. Comparison of cerebral blood flow measurement with [15 O]-water positron emission tomography and arterial spin labeling magnetic resonance imaging: a systematic review. J Cereb Blood Flow Metab 2016; 36: 842–861. [DOI] [PMC free article] [PubMed] [Google Scholar]
- 27.Anazodo UC, Shoemaker JK, Suskin N, et al. Impaired cerebrovascular function in coronary artery disease patients and recovery following cardiac rehabilitation. Front Aging Neurosci 2016; 7: 224. [DOI] [PMC free article] [PubMed] [Google Scholar]
- 28.Milej D, Abdalmalak A, Desjardins L, et al. Quantification of blood-brain barrier permeability by dynamic contrast-enhanced NIRS. Sci Rep 2017; 7: 1702. [DOI] [PMC free article] [PubMed] [Google Scholar]
- 29.Liebert A, Wabnitz H, Grosenick D, et al. Fiber dispersion in time domain measurements compromising the accuracy of determination of optical properties of strongly scattering media. J Biomed Opt 2003; 8: 512–516. [DOI] [PubMed] [Google Scholar]
- 30.Vidorreta M, Zhao L, Shankar S, et al. In-vivo evaluation of pCASL labeling scheme and position. In: Proceedings of the international society of magnetic resonance in medicine, Honolulu, HI, USA, 2017, p. 3618.
- 31.Jenkinson M, Beckmann CF, Behrens TE, et al. Fsl. Neuroimage. Epub ahead of print 2012. DOI: 10.1016/j.neuroimage.2011.09.015. [DOI] [PubMed] [Google Scholar]
- 32.Alsop DC, Detre JA, Golay X, et al. Recommended implementation of arterial spin-labeled perfusion MRI for clinical applications: a consensus of the ISMRM perfusion study group and the European consortium for ASL in dementia. Magn Reson Med 2015; 73: 102–116. [DOI] [PMC free article] [PubMed] [Google Scholar]
- 33.Liebert A, Wabnitz H, Grosenick D, et al. Evaluation of optical properties of highly scattering media by moments of distributions of times of flight of photons. Appl Opt 2003; 42: 5785–5792. [DOI] [PubMed] [Google Scholar]
- 34.Milej D, Janusek D, Gerega A, et al. Optimization of the method for assessment of brain perfusion in humans using contrast-enhanced reflectometry: multidistance time-resolved measurements. J Biomed Opt 2015; 20: 106013. [DOI] [PubMed] [Google Scholar]
- 35.Abdalmalak A, Milej D, Diop M, et al. Can time-resolved NIRS provide the sensitivity to detect brain activity during motor imagery consistently?. Biomed Opt Express 2017; 8: 2162. [DOI] [PMC free article] [PubMed] [Google Scholar]
- 36.Liemert A, Kienle A. Application of the Laplace transform in time-domain optical spectroscopy and imaging. J Biomed Opt 2015; 20: 110502. [DOI] [PubMed] [Google Scholar]
- 37.Liemert A. Light diffusion in N-layered turbid media: frequency and time domains. J Biomed Opt 2010; 15: 025002. [DOI] [PubMed] [Google Scholar]
- 38.https://omlc.org/spectra/index.html.
- 39.Diop M, Tichauer KM, Elliott JT, et al. Comparison of time-resolved and continuous-wave near-infrared techniques for measuring cerebral blood flow in piglets. J Biomed Opt 2010; 15: 057004. [DOI] [PubMed] [Google Scholar]
- 40.Federspil PA, Tretbar SH, Böhlen FH, et al. Measurement of skull bone thickness for bone-anchored hearing aids: An experimental study comparing both a novel ultrasound system (SonoPointer) and computed tomographic scanning to mechanical measurements. Otol Neurotol 2010; 31: 440–446. [DOI] [PubMed] [Google Scholar]
- 41.Liebert A, Sawosz P, Milej D, et al. Assessment of inflow and washout of indocyanine green in the adult human brain by monitoring of diffuse reflectance at large source-detector separation. J Biomed Opt 2011; 16: 046011. [DOI] [PubMed] [Google Scholar]
- 42.Milej D, Abdalmalak A, Janusek D, et al. Time-resolved subtraction method for measuring optical properties of turbid media. Appl Opt 2016; 55: 1507. [DOI] [PubMed] [Google Scholar]
- 43.Milej D, Abdalmalak A, McLachlan P, et al. Subtraction-based approach for enhancing the depth sensitivity of time-resolved NIRS. Biomed Opt Express 2016; 7: 4514. [DOI] [PMC free article] [PubMed] [Google Scholar]
- 44.Puszka A, Hervé L, Planat-Chrétien A, et al. Time-domain reflectance diffuse optical tomography with Mellin-Laplace transform for experimental detection and depth localization of a single absorbing inclusion. Biomed Opt Express 2013; 4: 569–83. [DOI] [PMC free article] [PubMed] [Google Scholar]
- 45.Contini D, Mora AD, Spinelli L, et al. Effects of time-gated detection in diffuse optical imaging at short source-detector separation. J Phys D Appl Phys. Epub ahead of print 2015. DOI: 10.1088/0022-3727/48/4/045401. [Google Scholar]
- 46.Diop M, Kishimoto J, Toronov V, et al. Development of a combined broadband near-infrared and diffusion correlation system for monitoring cerebral blood flow and oxidative metabolism in preterm infants. Biomed Opt Express 2015; 6: 3907. [DOI] [PMC free article] [PubMed] [Google Scholar]
- 47.Diop M, Verdecchia K, Lee T-Y, et al. Calibration of diffuse correlation spectroscopy with a time-resolved near-infrared technique to yield absolute cerebral blood flow measurements. Biomed Opt Express 2011; 2: 2068–2081. [DOI] [PMC free article] [PubMed] [Google Scholar]
- 48.Baker WB, Parthasarathy AB, Ko TS, et al. Pressure modulation algorithm to separate cerebral hemodynamic signals from extracerebral artifacts. Neurophotonics 2015; 2: 035004. [DOI] [PMC free article] [PubMed] [Google Scholar]
- 49.Verdecchia K, Diop M, Lee A, et al. Assessment of a multi-layered diffuse correlation spectroscopy method for monitoring cerebral blood flow in adults. Biomed Opt Express 2016; 7: 3659. [DOI] [PMC free article] [PubMed] [Google Scholar]
- 50.Verdecchia K, Diop M, Lee T-Y, et al. Quantifying the cerebral metabolic rate of oxygen by combining diffuse correlation spectroscopy and time-resolved near-infrared spectroscopy. J Biomed Opt 2013; 18: 27007. [DOI] [PubMed] [Google Scholar]
- 51.Steinbrink J, Fischer T, Kuppe H, et al. Relevance of depth resolution for cerebral blood flow monitoring by near-infrared spectroscopic bolus tracking during cardiopulmonary bypass. J Thorac Cardiovasc Surg 2006; 132: 1172–1178. [DOI] [PubMed] [Google Scholar]
- 52.Kohl-Bareis M, Obrig H, Steinbrink J, et al. Noninvasive monitoring of cerebral blood flow by a dye bolus method: separation of brain from skin and skull signals. J Biomed Opt 2002; 7: 464–470. [DOI] [PubMed] [Google Scholar]
Associated Data
This section collects any data citations, data availability statements, or supplementary materials included in this article.
Supplementary Materials
Supplemental Material for Quantification of cerebral blood flow in adults by contrast-enhanced near-infrared spectroscopy: Validation against MRI by Daniel Milej, Lian He, Androu Abdalmalak, Wesley B Baker, Udunna C Anazodo, Mamadou Diop, Sudipto Dolui, Venkaiah C Kavuri, William Pavlosky, Lin Wang, Ramani Balu, John A Detre, Olivia Amendolia, Francis Quattrone, W Andrew Kofke, Arjun G Yodh and Keith St Lawrence in Journal of Cerebral Blood Flow & Metabolism