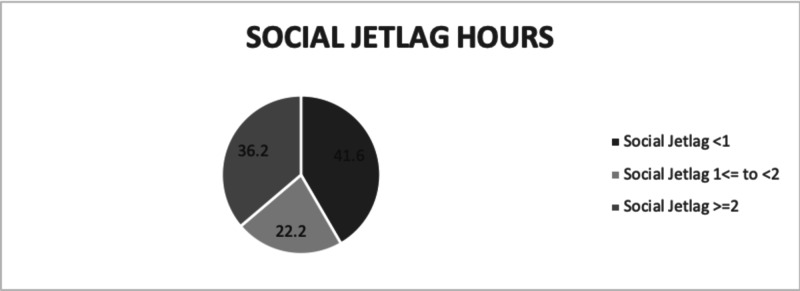
Figure 1. Classification of participants into groups based on SJL hours.
The darkest color represents people with SJL of less than one hour (41.6%). The gray shade represents people with SJL of one hour to less than two hours (36.2%). The light gray color represents people with two hours or more of SJL (22.2%)
SJL: social jetlag

