Abstract
Background
In view of the current difficulty of clinically diagnosing osteoarticular tuberculosis, our aim was to use mass spectrometry to establish diagnostic models and to screen and identify serum proteins which could serve as potential diagnostic biomarkers for early detection of osteoarticular tuberculosis.
Methods
Matrix‐assisted laser desorption/ionization time‐of‐flight mass spectrometry (MALDI‐TOF MS) was used to select an osteoarticular tuberculosis‐specific serum peptide profile and establish diagnostic models. Further, liquid chromatography‐tandem mass spectrometry (LC‐MS/MS) was used to identify potential serum biomarkers that could be used for auxiliary diagnosis of osteoarticular tuberculosis, and then clinical serum samples were used to verify these biomarkers by enzyme‐linked immunosorbent assay (ELISA).
Results
We established four diagnostic models that can distinguish osteoarticular tuberculosis from rheumatoid arthritis, ankylosing spondylitis, osteoarticular infections, and healthy adults. The models were osteoarticular tuberculosis‐rheumatoid arthritis, osteoarticular tuberculosis‐ankylosing spondylitis, osteoarticular tuberculosis‐osteoarticular infections, and osteoarticular tuberculosis‐healthy adult, and their accuracy was 76.78%, 79.02%, 83.77%, and 88.16%, respectively. Next, we selected and identified 18 proteins, including complement factor H‐related protein 1 (CFHR1) and complement factor H‐related protein 2 (CFHR2), which were upregulated in the tuberculosis group only.
Conclusions
We successfully established four diagnostic models involving osteoarticular tuberculosis, rheumatoid arthritis, ankylosing spondylitis, osteoarticular infections, and healthy adults. Furthermore, we found that CFHR1 and CFHR2 may be two valuable auxiliary diagnostic indicators for osteoarticular tuberculosis. These results provide reference values for rapid and accurate diagnosis of osteoarticular tuberculosis.
Keywords: biomarker, mass spectrometry, osteoarticular tuberculosis, tuberculosis
1. INTRODUCTION
Tuberculosis is a chronic infectious disease caused by Mycobacterium tuberculosis (Mtb) with the respiratory tract as the main route of transmission. 1 According to the World Health Organization's Global Tuberculosis Research Report released in 2018, there were 10 million new cases of tuberculosis in 2017, with more than 1.6 million deaths due to tuberculosis. 2 Tuberculosis has become the world's second‐highest mortality‐rate infectious disease after AIDS, which is a serious threat to human health. 3 , 4 In the case of tuberculosis, 20% of the incidence is due to extrapulmonary tuberculosis; however, the rate of diagnosis and treatment of extrapulmonary tuberculosis is far lower compared with pulmonary tuberculosis. 5 , 6 Due to the scattered location of extrapulmonary tuberculosis, poor clinical manifestation, and the lack of relevant scientific research and diagnostic guidelines, extrapulmonary tuberculosis cannot be diagnosed early, which delays the patient's treatment timing. 7 , 8
Osteoarticular tuberculosis is a common form of extrapulmonary tuberculosis, and most patients with osteoarticular tuberculosis in China will be misdiagnosed with other types of arthritis or bone tissue infection in the early stage. 7 , 9 , 10 By the time of final diagnosis, the opportunity for better treatment has been missed and there is no option but to choose invasive surgery.
Due to its many advantages, mass spectrometry has been widely used in clinical practice. 11 , 12 , 13 In this study, we used clinically common patient serum samples as materials and used mass spectrometry technology to identify biomarkers that may have diagnostic significance in serum, with the aim of providing new diagnostic references for accurate diagnosis of osteoarticular tuberculosis as early as possible.
2. MATERIALS AND METHODS
2.1. Sample information
Serum samples from patients with osteoarticular tuberculosis, rheumatoid arthritis, ankylosing spondylitis, and osteoarticular infections, as well as from healthy adults, were collected and analyzed by MALDI‐TOF MS and LC‐MS/MS (Tables 1 and 2). Furthermore, we used serum samples from patients with osteoarticular tuberculosis and healthy adults for analysis by ELISA to verify the results of LC‐MS/MS (Table 3). This research program was approved by the medical ethics committee of the PLA general hospital.
Table 1.
Clinical serum samples analyzed by MALDI‐TOF MS
| Samples | Gender (Male/Female) | Age (mean ± SD) | |
|---|---|---|---|
| Training set | |||
| Osteoarticular tuberculosis | 40 | 23/17 | 38.97 ± 7.65 |
| Rheumatoid arthritis | 40 | 16/24 | 49.95 ± 6.87 |
| Ankylosing Spondylitis | 30 | 19/11 | 31.23 ± 6.86 |
| Osteoarticular infections | 40 | 27/13 | 55.97 ± 10.08 |
| Healthy adult | 40 | 21/19 | 40.55 ± 4.49 |
| Validation set | |||
| Osteoarticular tuberculosis | 98 | 54/44 | 49.92 ± 19.54 |
| Rheumatoid arthritis | 70 | 32/38 | 54.61 ± 11.17 |
| Ankylosing spondylitis | 45 | 22/23 | 37.34 ± 13.16 |
| Osteoarticular infections | 56 | 29/27 | 58.25 ± 13.74 |
| Healthy adult | 71 | 35/36 | 47.07 ± 13.22 |
Table 2.
Clinical serum samples analyzed by LC‐MS/MS
| Samples | Gender (Male/Female) | Age (mean ± SD) | |
|---|---|---|---|
| Osteoarticular tuberculosis | 30 | 16/14 | 39.33 ± 17.94 |
| Rheumatoid arthritis | 30 | 14/16 | 52.80 ± 12.80 |
| Ankylosing spondylitis | 30 | 17/13 | 33.30 ± 14.09 |
| Osteoarticular infections | 30 | 18/12 | 61.40 ± 14.20 |
| Healthy adult | 30 | 17/13 | 47.56 ± 10.06 |
Table 3.
Clinical serum samples analyzed by ELISA
| Samples | Gender (Male/Female) | Age (mean ± SD) | |
|---|---|---|---|
| Osteoarticular tuberculosis | 30 | 15/15 | 30.00 ± 15.48 |
| Healthy adult | 30 | 12/18 | 30.00 ± 10.98 |
2.2. Blood sample collection
Samples (5 mL) of venous whole blood were collected in the morning fasting state in a 10 mL vacuum blood collection tube containing inert separation gel. The blood was coagulated by placing the blood collection tube vertically at 4°C for 1 hour and then centrifuged at 2390 × g for 7 minutes to fully separate the serum. Each serum sample was divided into several 0.5 mL centrifuge tubes and frozen at −80°C until use to avoid repeated freezing and thawing.
2.3. Experimental methods
2.3.1. MALDI‐TOF MS
Serum peptide extraction
WCX magnetic beads were repeatedly inverted and mixed, and then 10 μL of serum was added to 7 μL WCX magnetic beads, 95 μL of WCX magnetic bead binding buffer was added, and the tube was repeatedly mixed several times and then allowed to stand at room temperature for 5 minutes. After standing, the sample tube was placed on a magnetic bead separator for 1 minutes, during which the magnetic beads became attached to the test tube wall, and then the clarified liquid was removed.
The sample tube was removed from the magnetic bead separator, and then 100 μL washing buffer was added and mixed repeatedly several times, and the tube was allowed to stand at room temperature for 2 minutes. After standing, the sample tube was placed on a magnetic bead separator, and the magnetic beads were removed as described above.
The second step was repeated.
The sample tube in the third step was removed from the magnetic bead separator, and then 10 μL of the elution buffer was added and mixed repeatedly 10 times or more to ensure it was fully mixed and then allowed to stand at room temperature for 5 minutes. After standing, the sample tube was placed on a magnetic bead separator, and the magnetic beads were allowed to attach to the tube wall for 1 minutes. Once the liquid was clarified, it was transferred to a new 0.2 mL sample tube.
The clear liquid in the fourth step was stored at −20°C and subjected to mass spectrometry analysis within 24 hours.
Mass spectrometry analysis
According to the molecular weight of the protein polypeptide determined experimentally, a suitable matrix was selected. The matrix used in this experiment was α‐cyano‐4‐hydroxycinnamic acid (HCCA) with a relative molecular mass between 1 and 20 000 Da.
The sample of the polypeptide extract frozen at −20°C was thawed on ice, and then 1 μL of the sample was spotted onto a mass spectrometer target plate and allowed to dry at room temperature, after which 1 μL of the substrate was applied to the sample at room temperature and again allowed to dry. The experimental environment was kept clean, and the temperature was appropriate. This procedure was repeated two times for each sample.
The spotted target was placed into the MALDI‐TOF MS mass spectrometer, and the target position was adjusted. The parameters were as follows: energy 70 mV, peptide peak screening interval 1000‐10 000 Da, bombardment frequency 10, laser frequency 30, mode selects linear mode.
The instrument was calibrated using the standard product. After calibration, the mass spectrometry of each sample was performed to obtain the corresponding serum peptide fingerprint map, and all the maps were saved by the sequence number, for later data analysis.
2.3.2. LC‐MS/MS
Analysis was performed using an Easy LC Liquid Phase‐Q Exactive Mass Spectrometer (Thermo Fisher Scientific).
Protein sample extraction and digestion
Five microliters of a blood sample was removed to a new EP tube, and then 100 mmol/L TEAB solution was added to make the volume up to 100 μL.
Five microliters of 200 mmol/L TCEP was added to the same tube, and the mixture was incubated at 55°C for 1 hour.
Five microliters of 375 mmol/L iodoacetamide (IAA) was added to the tube, and the mixture was allowed to react in the dark for 30 minutes.
Six times the volume of sample solution of precooled acetone (precooled at −20°C for 1 hour) was added and allowed to react overnight at −20°C.
Next day, the reaction mixture was centrifuged at 8000 × g at 4°C for 10 minutes, the supernatant was carefully removed, then the tube cover was opened, and the tube was allowed to stand at room temperature for 2‐3 minutes.
Once the sample was dry, 100 μg of protein was removed, added to 100 μL of 100 mmol/L TEAB solution, and then trypsin was added at a 1:50 ratio of enzyme to protein, and the mix was digested overnight at 37°C.
Liquid chromatography mass spectrometry
Partially digested samples were dissolved in solution A (2% acetonitrile + 98% H2O + 0.1% formic acid), centrifuged at 20 000 × g for 30 minutes, and then the supernatant was removed for detection of the protein sequence using an Easy LC liquid phase‐Q Exactive mass spectrometer.
Chromatographic conditions
Columns (made in‐house)
①Enrichment column: C18 5 μm, ID 100 μm, Length 20 mm
②Separation column: C18 1.9 μm, ID 150 μm, Length 100 mm
Mobile phase
A: 2% acetonitrile + 98% H2O + 0.1% formic acid
B: 80% acetonitrile + 20% H2O + 0.1% formic acid
Velocity of flow: 0.3 μL/min
The elution conditions of LC‐MS/MS were as follows (Table 4)
Table 4.
Elution conditions of LC‐MS/MS
| Time (min) | B % |
|---|---|
| 0 | 5 |
| 8 | 8 |
| 58 | 22 |
| 70 | 32 |
| 71 | 90 |
| 78 | 90 |
| 80 | 5 |
Mass spectrometry conditions
Data collection time: 90 minutes, spray voltage: 2 KV, capillary temperature: 320°C, normalized collision energy: 27%, acquisition quality range: 300‐1400 Da.
Primary parameters
Resolution: 70 000, AGC target: 3e6, Maximum IT: 60 ms, Spectrum data type: Profile
Secondary parameters
Resolution: 17 500, AGC target: 5e4, Maximum IT: 80 ms, Isolation window: 3.0 m/z.
Data exploration
Search engine: Maxquant 1.5.2.8. First order error: 20 ppm, Second order error: 0.02 Da. The fixed modification was as follows: cysteine was modified to urea‐methylated cysteine (carbamidomethyl‐Cys), and the variable modification was as follows: methionine oxidation (oxidation‐M), Lysis C or Trypsin or Glu‐C enzyme digestion. The enzymatic fragment allowed up to two missed sites. Data gap filling, normalization, and differential screening (P < .05) were all set using the Perseus software standard.
2.4. ELISA
The dispensed serum was thawed at room temperature before centrifugation for 15 minutes at 1000 × g, to avoid repeated freeze‐thaw cycles.
Reagents, samples, and standards were prepared according to the instructions.
One hundred microliters of standard or sample was added to each well and incubated for 2 hours at 37°C.
The liquid was removed from each well, without washing.
One hundred microliters of Biotinylated antibody (1×) was added to each well and incubated for 1 hour at 37°C.
The wells were aspirated and washed three times.
One hundred microliters of HRP‐avidin (1×) was added to each well and incubated for 1 hour at 37°C.
The wells were aspirated and washed five times.
Ninety microliters of TMB substrate was added to each well and incubated for 15‐30 minutes at 37°C, protected from light.
Fifty microliters of Stop Solution was added to each well. Results were read at 450 nm within 5 minutes. Measurements were repeated three times.
Generate a standard curve, and then the concentration of each well was calculated.
3. RESULTS
3.1. MALDI‐TOF MS
We established four diagnostic models to identify osteoarticular tuberculosis patients according to the results of MALDI‐TOF MS.
3.1.1. Osteoarticular tuberculosis‐Healthy adult
According to the data analysis, 162 peptide peaks were detected in osteoarticular tuberculosis and healthy adult samples from 1000 to 10 000 Da, and 79 peptide peaks were statistically significant (P < .05). A diagnostic model was established for the differentially expressed polypeptide peaks of m/z 2 114.1, 2582.7, 5947.2, and 7639.4, in which m/z 2582.7 and 5947.2 were significantly upregulated in the osteoarticular tuberculosis group, and m/z 2114.1 and 7639.4 were significantly upregulated in the healthy adult group. The sensitivity, specificity, and accuracy rate of this diagnostic model were 92.86%, 81.69%, and 88.16%, respectively. We also evaluated the diagnostic efficacy of each modeled differential protein peptide. The AUC value of each ROC curve (Figure 1) of m/z 2 114.1, 2582.7, 5947.2, and 7639.4 were 0.9383, 0.7603, 0.8919, and 0.8541, respectively.
Figure 1.
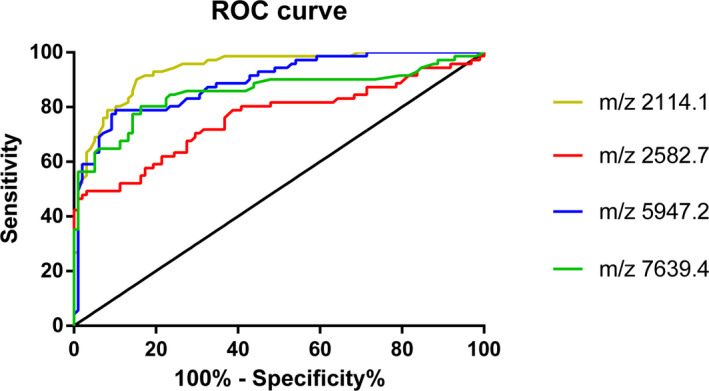
ROC curve of Osteoarticular tuberculosis‐Healthy adult
3.1.2. Osteoarticular tuberculosis‐Rheumatoid arthritis
We detected 136 peptide peaks in osteoarticular tuberculosis and rheumatoid arthritis samples from 1000 to 10 000 Da, and 52 peptide peaks were statistically significant (P < .05). A diagnostic model was established for the differentially expressed polypeptide peaks of m/z 5308.2, 5945.5, 7658.9, and 9323.1, in which m/z 5949.5 and 9293.1 were significantly upregulated in the osteoarticular tuberculosis group, and m/z 5308.2 and 7658.9 were significantly upregulated in the rheumatoid arthritis group. The sensitivity, specificity, and accuracy rate of this diagnostic model were 77.55%, 75.71%, and 76.78%, respectively. We also evaluated the diagnostic efficacy of each modeled differential protein peptide. The AUC value of each ROC curve (Figure 2) of m/z 5308.2, 5945.5, 7658.9, and 9323.1 were 0.7914, 0.8645, 0.8377, and 0.7965, respectively.
Figure 2.
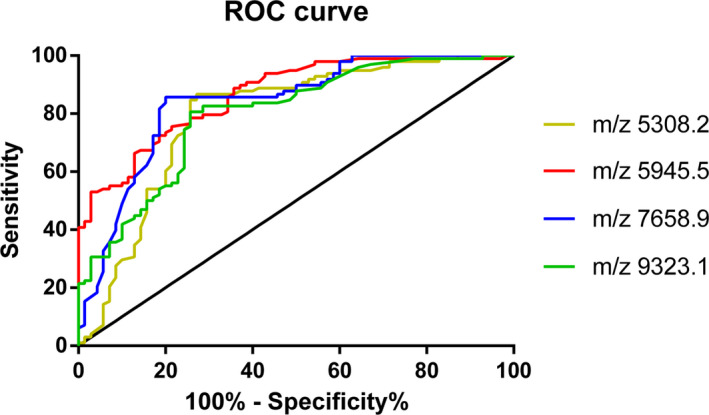
ROC curve of Osteoarticular tuberculosis‐ Rheumatoid Arthritis
3.1.3. Osteoarticular tuberculosis‐Ankylosing spondylitis
In this group, 143 peptide peaks were detected in osteoarticular tuberculosis and ankylosing spondylitis samples from 1000 to 10 000 Da, and 46 peptide peaks were statistically significant (P < .05). A diagnostic model was established for the differentially expressed polypeptide peaks of m/z 4611.8, 5132.4, 5947.2, and 7596.2, in which m/z 5132.4 and 5947.2 were significantly upregulated in the osteoarticular tuberculosis group, and m/z 4611.8 and 7596.2 were significantly upregulated in the ankylosing spondylitis group. The sensitivity, specificity, and accuracy rate of this diagnostic model were 82.65%, 71.11%, and 79.02%, respectively. We also evaluated the diagnostic efficacy of each modeled differential protein peptide. The AUC value of each ROC curve (Figure 3) of m/z 4611.8, 5132.4, 5947.2, and 7596.2 were 0.8308, 0.8195, 0.8276, and 0.8243, respectively.
Figure 3.
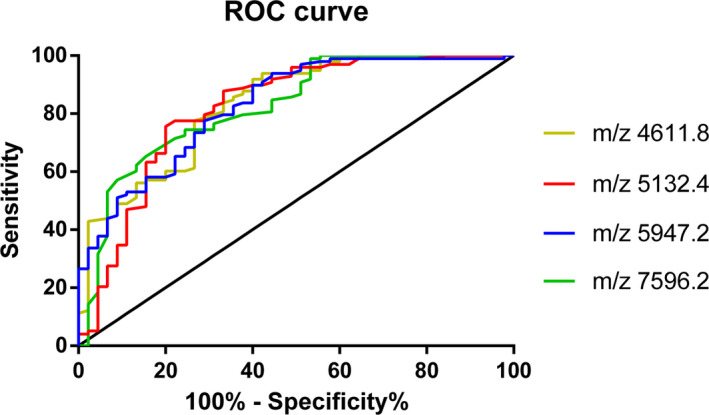
ROC curve of Osteoarticular tuberculosis‐ Ankylosing Spondylitis
3.1.4. Osteoarticular tuberculosis‐ Osteoarticular infections
According to the data analysis, 152 peptide peaks were detected in osteoarticular tuberculosis and osteoarticular infections samples from 1000 to 10 000 Da, and 45 peptide peaks were statistically significant (P < .05). A diagnostic model was established for the differentially expressed polypeptide peaks of m/z 2583.2, 5302.4, 5835.9, 5849.3, and 6631.1, in which m/z 5302.4, 5835.9, and 5849.3 were significantly upregulated in the osteoarticular tuberculosis group, and m/z 2583.2 and 6631.1 were significantly upregulated in the osteoarticular infections group. The sensitivity, specificity, and accuracy rate of this diagnostic model were 77.55%, 94.64%, and 83.77%, respectively. We also evaluated the diagnostic efficacy of each modeled differential protein peptide. The AUC value of each ROC curve (Figure 4) of m/z 2583.2, 5302.4, 5835.9, 5849.3, and 6631.1 were 0.8188, 0.7646, 0.7567, 0.7246, and 0.7903, respectively.
Figure 4.
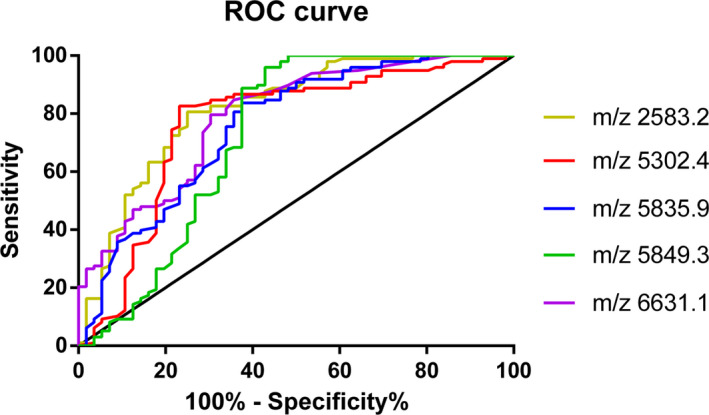
ROC curve of Osteoarticular tuberculosis‐ Osteoarticular Infections
3.2. LC‐MS/MS
According to the experimental grouping, we performed seven comparisons to identify the specific proteins of osteoarticular tuberculosis based on the results of LC‐MS/MS.
3.2.1. Osteoarticular tuberculosis‐Healthy adult
In this group, we screened 94 proteins, of which 74 proteins showed statistically significant differences (P < .05). Among them, 39 proteins were upregulated and 35 proteins were downregulated in osteoarticular tuberculosis.
3.2.2. Osteoarticular tuberculosis‐Rheumatoid Arthritis
In this group, we screened 99 proteins, of which 83 showed statistically significant differences (P < .05). Among them, 51 proteins were upregulated and 32 were downregulated in osteoarticular tuberculosis.
3.2.3. Osteoarticular tuberculosis‐ankylosing spondylitis
In this group, we screened 79 proteins, of which 67 showed statistically significant differences (P < .05). Among them, 35 proteins were upregulated and 32 proteins were downregulated in osteoarticular tuberculosis.
3.2.4. Osteoarticular tuberculosis‐osteoarticular infections
In this group, we screened 70 proteins, of which 63 showed statistically significant differences (P < .05). Among them, 27 were upregulated and 36 were downregulated in osteoarticular tuberculosis.
3.2.5. Rheumatoid arthritis‐healthy adult
In this group, we screened 69 proteins, of which 59 proteins showed statistically significant differences (P < .05). Of them, 24 were upregulated and 35 were downregulated in rheumatoid arthritis.
3.2.6. Ankylosing spondylitis‐healthy adult
In this group, we screened 56 proteins, of which 45 proteins showed statistically significant differences (P < .05). Twenty of these were upregulated, and 25 were downregulated in ankylosing spondylitis.
3.2.7. Osteoarticular infections‐healthy adult
In this group, we screened 64 proteins, of which 50 proteins showed statistically significant differences (P < .05). Among them, 17 were upregulated and 33 were downregulated in osteoarticular infections.
Considering the clinical applicability and the simplicity of detection, we focused on the upregulated differential proteins in the subsequent analysis of the experimental results. Combining the results, we have drawn two Venn diagrams to more intuitively screen out the upregulated proteins that are specific in the tuberculosis group (Figures 5, 6).
Figure 5.
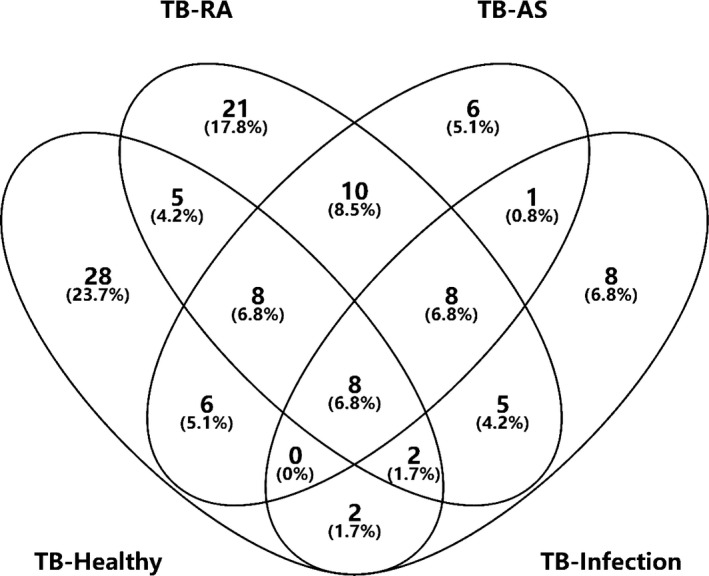
Venn diagrams of Osteoarticular tuberculosis‐Healthy adult, Osteoarticular tuberculosis‐Rheumatoid Arthritis, Osteoarticular tuberculosis‐Ankylosing Spondylitis, Osteoarticular tuberculosis‐Osteoarticular Infections
Figure 6.
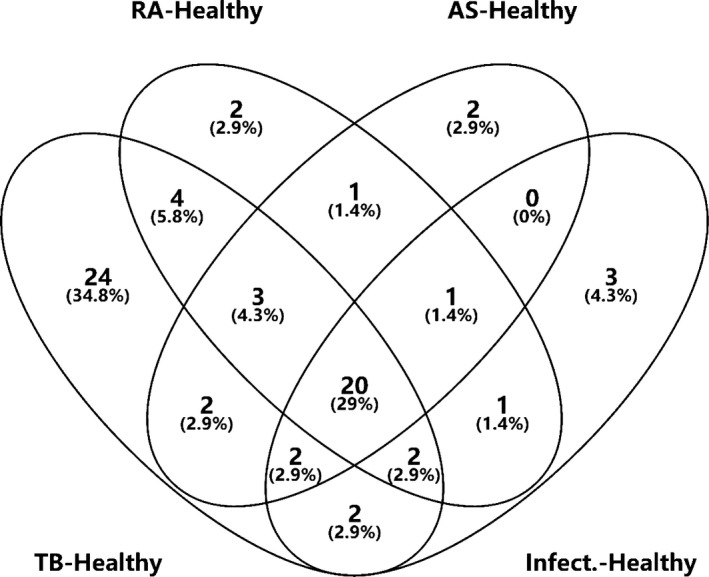
Venn diagrams of Osteoarticular tuberculosis‐Healthy adult, Rheumatoid Arthritis‐Healthy adult, Ankylosing Spondylitis‐Healthy adult, Osteoarticular Infections‐Healthy adult
First, we collected data from the groups Osteoarticular tuberculosis‐Healthy adult, Osteoarticular tuberculosis‐Rheumatoid Arthritis, Osteoarticular tuberculosis‐Ankylosing Spondylitis, and Osteoarticular tuberculosis‐Osteoarticular infections and found eight proteins upregulated in the tuberculosis group. Then, we collected data from the groups Osteoarticular tuberculosis‐Healthy adult, Rheumatoid Arthritis‐Healthy adult, Ankylosing Spondylitis‐Healthy adult, and Osteoarticular infections‐Healthy adult and found 24 proteins upregulated in the tuberculosis group.
Based on these results, after we removed repeated proteins, there were 18 proteins upregulated specifically in the tuberculosis groups (Table 5).
Table 5.
Proteins upregulated in tuberculosis group
| Number | Protein |
|---|---|
| 1 | Human PR domain zinc finger protein 15 |
| 2 | Human beta‐2‐microglobulin |
| 3 | Human complement factor H‐related protein 1 |
| 4 | Human complement factor H‐related protein 2 |
| 5 | Human complement factor P |
| 6 | Human mucin‐16 |
| 7 | Human putative elongation factor 1‐alpha‐like 3 |
| 8 | Human elongation factor 1‐alpha 1 |
| 9 | Human A‐kinase anchor protein 9 |
| 10 | Human prenylcysteine oxidase 1 |
| 11 | Human adiponectin |
| 12 | Human ribonuclease pancreatic |
| 13 | Human platelet glycoprotein Ib alpha chain |
| 14 | Human proprotein convertase subtilisin/kexin type 9 |
| 15 | Human protein S100‐A9 |
| 16 | Human complement component C9 |
| 17 | Human insulin‐like growth factor‐binding protein 6 |
| 18 | Human heterogeneous nuclear ribonucleoproteins A2/B1 |
3.3. ELISA
Based on the results of LC‐MS/MS, clinical utility, ELISA kit detection range and preliminary experimental results, we finally chose Human Complement factor H‐related protein 1 (CFHR1) and Human Complement factor H‐related protein 2 (CFHR2) as the validation proteins.
3.3.1. CFHR1
We used serum samples from 30 osteoarticular tuberculosis patients and 30 healthy adults to conduct this experiment; the concentrations of CFHR1 among osteoarticular tuberculosis and healthy adults were 90.27 (78.76‐110.17) μg/mL and 62.11 (52.59‐80.44) μg/mL, respectively. Statistical analysis showed that there were significant differences (P < .05) between the concentrations in the two groups (Table 6). We also generated an ROC curve of CFHR1 (Figure 7) to judge the diagnostic efficacy, the AUC value was 0.8733.
Table 6.
Concentration of CFHR1 and CFHR2 in serum samples
| Osteoarticular tuberculosis | Healthy adult | P value | |
|---|---|---|---|
| CFHR1 (μg/mL) | 90.27 (78.76‐110.17) | 62.11 (52.59‐80.44) | <.05 |
| CFHR2 (μg/mL) | 97.74 (87.25‐127.80) | 84.55 (65.18‐102.81) | <.05 |
Figure 7.
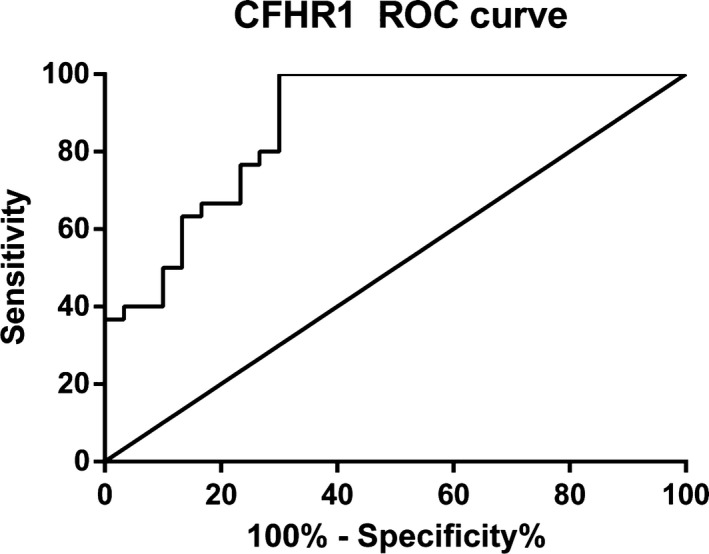
ROC curve of CFHR1
3.3.2. CFHR2
We used serum samples from 30 osteoarticular tuberculosis patients and 30 healthy adults to conduct this experiment, the concentrations of CFHR2 in osteoarticular tuberculosis patients and healthy adults were 97.74 (87.25‐127.80) μg/mL and 84.55 (65.18‐102.81) μg/mL, respectively, and statistical analysis showed that there was a significant difference (P < .05) in the concentration between the two groups (Table 6). We also generated an ROC curve of CFHR2 (Figure 8) to judge the diagnostic efficacy, the AUC value was 0.7289.
Figure 8.
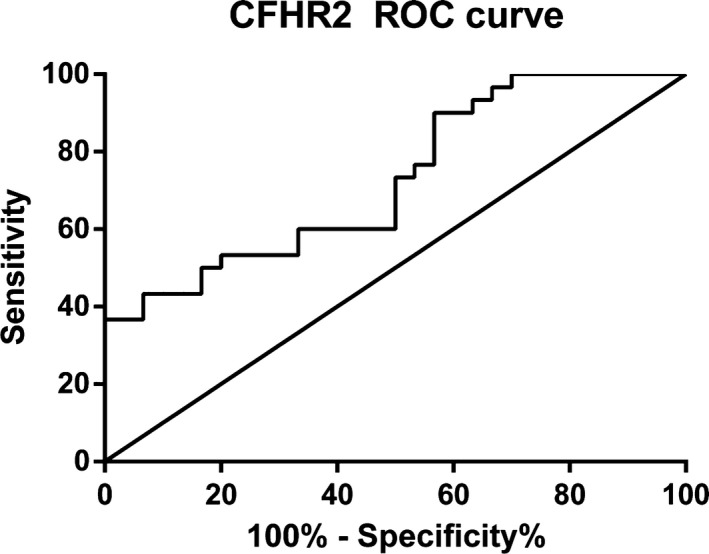
ROC curve of CFHR2
4. DISCUSSION
Tuberculosis has become the world's second leading cause of death due to infectious disease after AIDS. 14 , 15 However, in most parts of Asia, Africa, and Russia, the situation of prevention and control of tuberculosis is not very satisfactory due to the economic situation and medical conditions. At the same time, with the increase in the number of multi‐drug‐resistant tuberculosis (MDR‐TB), extensively drug‐resistant tuberculosis (XDR‐TB) and latent tuberculosis infection (LTBI), 16 the global prevention and control of tuberculosis are becoming increasingly difficult. For example, some studies have tested 430 Mtb strains in Southwest China, 74 Mtb strains were identified as drug resistance, including 38 MDR‐TB. The frequency of MDR‐TB strains was significantly higher in Beijing family (10.89%) than that in non‐Beijing family (3.94%). 17 In addition to common tuberculosis, the incidence of extrapulmonary tuberculosis is also increasing. 18 However, due to the lack of studies of extrapulmonary tuberculosis and the fact that early symptoms of extrapulmonary tuberculosis are usually not obvious or are poorly specific, the rate of diagnosis and treatment of extrapulmonary tuberculosis is much lower than that of pulmonary tuberculosis. 19 , 20
MALDI‐TOF MS and LC‐MS/MS are two mature mass spectrometry technologies currently used in clinical practice. They have shown many advantages such as fast detection speed and accurate results in blood, body fluid, and colony samples. 11 , 21 , 22 There have also been studies on tuberculosis using the above‐mentioned mass spectrometry techniques for the identification of potential biomarkers for specific samples, but most studies have been carried out on pulmonary tuberculosis, and studies on extrapulmonary tuberculosis are rare. 23
Osteoarticular tuberculosis is a common extrapulmonary tuberculosis caused by Mycobacterium tuberculosis (Mtb) infection of osteoarticular tissues. For the early diagnosis of osteoarticular tuberculosis, interferon gamma release assay (IGRA) and the rifampicin‐resistant real‐time fluorescence quantitative PCR technique Xpert Mycobacterium tuberculosis/rifampicin (Xpert MTB/RIF) diagnostic system platform are commonly used in clinical practice. Furthermore, some studies have shown that the detection of TNF‐α and TNF‐β in the serum of patients with osteoarticular tuberculosis also has certain diagnostic value. 24 However, due to factors such as poor early clinical manifestation and atypical imaging, it is often difficult to accurately diagnose the disease early. 25 Studies have shown that the average diagnosis delay rate of osteoarticular tuberculosis is about 6.5 months, 9 so accurate and rapid diagnosis of the disease as soon as possible has become an urgent problem in clinical practice.
In this study, we used serum samples of osteoarticular tuberculosis, rheumatoid arthritis, ankylosing spondylitis, osteoarticular infections, and healthy adults to construct diagnostic models using MALDI‐TOF MS. Further, we also used these serum samples to screen specific differential proteins in osteoarticular tuberculosis by LC‐MS/MS. According to the results of the four diagnostic models constructed in this study, osteoarticular tuberculosis showed large differences from other samples in protein and peptide composition. Combined with the ROC curve of the corresponding model, these diagnostic models can better distinguish osteoarticular tuberculosis from other diseases and thus, provide good diagnostic results. In order to make the diagnostic model more accurate, we will in future use the advantages of a multi‐center study to expand the number of samples for verification.
In this study, we used LC‐MS/MS to screen 18 differentially expressed proteins that are upregulated in osteoarticular tuberculosis. After the preliminary experiments, and considering the clinical utility and the detection range of ELISA kits, we finally chose CFHR1 and CFHR2 for verification. The verification results showed that there were significant differences in the expression levels of CFHR1 and CFHR2 between osteoarticular tuberculosis and healthy adults, indicating that these proteins will be valuable for auxiliary diagnosis of osteoarticular tuberculosis.
Complement factor H‐related protein 1 is a component of the human complement system, which plays an important role in malignant tumors, pathogenic infections, inflammatory reactions, and so on. Studies have shown that CFHR1 plays a role in the prognosis of patients with lung adenocarcinoma. 26 The prognosis of lung adenocarcinoma patients with downregulated CFHR1 is generally poor, which also led to the idea that CFHR1 may be a target for tumor inhibition drugs. In addition, some studies have reported that deletion of CFHR1‐related gene loci may lead to aggravation of pathogenic infections such as Andes orthohantavirus (ANDV) and Shiga toxin. 27 , 28 The main mechanism is that it mediates activation of the complement system, and the lack of this protein can cause the body to be unable to fully resist pathogen invasion. Furthermore, CFHR1 can also be used as an inducer of inflammatory substances to promote the body's immune response, 29 and it also plays a major role in the early rejection of liver transplantation and thus, can be used as a characteristic biomarker for early diagnosis of acute cellular rejection. 30
Similarly, CFHR2 also plays an important role in the complement system. 31 , 32 Studies have shown that CFHR2 is important in the gender difference in the incidence of acute anterior uveitis. 33 In addition, it has a wide range of applications in terms of resistance to pathogen invasion and pulmonary arterial hypertension associated with congenital heart disease. 34
However, there have been no studies investigating the roles of CFHR1 and CFHR2 in tuberculosis, especially osteoarticular tuberculosis. In our study, we found that CFHR1 and CFHR2 are both upregulated specifically in the tuberculosis group. A search of the literature identified no similar results for the same condition; thus, our results can provide information on the mechanism of immune system activation in tuberculosis. In further studies, we will focus on the mechanism of CFHR1 and CFHR2 in osteoarticular tuberculosis. At the same time, we will also evaluate the role of CFHR1 and CFHR2 in early auxiliary diagnosis of osteoarticular tuberculosis compared with other clinical laboratory detection methods.
Above all, our study successfully established four diagnostic models related to osteoarticular tuberculosis, and we also found some valuable biomarkers such as CFHR1 and CFHR2, which can be used for auxiliary diagnosis of osteoarticular tuberculosis, as well as providing reference values.
ACKNOWLEDGMENTS
We wish to express our sincere thanks to the doctors and physicians of the Clinical Laboratory Medicine Department in the 1st and 8th Medical Center of the PLA General Hospital for the convenience of sample collection. Sincere thanks are also due to the orthopedics doctors in the 1st Medical Center of the PLA General Hospital and tuberculosis doctors in the 8th Medical Center of the PLA General Hospital for their help in the design and feasibility study of the project. We also sincerely thank the staff of Beijing Omics Biotechnology Co., Ltd. for their help with LC‐MS/MS analysis. This study did not receive any specific grants from funding agencies in the public, commercial, or not‐for‐profit sectors.
Chen X, Jia X, Lei H, et al. Screening and identification of serum biomarkers of osteoarticular tuberculosis based on mass spectrometry. J Clin Lab Anal. 2020;34:e23297 10.1002/jcla.23297
Contributor Information
Chengbin Wang, Email: wangcbin301@163.com.
Jimin Gao, Email: jimingao64@163.com.
REFERENCES
- 1. Lopez‐Hernandez Y, Patino‐Rodriguez O, Garcia‐Orta ST, Pinos‐Rodriguez JM. Mass spectrometry applied to the identification of Mycobacterium tuberculosis and biomarker discovery. J Appl Microbiol. 2016;121(6):1485‐1497. [DOI] [PubMed] [Google Scholar]
- 2. World Health Organization Global Tuberculosis Report 2018.09.26. http://www.who.int/tb/publications/global_report/en/. Accessed September 26, 2018.
- 3. Vittor AY, Garland JM, Gilman RH. Molecular diagnosis of TB in the HIV positive population. Ann Glob Health. 2014;80(6):476‐485. [DOI] [PubMed] [Google Scholar]
- 4. Fan J, Zhang H, Nguyen DT, et al. Rapid diagnosis of new and relapse tuberculosis by quantification of a circulating antigen in HIV‐infected adults in the Greater Houston metropolitan area. BMC Med. 2017;15(1):188. [DOI] [PMC free article] [PubMed] [Google Scholar]
- 5. Walzl G, McNerney R, du Plessis N, et al. Tuberculosis: advances and challenges in development of new diagnostics and biomarkers. Lancet Infect Dis. 2018;18(7):e199‐e210. [DOI] [PubMed] [Google Scholar]
- 6. Norbis L, Alagna R, Tortoli E, Codecasa LR, Migliori GB, Cirillo DM. Challenges and perspectives in the diagnosis of extrapulmonary tuberculosis. Expert Rev Anti Infect Ther. 2014;12(5):633‐647. [DOI] [PubMed] [Google Scholar]
- 7. Zhang P, Zhang W, Lang Y, et al. Mass spectrometry‐based metabolomics for tuberculosis meningitis. Clin Chim Acta. 2018;483:57‐63. [DOI] [PubMed] [Google Scholar]
- 8. Purohit M, Mustafa T. Laboratory diagnosis of extra‐pulmonary tuberculosis (EPTB) in resource‐constrained setting: state of the art, challenges and the need. J Clin Diagn Res. 2015;9(4):1‐6. [DOI] [PMC free article] [PubMed] [Google Scholar]
- 9. Fuentes Ferrer MF, Torres LG, Ramírez OA, Zarzuelo MR, del Prado González N. Tuberculosis of the spine. A systematic review of case series. Int Orthop. 2012;36(2):221‐231. [DOI] [PMC free article] [PubMed] [Google Scholar]
- 10. Seung OP, Sulaiman W. Osteoarticular tuberculosis mimicking rheumatoid arthritis. Mod Rheumatol. 2012;22(6):931‐933. [DOI] [PubMed] [Google Scholar]
- 11. Deng C, Lin M, Hu C, et al. Establishing a serologic decision tree model of extrapulmonary tuberculosis by MALDI‐TOF MS analysis. Diagn Microbiol Infect Dis. 2011;71(2):144‐150. [DOI] [PubMed] [Google Scholar]
- 12. Bahk YY, Kim SA, Kim JS, et al. Antigens secreted from Mycobacterium tuberculosis: identification by proteomics approach and test for diagnostic marker. Proteomics. 2004;4(11):3299‐3307. [DOI] [PubMed] [Google Scholar]
- 13. Cho YT, Su H, Wu WJ, et al. Biomarker characterization by MALDI‐TOF/MS. Adv Clin Chem. 2015;69:209‐254. [DOI] [PubMed] [Google Scholar]
- 14. Sharma SK, Kohli M, Yadav RN, et al. Evaluating the diagnostic accuracy of xpert MTB/RIF assay in pulmonary tuberculosis. PLoS ONE. 2015;10(10):e0141011. [DOI] [PMC free article] [PubMed] [Google Scholar]
- 15. Fan L, Li D, Zhang S, et al. Parallel tests using culture, xpert MTB/RIF, and SAT‐TB in sputum plus bronchial alveolar lavage fluid significantly increase diagnostic performance of smear‐negative pulmonary tuberculosis. Front Microbiol. 2018;9;1107. [DOI] [PMC free article] [PubMed] [Google Scholar]
- 16. Alcaide F, Coll P. Advances in rapid diagnosis of tuberculosis disease and anti‐tuberculous drug resistance. Enferm Infecc Microbiol Clín. 2011;29:34‐40. [DOI] [PubMed] [Google Scholar]
- 17. Li D, Song Y, Yang P, Li X, Zhang AM, Xia X. Genetic diversity and drug resistance of Mycobacterium tuberculosis in Yunnan, China. J Clin Lab Anal. 2019;33(5):e22884. [DOI] [PMC free article] [PubMed] [Google Scholar]
- 18. Fan L, Chen Z, Hao XH, Hu ZY, Xiao HP. Interferon‐gamma release assays for the diagnosis of extrapulmonary tuberculosis: a systematic review and meta‐analysis. FEMS Immunol Med Microbiol. 2012;65(3):456‐466. [DOI] [PubMed] [Google Scholar]
- 19. Sah AK, Joshi B, Khadka DK, et al. Comparative study of genexpert MTB/RIF assay and multiplex PCR assay for direct detection of mycobacterium tuberculosis in suspected pulmonary tuberculosis patients. Curr Microbiol. 2017;74(9):1026‐1032. [DOI] [PubMed] [Google Scholar]
- 20. Hallur V, Sharma M, Sethi S, et al. Development and evaluation of multiplex PCR in rapid diagnosis of abdominal tuberculosis. Diagn Microbiol Infect Dis. 2013;76(1):51‐55. [DOI] [PubMed] [Google Scholar]
- 21. Yan Y, Ubukata M, Cody RB, Holy TE, Gross ML. High‐energy collision‐induced dissociation by MALDI TOF/TOF causes charge‐remote fragmentation of steroid sulfates. J Am Soc Mass Spectrom. 2014;25(8):1404‐1411. [DOI] [PMC free article] [PubMed] [Google Scholar]
- 22. Idelevich EA, Reischl U, Becker K. New microbiological techniques in the diagnosis of bloodstream infections. Dtsch Arztebl Int. 2018;115(49):822‐832. [DOI] [PMC free article] [PubMed] [Google Scholar]
- 23. Gu Y, Wang G, Dong W, et al. Xpert MTB/RIF and Genotype MTBDRplus assays for the rapid diagnosis of bone and joint tuberculosis. Int J Infect Dis. 2015;36:27‐30. [DOI] [PubMed] [Google Scholar]
- 24. Yinghua T, Yin L, Tang S, Zhang H, Lan J. Application of molecular, microbiological, and immunological tests for the diagnosis of bone and joint tuberculosis. J Clin Lab Anal. 2018;32:e22260. [DOI] [PMC free article] [PubMed] [Google Scholar]
- 25. Li Y, Jia W, Lei G, Zhao D, Wang G, Qin S. Diagnostic efficiency of Xpert MTB/RIF assay for osteoarticular tuberculosis in patients with inflammatory arthritis in China. PLoS ONE. 2018;13(6):e0198600. [DOI] [PMC free article] [PubMed] [Google Scholar]
- 26. Wu G, Yan Y, Wang X, et al. CFHR1 is a potentially downregulated gene in lung adenocarcinoma. Mol Med Rep. 2019;20(4):3642‐3648. [DOI] [PMC free article] [PubMed] [Google Scholar]
- 27. Ribeiro GE, Leon LE, Perez R, et al. Deletions in genes participating in innate immune response modify the clinical course of andes orthohantavirus infection. Viruses. 2019;11(8):680. [DOI] [PMC free article] [PubMed] [Google Scholar]
- 28. Nalluru SS, Sridharan M, Go RS, Said S, Marshall AL. Shiga toxin as a potential trigger of CFHR1 deletion‐associated thrombotic microangiopathy. Am J Med Sci. 2018;356(5):492‐498. [DOI] [PubMed] [Google Scholar]
- 29. Irmscher S, Brix SR, Zipfel SLH, et al. Serum FHR1 binding to necrotic‐type cells activates monocytic inflammasome and marks necrotic sites in vasculopathies. Nat commun. 2019;10(1):2961. [DOI] [PMC free article] [PubMed] [Google Scholar]
- 30. Jiang Q, Ru Y, Yu Y, et al. iTRAQ‐based quantitative proteomic analysis reveals potential early diagnostic markers in serum of acute cellular rejection after liver transplantation. Transpl Immunol. 2019;53:7‐12. [DOI] [PubMed] [Google Scholar]
- 31. Eberhardt HU, Buhlmann D, Hortschansky P, et al. Human factor H‐related protein 2 (CFHR2) regulates complement activation. PLoS ONE. 2013;8(11):e78617. [DOI] [PMC free article] [PubMed] [Google Scholar]
- 32. DeLeo FR, Siegel C, Hallström T, et al. Complement factor H‐related proteins CFHR2 and CFHR5 represent novel ligands for the infection‐associated CRASP proteins of Borrelia burgdorferi . PLoS ONE. 2010;5(10):e13519. [DOI] [PMC free article] [PubMed] [Google Scholar]
- 33. Huang XF, Wang Y, Li FF, et al. CFHR2‐rs2986127 as a genetic protective marker for acute anterior uveitis in Chinese patients. J Gene Med. 2016;18(8):193‐198. [DOI] [PubMed] [Google Scholar]
- 34. Zhang X, Hou HT, Wang J, Liu XC, Yang Q, He GW. Plasma proteomic study in pulmonary arterial hypertension associated with congenital heart diseases. Sci Rep. 2016;6:36541. [DOI] [PMC free article] [PubMed] [Google Scholar]


