Abstract
Background:
In non-small cell lung cancer (NSCLC), fluorodeoxyglucose positron emission tomography (FDG-PET) assists in diagnosis, staging, and evaluating treatment response. One parameter of FDG-PET, the maximum standard uptake value (SUVm), is considered an objective measure of glucose uptake. However, little is known about the fate of glucose in FDG-avid lung tumors in vivo. The objective is to use stable glucose isotope tracing to determine if the SUVm predicts glycolytic metabolism, or other glucose fates in tumors.
Methods:
In this prospective IRB-approved clinical trial, 52 untreated potentially-resectable confirmed NSCLC patients underwent FDG-PET computed tomography. During surgery, the patients were infused with 13C-glucose. Blood, tumor (T) and normal lung (NL) samples were analyzed by mass spectrometry to determine 13C enrichment in glycolytic intermediates. These values were compared with clinical parameters including SUVm, maximum tumor diameter (TD), stage, grade, and MIB1/Ki67 proliferation index.
Results:
For each patient, 13C-enrichment in each metabolite was compared between tumor and adjacent lung. Although all tumors metabolized glucose, SUVm did not correlate with glycolytic intermediate labeling. Rather, SUVm correlated with markers indicating the use of other respiratory substrates, including lactate, and with the proliferation index.
Conclusions:
SUVm does not correlate with glycolytic metabolism in human NSCLC, but does correlate with the proliferation index, suggesting that SUVm predicts glucose use by pathways other than glycolysis. These pathways may offer alternative therapeutic targets, including biosynthetic pathways required for cell proliferation. The research techniques in this study offer the opportunity to understand the relationships between SUVm, tumor metabolism, and therapeutic vulnerabilities in human NSCLCs.
Introduction:
Positron emission tomography either alone or combined with computed tomography (PET-CT) is a standard component of the clinical evaluation for lung cancer (1). According to lung cancer guidelines, PET is recommended to assess the primary lesion and screen for metastases within and outside the thorax (2). The standard uptake value maximum (SUVm), visual acuity, and radiological character of the suspicious area are evaluated to determine the presence of malignancy (3). It has been presumed high SUVm values reflect metabolically active lesions with enhanced flow through pathways producing energy and/or macromolecules relative to adjacent tissues and tumors with lower SUVm values.
18Fluoro-2-deoxyglucose (FDG) is the most common tracer used in PET. It has several favorable characteristics that make it useful for clinical cancer imaging. First, FDG does not passively enter tissues; rather, it must use membrane transport proteins such as the glucose transporters (GLUTs) (4). Second, phosphorylation of FDG renders the tracer incapable of export back to the extracellular space. Third, the glucose transporters and hexokinase enzymes that transport and phosphorylate FDG tend to be over-expressed in solid tumors relative to adjacent tissue (1). These factors culminate in high imaging contrast for many cancer types, including lung cancer.
Reprogrammed metabolism is a hallmark of cancer (5). Altered activity of key metabolic pathways, particularly those contributing to energy formation, macromolecular synthesis and redox homeostasis, enable malignant cells to proliferate at high rates (6). The most common metabolic alteration in malignant tissue cultured ex vivo is constitutive glucose uptake and preferential production of lactate, termed the Warburg Effect (7). However, despite a large literature on regulation of cancer cell glycolysis and the Warburg Effect in culture, we still know little about glucose metabolism in human tumors in vivo. Furthermore, glucose carbons can supply several metabolic pathways, including hexosamine biosynthesis(8), redox balance and nucleotide generation via the pentose phosphate pathway(9), and the generation of acetyl-CoA for fatty acid synthesis(10). In particular, we are not aware of previous studies that have directly tested whether FDG-PET predicts tumor glycolysis as opposed to any of the other numerous metabolic fates of glucose (Figure 1B).
Figure 1: Study design and protocol.
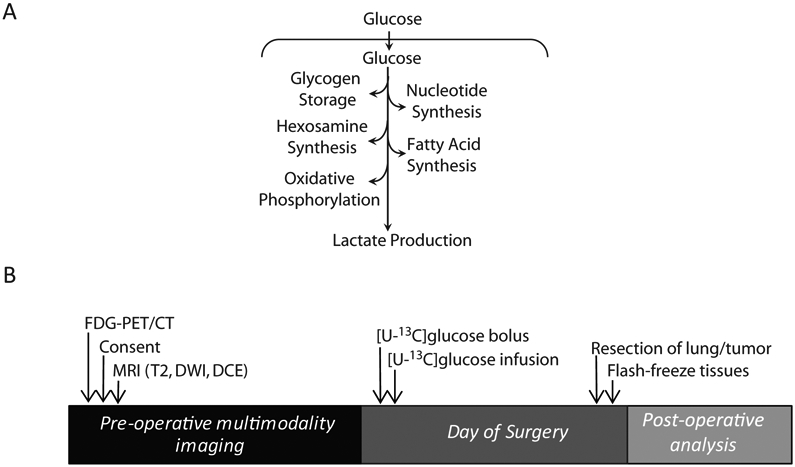
Study design of patient imaging, infusion and analysis. FDG-PET/CT-fluorodeoxyglucose positron emission tomogram - computed tomogram; [U-13C]glucose-ubiquitously labeled 13C glucose. B) Schematic of the potential fates of glucose in a tumor. Glucose carbons are used in multiple energy-producing and biosynthetic pathways.
We designed a prospective study to radiologically and metabolically analyze human non-small cell lung cancers (NSCLC) (11). In this study, we recruited patients with solitary lung lesions referred for surgical resection after having been assessed by FDG-PET. During surgery, in vivo tumor metabolism was analyzed by infusing the patient with glucose labeled with the stable isotope 13C (13C-glucose). This allows the tumor and surrounding lung to take up the labeled glucose and distribute the 13C label into downstream metabolites as a consequence of metabolic activity within the tissues. Tissue samples were immediately frozen upon surgical resection, then metabolites were extracted for mass spectrometry analysis of 13C enrichment. Surprisingly, from our preliminary analysis for trends, SUVm did not correlate with 13C enrichment in glycolytic intermediates extracted from tumor tissue, indicating a disconnect between clinical PET imaging and tumor glycolysis. Here we perform a formal retrospective investigation within the prospective trial to determine if NSCLC SUVm correlated with other aspects of tumor biology and metabolism.
PATIENTS AND METHODS
Study Design and Population
Patients were recruited to an institutional review board-approved prospective trial using imaging and 13C nutrient tracing to evaluate primary NSCLC. Requirements for inclusion include lack of prior cancer treatment, having had a PET-CT, and lesions 0.6 cm or larger believed to be amenable to surgical resection. Most patients under-went robotic lobectomies. A single patient sample was obtained using CT-guided biopsy. Data from consecutive patients was collected from March 2013 to October 2018.
18FDG PET Scans
All PET scans were analyzed by the same physician, including scans obtained offsite. Patients were injected intravenously with a weight-based dose of 18F-FDG of 5.7 MBq/kg (minimum 370 MBq, maximum 740 MBq). Images were acquired approximately 60 minutes later using a Siemens Biograph 64 (2007) PET/CT Scanner (Siemens Healthcare). Non-contrast CT images were concurrently acquired for anatomic correlation with PET images. CT parameters were 120 kVp, fixed 200 mAS, head and neck (3mm) and body (5mm) slice thicknesses were used, pitch 0.8, rotation time 0.5 sec. Maximum standardized uptake values (SUVm) were calculated with the formula SUVm = maximum tissue activity of FDG / (injected dose of FDG x patient body weight). Data was analyzed using a Syngo.Via station using automated gradient-based segmentation method.
13C infusions
Sterile, pyrogen-free [U-13C]glucose (Cambridge Isotope, Isotec) was administered as a bolus of 8g over 10 minutes followed by 4 or 8g/hr infusion through a peripheral intravenous line (PIV). This infusion in effect replaces the anesthesia administration of dextrose, thus limiting the deviation from standard surgical practice. Blood glucose is monitored throughout the infusion to ensure normoglycemia. Infusions generally proceeded for at least two hours prior to tumor resection. Blood draws occurred approximately every 30 minutes, from either a contralateral PIV or an arterial line, to analyze 13C enrichment.
Metabolite Measurement
Plasma (25-50μl) and tissue (5-15mg) were added to 80:20 methanol:water for metabolite extraction. Samples underwent freeze-thaw cycles and were centrifuged at 16,000xg for 10 minutes to precipitate macromolecules. The supernatants were evaporated, then re-suspended in 40μL anhydrous pyridine and added to a pre-prepared GC/MS autoinjector vials containing 80μl N-(tert-butyldimethylsilyl)-N-methyltrifluoroacetamide (MTBSTFA) derivatization reagent. The samples were incubated at 70°C for 1 hour. 1μl aliquots were injected for analysis. Samples were analyzed using either an Agilent 6890 or 7890 gas chromatograph coupled to an Agilent 5973N or 5975C Mass Selective Detector, respectively. The observed distributions of mass isotopologues were corrected for natural abundance. Corrected abundances are shown as the percent of pool enriched for labeled metabolite (i.e., glucose m+6).
Immunohistochemistry
All pathology slides were reviewed by a fellowship-trained chest pathologist and stage was determined according to the College of American Pathology assessment of lung cancer (12). H&E slides were scanned in an Aperio scanoscope and analyzed by Aperio Imagescope software. Slides were stained with MIB-1 and quantified. Tumor and stromal content was determined using pancytokeratin AE1/AE3 stain. All histological analyses were conducted by surgical pathologists blinded to the results of the metabolic study.
Statistics
Routine statistical analyses performed on the collected data. Statistical differences were evaluated using Spearman correlation analysis in PRISM software.
RESULTS
Patient Demographics
Fifty-two patients were included in this analysis. Patients in this cohort were a mean age of 68 (range 43-85) and 62% were women. 70% of the patients had a smoking history (mean 38 pack years, range 10-120). The mean pathological tumor size was 2 cm diameter (range 1-13 cm). The most common histological subtype was adenocarcinoma (65%). The mean SUVm was 7.7 (range 1-29; 11 tumors were ≤ 2.5) (Table 1).
Table 1: Patient demographics and tumor characteristics.
Age at the time of surgery, Gender, Smoking (pack-years). Pathological Stage, Grade, Pathological Maximum diameter, Histologic Subtype, Maximum Standard Uptake Value (SUVm), 13C Glucose Fractional Enrichment of Tumor relative to Normal Lung, MIB1(Ki67) proliferation index measured as a %. LNEC, Large Cell Neuroendocrine Carcinoma. SQCC, Squamous cell carcinoma.
| Characteristic | Patients (n=52) |
|---|---|
| Age at Entry, | |
| Median (range) years | 68 (43-85) |
| Sex | |
| Male | 20 |
| Female | 32 |
| Smoking History | |
| Never | 16 |
| Pack Years, median (range) | 38 (10-120) |
| Stage | |
| 1 | 24 |
| 2 | 22 |
| 3 | 6 |
| Grade | |
| 1 | 13 |
| 2 | 28 |
| 3 | 9 |
| 4 | 2 |
| Size, median (range), cm | 2 (1-13) |
| Subtype | |
| Adenocarcinoma | 34 |
| LNEC | 1 |
| SQCC | 6 |
| Carcinoid | 5 |
| Adenosquamous | 4 |
| Pleomorphic | 2 |
| SUVm | |
| Mean (range) | 7.7(1-29) |
| 13C Glucose Enrichment | |
| Mean (range) | 0.32(0.03-0.59) |
| Histology | |
| MIB1, % Positive Mean (range) | 16(0.6-80) |
13C-Glucose infusions result in a range of tumor metabolite labeling, but SUVm does not correlate with labeling of metabolites from glycolysis
Patients underwent the prospective trial as designed (Figure 1A), with the objective to determine if the SUVm predicts glycolytic metabolism, or other glucose fates in tumors (Figure 1B). On the day of surgery, patients were infused with [U-13C]glucose (i.e. glucose labeled on all 6 carbon with 13C) so that labeling in downstream intermediates from glycolysis and other pathways could be detected to infer metabolic activity (Figure 2A). In the plasma, patients approached steady state 13C enrichment by two hours, with a final average glucose enrichment of ~ 45% (Figure 2B).
Figure 2:
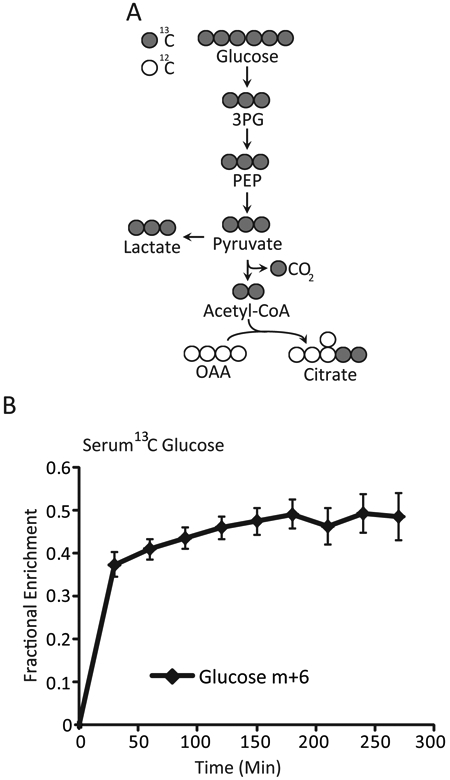
A) Concept of Mass Spectroscopy to Assess the Glycolytic Pathway Intermediates 13C-labeled glucose tracing strategy. Isotopically labeled 13C carbons (grey) can be distinguished from naturally occurring 12C (open circles) by mass spectrometry. The incorporation of [U-13C]glucose into unlabeled glucose pools is expressed as percent enrichment. 3PG-3-phosphoglycerate; PEP-phosphoenolpyruvate; OAA-oxaloacetate B) Results of Serum Glucose Enrichment with 13C Glucose Serum enrichment of glucose m+6 ([U-13C]) from the time of initial infusion. Data are expressed as average and SEM. Glucose m+6-represents the % of glucose molecules that all of the carbons in glucose are labeled 13C.
The tumors displayed a wide range of SUVm values, and a wide range of 13C enrichment in glucose extracted from the tumor samples (Figure 3A). We sought to compare the SUVm values obtained by PET analysis with 13C enrichment in glycolytic metabolites, following the logic that these two values would positively correlate with each other if SUVm indicates a high glycolytic rate as generally assumed. Surprisingly, there was a weak but significant negative correlation between SUVm and labeled glucose in the tumor fragments (Figure 3B), and no correlation between SUVm and labeling in two intermediates from distal glycolysis, 3-phosphoglycerate and phosphoenolpyruvate (data not shown; R2=0.01 for each). These findings indicate that glycolytic activity, as defined by labeling of glucose and glycolytic intermediates from blood-borne [U-13C]glucose, is not predicted by SUVm. We next compared SUVm with glucose enrichment across several tumor markers, including grade, stage, and histological subtype. Increases in SUVm were associated with higher tumor grade (Figure 3C), whereas the opposite is observed with glucose enrichment (Figure 3D). Similarly, increased SUVm was observed with advanced tumor stage (Figure 3E), whereas no discernable trend is observed with glucose enrichment (Figure 3F). Lastly, tumor histology displayed distinct SUVm trends (Figure 3G), whereas glucose enrichment was not markedly different (Figure 3H).
Figure 3:
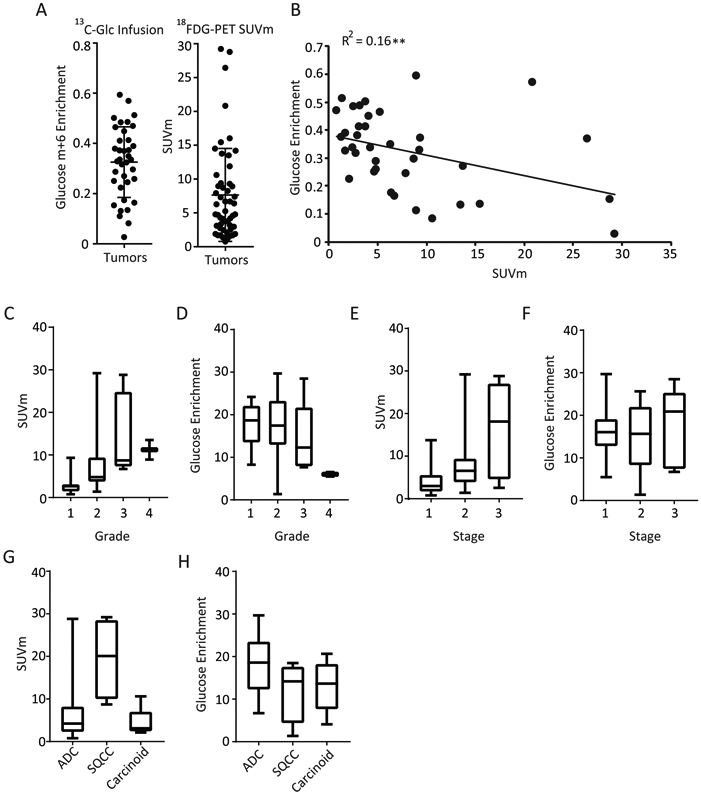
A) 13C Glucose Enrichment(Glucose m+6) and Standard Uptake Value Maximum (SUVm) in 52 Study Patients [U-13C]glucose values of all tumor fragments is expressed as percent enrichment of the glucose pool (left). SUVm values of patients as determined by PET-CT (right). Data are expressed as average ± SD. B) Tumor Standard Uptake Value Maximum (SUVm) compared with Tumor 13C Glucose Enrichment Correlation of [U-13C]glucose enrichment vs. SUVm. Statistics are calculated by Spearman correlation co-efficient. ** p<0.01. C-D) SUVm values (C) and glucose enrichment (D) of the tumor as shown by grade. E-F) SUVm values (E) and glucose enrichment (F) of the tumor as shown by stage. G) SUVm and glucose compared by histology. C-H) Data are expressed as median with first and third quartiles. Error bars represent min and max values.
18FDG-PET avidity is indicative of a proliferative tumor phenotype
We also compared SUVm with other clinical parameters. Interestingly, SUVm correlated positively correlated with MIB1/Ki-67 staining, a marker of cell proliferation, which ranged from 0-80% in these tumors (Figure 4A). This observation indicates that despite the lack of connection between SUVm and glycolysis, a pathway usually associated with rapid tumor cell proliferation, tumors with high SUVm values do contain a high content of proliferating cancer cells. Similarly, increased tumor size positively correlates with SUVm (Figure 4B). SUVm did correlate positively with another marker of tumor metabolism. As previously shown with a smaller cohort, we find that SUVm positively correlates with the ratio of 13C labeling in Lactate/3-phosphoglycerate. We have previously used this metabolic marker as a surrogate for uptake of lactate from the blood (Figure 4C)(13).
Figure 4:
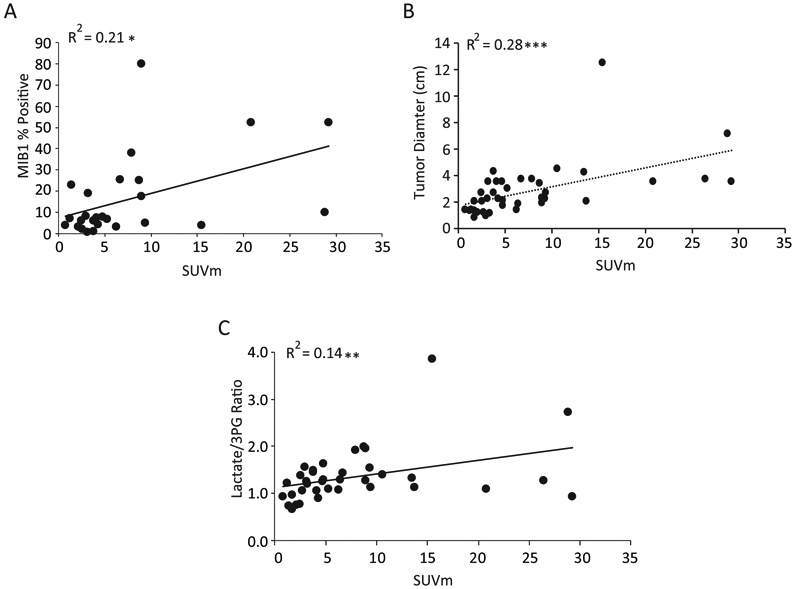
A) Standard Uptake Value maximum (SUVm) correlates with %MIB1 Staining (cell proliferation) and tumor size. Correlation analysis of SUVm with the cell proliferation marker MIB1. B) Correlation analysis of SUVm with tumor diameter. Statistics are calculated by Spearman correlation co-efficient. *p<0.05. C) High Standard Uptake Value Maximum (SUVm) is a predictor of Lactate Levels Relative to Phosphoglycerate (3PG). The lactate/3pg ratio is expressed as fractional enrichment of lactate/fractional enrichment of 3PG. Values above 1 indicate lactate uptake. SUVm positively correlates with the lactate/3PG ratio. Statistics are calculated by Spearman correlation co-efficient. ** p<0.01.
COMMENT
This study is the first to combine quantitative 18FDG-PET analysis with quantitative 13C-glucose tracing to compare SUVm with glycolytic metabolism. We demonstrate that under the conditions used to analyze glycolytic metabolism in this study, 18FDG avidity did not correlate with metabolic turnover of glycolytic intermediates derived from 13C-glucose during the surgical procedure to remove the tumor. This lack of congruence between SUVm and glycolytic intermediate labeling may be related to the fact that PET signal captures 18FDG uptake, but does not differentiate among the many possible fates of glucose carbon (11, 14-16).
Interestingly, SUVm did correlate with other markers of lung tumor metabolism. Tumors with high SUVm values tended to have increased lactate/3PG labeling ratios, which we have used as a surrogate for uptake of lactate from the bloodstream by the tumor. Importantly, this labeling feature has previously been shown to predict disease progression in human NSCLC (13), making it important to fully understand the relationship between 18FDG uptake and lactate metabolism. Our data suggest that tumors with high SUVm are clinically aggressive and engage pathways other than glycolysis, which has commonly been viewed as the dominant feature of metabolic reprogramming in cancer. We speculate that malignant cells within tumors with high SUVm use glucose to supply pathways that generate cell biomass, promote growth, and overcome barriers to metastasis (Figure 5). One example of such a pathway is the pentose phosphate pathway, which generates ribose sugars for nucleic acid synthesis and NADPH as a means to combat oxidative stress. This pathway is important in metastasis, as oxidative stress resistance has previously been shown to be a limiting factor for successful metastasis in mouse models of melanoma (17). Ongoing work will determine whether SUVm correlates with flux through the pentose phosphate pathway and other aspects of glucose metabolism.
Figure 5: High SUVm from FDG-PET may feed biomass and growth.
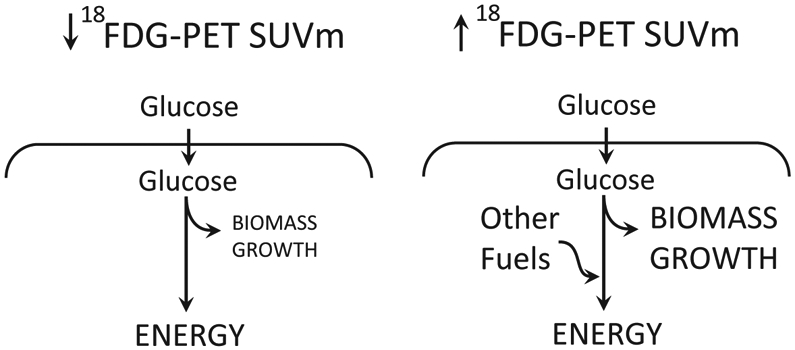
Representation of the high and low FDG-PET interpretations.
Some limitations of our approach and opportunities for further study are worth considering briefly. First, an important limitation is that metabolites must be extracted from tumor fragments composed of heterogeneous mixtures of malignant and non-malignant cells. It is not possible at present to determine how distinct cell populations within this mixture contribute to FDG uptake or 13C labeling. Second, we assume that these tumor fragments do not contain large, non-exchanging pools of glycolytic intermediates that would reduce 13C labeling in these metabolites and mask high glycolytic rates in a subset of cells. Third, the surgical procedure introduces a brief period during which the tumor is removed from the blood supply (~1 minute) before freezing. It is possible that labeling in glucose and glycolytic intermediates is lost during this period, although we emphasize that the same approach detects very high labeling in glycolytic intermediates in clear cell renal cell carcinomas (18).
The findings suggest several ways to address these limitations and maximize information yield from these tumors. First, we are applying advanced metabolomics techniques to fully capture all 13C-labeled intermediates. Second, we are using multiparametric magnetic resonance imaging (MRI) to characterize tumor heterogeneity and to quantify aspects of biology that may impact metabolism; these include tissue perfusion assessed by dynamic contrast enhancement, and tissue density assessed by the apparent diffusion coefficient derived from diffusion-weighted imaging. Finally, the availability of 11C as a PET tracer allows us to label a variety of nutrients to compare their uptake to that of FDG; furthermore, placement of the 11C radionuclide at different carbon positions within the labeled nutrient provides information about tracer metabolism in the tumor.
The finding that the SUVm appears not to reflect enhanced glycolysis in NSCLC is clinically important, because tumors with elevated SUVm appear to be more advanced with more lymph nodes and nodal stations involved(19). Patients with these tumors also have poorer survival, emphasizing the importance of understanding the metabolic significance of avid FDG uptake. The long-standing perception equating FDG accumulation with glycolytic hyperactivity was not directly tested with an in vivo assessment of metabolic flux until now. We find that SUVm correlates with enhanced tumor cell proliferation, perhaps consistent with the aggressive clinical behavior of these tumors. A key question emerging from these studies is how therapies that reduce SUVm alter the pathways of glucose metabolism in NSCLC. Presumably the pathways suppressed in this context are the same ones that support cell proliferation and could be good candidates for the development of future metabolic therapies.
A broader assessment of metabolic pathways in vivo may also have therapeutic value. Although glucose is a major fuel in most tissues, many metabolic pathways are not fed by carbon from glucose, and therefore the infusion approach reported here cannot report on those pathways. To date, we have used 13C-glucose, 13C-acetate, and 13C-lactate as intra-operative tracers in human cancer. Additional tracers labeled with 13C, 15N, 2H, and perhaps other isotopes will shed light on other parts of the metabolic networks in these tumors. Recent literature has suggested several potential clinical targets identified from metabolic analysis in lung cancer. These include serine biosynthesis and pemetrexed sensitivity(20), genotype-specific liabilities such as CB-839 and KEAP1 (21), and pyrimidine synthesis in KRAS/LKB1 co-mutants (22). Taken together, these studies suggest that understanding cancer metabolism in vivo may lead to future therapeutic targets, and that intra-operative isotope tracing provides information about tumor metabolism that currently cannot be obtained through other methods.
ACKNOWLEDGEMENTS
K.H.K. is the Robert Tucker Hayes Chair in Cardiothoracic Surgery. R.J.D. is the Robert L. Moody Sr Faculty Scholar at UT Southwestern and a Howard Hughes Medical Investigator. He is funded by the NIH (R35CA220449). K.H.K and R.J.D received a Translational Research Award from the V foundation.
Footnotes
DISCLOSURES
RJD serves as a member of the scientific advisory board for Agios Pharmaceuticals.
Meeting Presentation: This paper was presented at the 65th Annual Meeting of the Southern Thoracic Surgical Association on November 8, 2018 in Amelia Island, Florida
REFERENCES
- 1.Gambhir SS. 2002. Nat Rev Cancer 2: 683–93 [DOI] [PubMed] [Google Scholar]
- 2.Postmus PE, Kerr KM, Oudkerk M, Senan S, Waller DA, et al. 2017. Ann Oncol 28: iv1–iv21 [DOI] [PubMed] [Google Scholar]
- 3.Fischer BM, Mortensen J, Hojgaard L. 2001. Lancet Oncol 2: 659–66 [DOI] [PubMed] [Google Scholar]
- 4.Goodwin J, Neugent ML, Lee SY, Choe JH, Choi H, et al. 2017. Nat Commun 8: 15503. [DOI] [PMC free article] [PubMed] [Google Scholar]
- 5.Hanahan D, Weinberg RA. 2011. Cell 144: 646–74 [DOI] [PubMed] [Google Scholar]
- 6.Vander Heiden MG, Cantley LC, Thompson CB. 2009. Science 324: 1029–33 [DOI] [PMC free article] [PubMed] [Google Scholar]
- 7.Warburg O, Wind F, Negelein E. 1927. J Gen Physiol 8: 519–30 [DOI] [PMC free article] [PubMed] [Google Scholar]
- 8.Wellen KE, Lu C, Mancuso A, Lemons JM, Ryczko M, et al. 2010. Genes Dev 24: 2784–99 [DOI] [PMC free article] [PubMed] [Google Scholar]
- 9.Li F, Han X, Li F, Wang R, Wang H, et al. 2015. Cancer Cell 27: 698–711 [DOI] [PMC free article] [PubMed] [Google Scholar]
- 10.Rohrig F, Schulze A. 2016. Nat Rev Cancer 16: 732–49 [DOI] [PubMed] [Google Scholar]
- 11.Hensley CT, Faubert B, Yuan Q, Lev-Cohain N, Jin E, et al. 2016. Cell 164: 681–94 [DOI] [PMC free article] [PubMed] [Google Scholar]
- 12.Butnor KJ BM, Dacic S, Berman M, Flieder D, Jones K, Okby NT, Roffli VL, Suster S, Tazelaar HD, Travis WD. 2017. College of American Pathologists 4.0.0.3: 1–16 [Google Scholar]
- 13.Faubert B, Li KY, Cai L, Hensley CT, Kim J, et al. 2017. Cell 171: 358–71 e9 [DOI] [PMC free article] [PubMed] [Google Scholar]
- 14.Fan TW, Lane AN, Higashi RM, Farag MA, Gao H, et al. 2009. Mol Cancer 8: 41. [DOI] [PMC free article] [PubMed] [Google Scholar]
- 15.Sellers K, Fox MP, Bousamra M 2nd, Slone SP, Higashi RM, et al. 2015. J Clin Invest 125: 687–98 [DOI] [PMC free article] [PubMed] [Google Scholar]
- 16.Davidson SM, Papagiannakopoulos T, Olenchock BA, Heyman JE, Keibler MA, et al. 2016. Cell Metab 23: 517–28 [DOI] [PMC free article] [PubMed] [Google Scholar]
- 17.Piskounova E, Agathocleous M, Murphy MM, Hu Z, Huddlestun SE, et al. 2015. Nature 527: 186–91 [DOI] [PMC free article] [PubMed] [Google Scholar]
- 18.Courtney KD, Bezwada D, Mashimo T, Pichumani K, Vemireddy V, et al. 2018. Cell Metab [DOI] [PMC free article] [PubMed] [Google Scholar]
- 19.Nambu A, Kato S, Sato Y, Okuwaki H, Nishikawa K, et al. 2009. Ann Nucl Med 23: 269–75 [DOI] [PubMed] [Google Scholar]
- 20.Chen P-H, Cai L, Huffman K, Yang C, Kim J, et al. 2019. [Google Scholar]
- 21.Romero R, Sayin VI, Davidson SM, Bauer MR, Singh SX, et al. 2017. Nat Med 23: 1362–8 [DOI] [PMC free article] [PubMed] [Google Scholar]
- 22.Kim J, Hu Z, Cai L, Li K, Choi E, et al. 2017. Nature 546: 168–72 [DOI] [PMC free article] [PubMed] [Google Scholar]


