

Abstract
Accurate mapping of transcription start sites (TSSs) is key for understanding transcriptional regulation. However, current protocols for genome-wide TSS profiling are laborious and/or expensive. We present Survey of TRanscription Initiation at Promoter Elements with high-throughput sequencing (STRIPE-seq), a simple, rapid, and cost-effective protocol for sequencing capped RNA 5′ ends from as little as 50 ng total RNA. Including depletion of uncapped RNA and reaction cleanups, a STRIPE-seq library can be constructed in about 5 h. We show application of STRIPE-seq to TSS profiling in yeast and human cells and show that it can also be effectively used for quantification of transcript levels and analysis of differential gene expression. In conjunction with our ready-to-use computational workflows, STRIPE-seq is a straightforward, efficient means by which to probe the landscape of transcriptional initiation.
Understanding the spatiotemporal control of transcriptional initiation hinges on accurate identification of transcription start sites (TSSs) and coregulated clusters of TSSs, commonly referred to as transcription start regions (TSRs). Usage of alternative TSSs is widespread (Davuluri et al. 2008; Reyes and Huber 2018) and results in mRNAs with shortened or lengthened 5′ untranslated regions (5′ UTRs), which can lead to the inclusion or exclusion of sequence elements such as upstream open reading frames (uORFs), which alter mRNA stability and translational efficiency (Calvo et al. 2009; Barbosa et al. 2013; Wang et al. 2016; Kurihara et al. 2018). Large-scale shifts in TSS usage are also prevalent in various developmental contexts (Batut et al. 2013; Haberle et al. 2014; Zhang et al. 2017; Adiconis et al. 2018; Danks et al. 2018) as well as human cancers (Thorsen et al. 2011; Demircioğlu et al. 2019) and inflammatory bowel diseases (Boyd et al. 2018).
Because of the importance of TSS selection to the regulation of gene expression, several methods for global TSS profiling have been developed. The most frequently cited method is cap analysis of gene expression (CAGE) (Shiraki et al. 2003), wherein total RNA is reverse transcribed and 5′-complete cDNA:RNA hybrids are isolated via oxidation and biotinylation of the 5′ 7-methylguanosine (m7G) cap and streptavidin pulldown followed by the generation of adapter-ligated cDNA libraries. In conjunction with high-throughput sequencing, CAGE has been extensively used to characterize the landscape of transcription initiation across numerous species (Valen et al. 2009; Hoskins et al. 2011; Nepal et al. 2013; Andersson et al. 2014; The FANTOM Consortium and the RIKEN PMI and CLST (DGT) 2014; Lizio et al. 2017; Kurihara et al. 2018). Despite extensive revisions to the CAGE protocol over the years since its introduction (Kodzius et al. 2006; Takahashi et al. 2012; Murata et al. 2014), the method remains costly and laborious, with a high total RNA input requirement. The standard CAGE protocol has recently been adapted to low input via selectively degradable carrier oligos as super low-input carrier CAGE (SLIC-CAGE), but this approach further increases the complexity, cost, and time associated with the protocol (Cvetesic et al. 2018) (see Supplemental Fig. S25 and Supplemental Table S4 for cost and time estimates of TSS profiling methods). An alternative cap-trapping approach, MAPCap, uses immunoprecipitation with an anti-m7G antibody for capped RNA isolation (Bhardwaj et al. 2019). Notably, MAPCap works well with as little as 100 ng total RNA input.
A number of other TSS profiling methods use an oligo capping approach, which involves enzymatic removal of the m7G cap and replacement with a synthetic oligo, allowing selection of 5′-complete cDNAs (Suzuki and Sugano 2003; Wakaguri et al. 2007; Yamashita et al. 2011). Methods incorporating oligo capping include paired-end analysis of TSSs (PEAT) (Ni et al. 2010), transcript leader sequencing (TL-seq) (Arribere and Gilbert 2013), transcript isoform sequencing (TIF-seq) (Pelechano et al. 2013), CapSeq (Gu et al. 2012), simultaneous mapping of RNA ends (SMORE-seq) (Park et al. 2014), and global/precision run-on sequencing of capped RNAs (GRO-/PRO-cap) (Core et al. 2014). However, oligo capping methods suffer from drawbacks including high-input RNA requirements (e.g., 30 µg in the case of Arabidopsis PEAT [Morton et al. 2014]) and the sequence biases of RNA ligases used to attach oligo caps (Hafner et al. 2011; Jayaprakash et al. 2011).
Another staple molecular approach in TSS mapping is template-switching reverse transcription (TSRT), which leverages the propensity of MMLV-derived reverse transcriptases to act as terminal transferases, adding a few nontemplated nucleotides, usually 1–3 Cs, when they reach the capped 5′ end of RNA molecules (Schmidt and Mueller 1999). A template-switching oligo (TSO) bearing three riboguanosine residues (rGrGrG) at its 3′ end can then anneal to this CCC overhang, allowing template switching to add an adapter sequence to the 5′ end of the cDNA (Zhu et al. 2001). TSS mapping methods incorporating TSRT include 5′ serial analysis of gene expression (5′ SAGE) (Zhang and Dietrich 2005), nano-cap analysis of gene expression (nanoCAGE 2010/2017) (Plessy et al. 2010; Poulain et al. 2017), single-cell tagged reverse transcription (STRT) (Islam et al. 2011), RNA annotation and mapping of promoters for the analysis of gene expression (RAMPAGE) (Batut et al. 2013), Tn5Prime (Cole et al. 2018), and parallel analysis of RNA 5′ ends from low input (nanoPARE) (Schon et al. 2018). Although TSRT provides additional specificity for mRNA 5′ ends, library complexity is often limited by artifacts such as concatemerization of TSOs from secondary template-switching events, erroneous template switching, and high PCR cycle requirements (Kapteyn et al. 2010; Turchinovich et al. 2014). Some TSRT-based methods (RAMPAGE, nanoCAGE 2017, and nanoPARE) also require custom sequencing primers, complicating pooling of other sample types in the same sequencing lane.
Thus, despite the successful application of TSS profiling methods to identify transcriptionally active elements on a genome-wide basis (Djebali et al. 2012; Andersson et al. 2014), their wider adoption is limited by barriers of expense, technical difficulty, and time. To overcome these hurdles, we introduce a new method: Survey of TRanscription Initiation at Promoter Elements with high-throughput sequencing (STRIPE-seq). STRIPE-seq addresses several concerns of efficiency and bias inherent in other methods through a specially designed TSO, a stringent bead purification scheme, and various other methodological considerations (Fig. 1; Supplemental Fig. S1). Requiring only a TSRT reaction and PCR amplification following enzymatic depletion of uncapped RNA, STRIPE-seq is a simple and cost-effective protocol that can be performed in any molecular biology laboratory in approximately half a working day. We also provide an end-to-end bioinformatic workflow available via GitHub code download or as a containerized package in a ready-to-use Singularity image (Kurtzer et al. 2017) to facilitate interoperability for straightforward and reproducible analysis of STRIPE-seq data. We envision that the simplicity of the STRIPE-seq protocol, in conjunction with our ready-to-use computational workflow, will lead to the widespread adoption of TSS profiling as a standard approach in studies of transcriptional regulation.
Figure 1.

Schematic illustration of the STRIPE-seq method. Briefly, total RNA is treated with Terminator 5′-phosphate-dependent exonuclease (TEX) to reduce the proportion of uncapped RNA present in the sample. After a 1-h incubation, template-switching reverse transcription (TSRT) is performed using a barcoded reverse transcription oligo (RTO) primed with a random pentamer, followed by the addition of a unique molecular identifier (UMI)-containing, 5′-biotin-modified template-switching oligo (TSO) with three 3′ riboguanosines that permit the annealing of the oligo to the untemplated triplet Cs that are generated by reverse transcriptase when it reaches the m7G cap. Library PCR is then performed using the cleaned TSRT product as input, which ensures that TruSeq adapters are present on both sides of the insert (blue line). The cap-adjacent base, which identifies the transcription start site (TSS), is identified using the signature sequence [N8]-TATAGGG in the R1 read. Once the library PCR step is completed and cleaned, the STRIPE-seq library is then submitted for sequencing on an Illumina platform.
Results
Design of STRIPE-seq
STRIPE-seq library construction relies on three enzymatic steps: depletion of uncapped RNA (predominantly rRNA) from total RNA using Terminator exonuclease (TEX), TSRT, and library PCR. For TSRT, we designed custom reverse transcription oligonucleotides (RTOs) based on the Illumina TruSeq P7 barcode adapter and a custom TSO based on the Illumina TruSeq P5 adapter (Supplemental Fig. S2; Supplemental Results). TSO introduction into the RT reaction was withheld until 5 min into the extension step, allowing synthesis of 5′-complete first-strand cDNA to reduce TSO invasion and internal priming (Turchinovich et al. 2014). The introduction of barcodes during TSRT facilitates pooling of samples before library PCR. Following TSRT, a solid phase reversible immobilization (SPRI) bead-based size selection is performed to remove TSO/RTO dimers and small fragment inserts. After second-strand cDNA synthesis, library PCR, and a two-step reaction cleanup/size selection to remove excessively small and large fragments, the library is ready for Illumina sequencing. Because STRIPE-seq relies on bead-based size selection to optimize the size distribution of the final library, only a single round of PCR is necessary, compared with the two rounds of PCR used in tagmentation-based TSS mapping methods such as nanoCAGE 2017, Tn5Prime, and nanoPARE.
STRIPE-seq provides high-resolution maps of the yeast initiation landscape
We first tested the STRIPE-seq library construction protocol with three relatively modest quantities of budding yeast total RNA (50, 100, and 250 ng). Biological replicate libraries were highly consistent, with a size distribution from ∼200–1000 bp and a library amount of 25–100 ng with very little oligo dimer present (Supplemental Fig. S3). No library was generated in control reactions lacking input RNA, indicating that the bio-TSO has a low potential for concatemerization and generation of artifactual libraries (Supplemental Fig. S3). We then sequenced each library and performed a number of quality control steps before and after alignment using our specifically developed computational workflow, GoSTRIPES (Supplemental Fig. S4; Supplemental Results; Supplemental Methods). Final accepted read pairs numbered between 270,815 and 739,857, which amounts to 8.8%–20.4% of the initial input pairs. A substantial fraction of removed read pairs corresponded to rRNA, and rRNA contamination increased as more total RNA was used as input for STRIPE-seq library construction. Additionally, many read pairs were marked as PCR duplicates and removed, suggesting oversequencing of libraries (Supplemental Table S1; Supplemental Results). Indeed, sequencing saturation analysis suggested little gain in information beyond ∼2 million mappable sequenced read pairs (Supplemental Fig. S5). Following processing with GoSTRIPES, we detected TSSs using TSRchitect. Collectively, GoSTRIPES and TSRchitect represent an end-to-end pipeline for TSS identification that we term TSRbuild (Supplemental Methods).
To determine a read number threshold for STRIPE-seq analysis, we assessed the promoter-proximal fraction of TSSs, with a promoter definition of −250 to +100 bp relative to annotated gene starts. At a threshold of 3 counts per TSS, the nine STRIPE-seq samples yielded promoter-proximal fractions of 0.723–0.88, with 4314–5075 genes having at least one unique TSS (Fig. 2A; Supplemental Fig. S6). Increasing the threshold beyond 3 counts slightly increased the promoter-proximal fraction for each sample but resulted in a substantial loss of genes with a unique TSS. For instance, increasing the threshold to 4 increased the promoter-proximal fraction of 100-ng replicate 1 from 0.851 to 0.878 but decreased the number of genes with a unique promoter-proximal TSS from 4710 to 4354. We thus consider a threshold of 3 counts per TSS to be a suitable balance between removal of likely artifacts and retention of unique TSSs potentially associated with weakly expressed genes. Using this threshold, we assessed the reproducibility of STRIPE-seq TSS signal. We normalized TSS counts using the trimmed mean of M-values (TMM) method (Robinson and Oshlack 2010), determined Pearson correlation coefficients between samples, and hierarchically clustered the results. This analysis revealed high concordance between replicates derived from a single input amount (Pearson's r = 0.938–0.961) as well as strong correlation between data sets generated from different input amounts (Pearson's r = 0.919–0.957) (Fig. 2B). Given the strong correlations between STRIPE-seq replicate TSSs, we present the results of analysis of a single 100-ng sample in the main figures while showing analysis of all replicates in the Supplemental Material.
Figure 2.

STRIPE-seq captures the yeast initiation landscape. (A) Plot of the fraction of unique TSSs that are promoter-proximal (−250 to +100 bp relative to an annotated gene start) at or above the indicated read threshold. Dot color is indicative of the number of genes with a promoter-proximal TSS. Corresponding plots for all STRIPE-seq samples are presented in Supplemental Figure S6. (B) Hierarchically clustered heatmap of Pearson's r values for pairwise comparisons between TSSs identified in STRIPE-seq samples. Before clustering, samples were thresholded such that each TSS had to have at least 3 raw counts in one sample, and then counts were TMM normalized. (C) Genomic distribution of TSSs in 100-ng STRIPE-seq replicate 1 broken into quintiles by TSS strength. The “promoter” annotation indicates −250 to +100 relative to an annotated gene start and “downstream” refers to the 3 kb downstream from a 3′ gene end. Genomic distributions of TSSs for all STRIPE-seq samples are presented in Supplemental Figure S7. (D) Density plot of 100-ng STRIPE-seq replicate 1 unique TSS positions relative to annotated gene starts. (E) Genome browser tracks showing CPM-normalized STRIPE-seq (replicate 1 for each input amount) and poly(A)+ RNA-seq (replicate 1) at two representative regions of the yeast genome. (F) Sequence logos of TSSs detected in 100-ng STRIPE-seq replicate 1 broken into quintiles by TSS strength. Sequence logos of TSSs in all STRIPE-seq samples are presented in Supplemental Figure S9. (G) Nucleotide color plot of the sequence context of TSSs detected in 100-ng STRIPE-seq replicate 1. TSSs are ranked descending by read count. (H) Dinucleotide frequencies at TSSs detected in 100-ng STRIPE-seq replicate 1. Dinucleotide frequencies at TSSs in all STRIPE-seq samples are presented in Supplemental Figure S10.
We first performed a more detailed analysis of the genomic distribution of TSSs detected by STRIPE-seq. Division of TSS distribution into quintiles based on read count revealed that the strongest TSSs were most likely to be promoter-proximal, with progressively smaller promoter-proximal fractions as TSS strength decreased (Fig. 2C; Supplemental Fig. S7). A density plot of unique TSS positions relative to annotated gene starts also revealed a strong promoter-proximal preference (Fig. 2D). We then inspected TSS signal and matched poly(A)+ RNA-seq data at individual genomic regions. At the GCN4 locus, we observed RNA-seq signal extending nearly 600 bp upstream of the start codon, where a TSR was found (Fig. 2E). This observation is consistent with translational regulation of the GCN4 mRNA by four uORFs (Mueller and Hinnebusch 1986). At the AIM39 locus, we found a TSR downstream from the annotated start codon, with no upstream RNA-seq signal (Fig. 2E), suggesting misannotation of the AIM39 start codon. Indeed, comparison of STRIPE-seq and RNA-seq signal to ribosome profiling (Ribo-seq) data (Nissley et al. 2016) revealed strong ribosome occupancy downstream from the AIM39 TSR and 5′ end of the associated RNA-seq signal (Supplemental Fig. S8).
We next analyzed the sequence context of STRIPE-seq-detected TSSs. Consistent with previous work (Zhang and Dietrich 2005), we detected a consensus A−8Y−1R+1 motif (Fig. 2F,G; Supplemental Fig. S9). Through sequence analysis of TSS quintiles divided by TSS strength, we observed that the information content of the A−8 base decreased as TSS strength diminished (Fig. 2F), consistent with the previously described positive relationship between this position and TSS usage (Zhang and Dietrich 2005). Last, we analyzed the dinucleotide frequencies at TSSs identified by STRIPE-seq. All replicates identified the four possible Y−1R+1 combinations (CA, TG, TA, and CG) as the most prevalent initiator dinucleotides (Fig. 2H; Supplemental Fig. S10), consistent with previous data (Lu and Lin 2019).
It has been previously reported in traditional CAGE and TSRT-based protocols such as nanoCAGE that extra spurious bases, especially guanosines (corresponding to cytosines in the first-strand cDNA), are sometimes present at the 5′ most position of the R1 read (Harbers and Carninci 2005; Carninci et al. 2006; Kawaji et al. 2014; Cumbie et al. 2015). Furthermore, a recent in-depth analysis of TSRT showed an almost universal addition of an extra cytosine on the cDNA adjacent to the TSS of capped RNA, but almost no addition of this base in uncapped RNA, which is speculated to occur owing to the cap acting as a template for reverse transcriptase (Wulf et al. 2019). In CAGE and nanoCAGE-based analysis, rates of addition for these extra bases are often inferred from those that were not incidentally templated onto the reference genome, but rather soft-clipped (marked as having no match to the reference genome) by the alignment software (Haberle et al. 2015). For the STRIPE-seq read pairs surviving the initial quality control steps, ∼50%–70% had soft-clipped bases on the 5′ end of the R1 read, a majority of which only had one or two additional bases added (Supplemental Fig. S11). Most of the added bases on the first-strand cDNA were cytosine, with a much smaller fraction of thymidine (Supplemental Fig. S12). These values are consistent with what is seen in the SLIC-CAGE and nanoCAGE samples analyzed and are consistent with previous literature (Zajac et al. 2013; Cumbie et al. 2015; Wulf et al. 2019). Taken together, these observations indicate that STRIPE-seq effectively and comprehensively profiles the yeast initiation landscape.
Quantification of transcript levels with STRIPE-seq
As the primary focus of STRIPE-seq is profiling of initiation events, our analyses thus far have focused on the 5′-most base of sequenced R1 reads. However, TSRT-based methods are routinely used for general quantification of annotated transcripts in bulk and single-cell RNA-seq (Picelli et al. 2013; Turchinovich et al. 2014). Because we sequenced STRIPE-seq libraries in paired-end mode, each sample retains additional information on transcript origin owing to the presence of reverse (i.e., R2) reads usually originating from within transcript bodies. Thus, assignment of paired-end STRIPE-seq fragments to transcripts could in principle be used to more accurately measure transcript abundance. To test this possibility, we assessed the correlation between STRIPE-seq and poly(A)+ RNA-seq signal within annotated transcripts. We observed robust correlations between all STRIPE-seq and RNA-seq samples (Spearman's ρ = 0.786–0.846) (Fig. 3). Correlations improved when more total RNA was used as input, likely because of capture of more moderately expressed transcripts.
Figure 3.
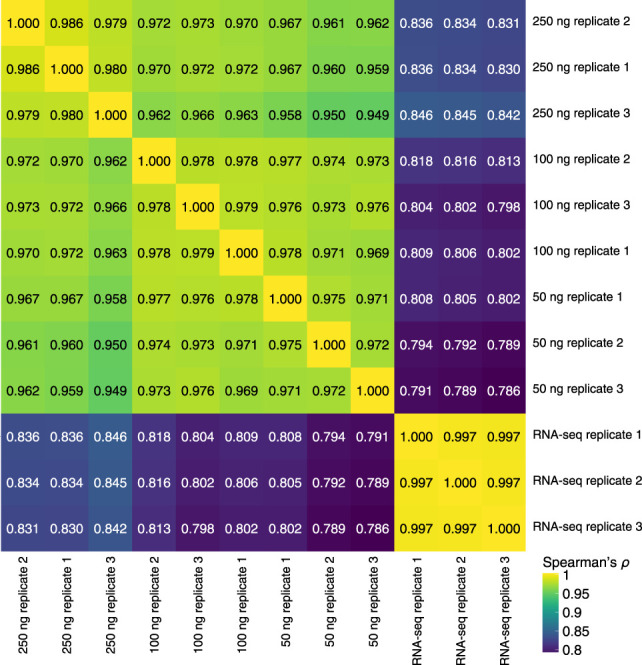
STRIPE-seq provides RNA-seq-like information on transcript abundance. Hierarchically clustered heatmap of Spearman's ρ values for pairwise comparisons between TMM-normalized per-gene STRIPE-seq and poly(A)+ RNA-seq fragment counts.
Systematic comparison of yeast STRIPE-seq with CAGE-based methods
A previous study used three distinct iterations of CAGE (nanoCAGE, nAnT-iCAGE, and SLIC-CAGE) (Cvetesic et al. 2018) to profile the initiation landscape of yeast. This work established high concordance between nAnT-iCAGE and SLIC-CAGE while suggesting inferior performance of nanoCAGE in detecting TSSs. We thus set out to systematically compare STRIPE-seq to these methods. To this end, we compared our nine STRIPE-seq samples to two replicate 100-ng SLIC-CAGE data sets and two replicate data sets each for nanoCAGE using 500 or 25 ng input RNA with or without TEX treatment, respectively. As with STRIPE-seq, a threshold of at least 3 counts per TSS provided a suitable balance between promoter-proximal TSS fraction and number of genes with a unique TSS in SLIC-CAGE and nanoCAGE data sets (Supplemental Fig. S13). Duplicate removal was not possible for SLIC-CAGE or nanoCAGE, as both methods were sequenced in single-end mode and the UMI for the nanoCAGE samples was removed before deposition. We first assessed correlation between all three methods in a conservative promoter window of −250 to +100 bp relative to the annotated start codons of 6572 mRNA transcripts. We observed good correlation between STRIPE-seq and SLIC-CAGE signal at promoters (Spearman's ρ = 0.708–0.743) (Fig. 4A). Although STRIPE-seq and nanoCAGE both rely on TSRT, correlations between STRIPE-seq and nanoCAGE were weaker than those between STRIPE-seq and SLIC-CAGE (Spearman's ρ = 0.609–0.680) (Fig. 4A). Visual inspection of TSS signal at selected loci revealed high similarity between STRIPE-seq and SLIC-CAGE, with similar patterns of TSS distributions and higher TSR complexity relative to nanoCAGE (Fig. 4B).
Figure 4.

Comparison of yeast STRIPE-seq to SLIC-CAGE and nanoCAGE. (A) Hierarchically clustered heatmap of Spearman's ρ values for pairwise comparisons of STRIPE-seq, SLIC-CAGE, and nanoCAGE signal within promoter regions (−250 to +100 bp relative to an annotated gene start). Before clustering, samples were thresholded such that each promoter had to have at least 3 raw counts in one sample, and then counts were TMM normalized. (B) Genome browser-style tracks showing CPM-normalized STRIPE-seq, SLIC-CAGE, nanoCAGE (replicate 1 for each input amount) and poly(A)+ RNA-seq (replicate 1) at two representative regions of the yeast genome. (C) Dinucleotide frequencies at TSSs detected in the indicated samples. Dinucleotide frequencies at TSSs in all replicates of all technologies are presented in Supplemental Figure S14. (D) Jitter plot of the number of genes with a promoter-proximal TSR in each sample. Error bars represent standard deviation.
We next compared the dinucleotide frequencies of TSSs detected by STRIPE-seq, SLIC-CAGE, and nanoCAGE. STRIPE-seq and SLIC-CAGE both preferentially detected all four Y−1R+1 combinations (CA, TG, TA, and CG), with CA most preferred (Fig. 4C; Supplemental Fig. S14). STRIPE-seq TSSs displayed a slight preference for TG versus SLIC-CAGE TSSs, which were slightly more likely to have a TA dinucleotide. The overall dinucleotide frequency distribution of STRIPE-seq TSSs was much more similar to that of SLIC-CAGE TSSs versus nanoCAGE TSSs, which displayed a strong bias for a TG dinucleotide (Fig. 4C; Supplemental Fig. S14). We next assessed the numbers of genes with a detectable TSR in each method as a means to analyze methodological sensitivity. We associated TSRs with transcripts and then counted the number of transcripts with a promoter-proximal TSR in each sample. In three STRIPE-seq replicates each from 50, 100, and 250 ng of total RNA input, we detected 4591–4980, 5049–5119, and 5228–5494 such transcripts, respectively. With 100-ng input RNA, SLIC-CAGE detected 5265 and 5330 transcripts with promoter-proximal TSRs, and nanoCAGE detected 5057 and 5334 transcripts with a promoter-proximal TSRs at 500 ng and 2985 and 4775 such transcripts at 25 ng (Fig. 4D). We conclude that the sensitivity of STRIPE-seq in TSR discovery is comparable to that of SLIC-CAGE and higher-input nanoCAGE in yeast. We note that a potential limitation of these comparisons between STRIPE-seq, SLIC-CAGE, and nanoCAGE is biological variability: We performed STRIPE-seq in the S288C strain, whereas both previously published CAGE data sets used RNA derived from strain BY4741, an auxotrophic derivative of S288C.
Last, we compared the spatial distribution of TSSs within TSRs detected by STRIPE-seq and CAGE-based methods using the shape index (SI), a measure of TSR shape reflecting the entropy of the distribution of its constituent TSSs (Hoskins et al. 2011). We filtered TSRs with fewer than 10 TSSs to remove potential artifacts from sparse TSRs and then classified TSRs as peaked if they had a SI > −1. Across three replicates each of 50, 100, and 250 ng STRIPE-seq, proportions of peaked TSRs were 77.1%–81.9%, 72.7%–75.9%, and 62%–68.9% (Supplemental Fig. S15). These values were closest to those obtained with SI analysis of SLIC-CAGE, for which peaked TSR proportions of 78.2% and 80.2% were obtained. Both pairs of nanoCAGE data sets displayed substantially higher peaked TSR proportions (92% and 94.9% at 500 ng; 96.2% and 97.2% at 25 ng), indicative of loss of TSR complexity relative to STRIPE-seq and SLIC-CAGE. Taken together, these data indicate that STRIPE-seq effectively captures the complexity of TSS distribution within yeast TSRs. Furthermore, although this analysis indicates that the majority of yeast TSRs are considered peaked based on SI, STRIPE-seq and SLIC-CAGE detect a broad range of SI values, indicating that TSS dispersion is a widespread phenomenon in yeast.
Differential STRIPE-seq analysis identifies changes in yeast TSR usage and transcript abundance
Thus far, we have shown that STRIPE-seq effectively detects yeast TSSs under normal growth conditions. Because a major potential application of this method is the detection of changes in TSS usage between distinct biological conditions, we investigated the capability of STRIPE-seq to detect TSRs altered by diamide-induced oxidative stress. Correlation analysis of TSSs detected in three untreated 100-ng STRIPE-seq replicates and three 100-ng STRIPE-seq replicates derived from cells treated with 1.5 mM diamide for 1 h revealed high within-group concordance (untreated Pearson's r = 0.957–0.958; diamide Pearson's r = 0.942–0.963), but greatly reduced correlation between conditions (Pearson's r = 0.635–0.654) (Fig. 5A), suggesting a widespread shift in TSS usage upon diamide stress. Consistent with this, correlation of untreated and diamide-treated samples within a merged set of 4866 TSRs was also weak compared to within-sample concordance (Pearson's r = 0.651–0.679; untreated Pearson's r = 0.983–0.984; diamide Pearson's r = 0.963–0.989) (Fig. 5A). Visualization of STRIPE-seq and matched RNA-seq signal at HSP150, encoding a cell wall mannoprotein up-regulated by various stressors (Russo et al. 1993), revealed increased TSR usage and transcript abundance as measured by matched poly(A)+ RNA-seq (Fig. 5B). Within the same region we also observed down-regulation of the convergent CIS3 locus (Fig. 5B). We observed reduced TSR usage and RNA-seq signal at the divergent RPS16B and RPL13A genes (Fig. 5B), consistent with the known repression of ribosomal protein gene expression during the environmental stress response (Gasch et al. 2000; Weiner et al. 2012).
Figure 5.

STRIPE-seq captures differential TSR usage and transcript abundance. (A) Hierarchically clustered heatmaps of Pearson's r values for pairwise comparisons between merged TSS and TSR sets from 100-ng control and diamide STRIPE-seq samples. (B) Genome browser-style tracks showing CPM-normalized STRIPE-seq and poly(A)+ RNA-seq from control and diamide-treated samples at two representative regions of the yeast genome. (C) Volcano plot of differential TSRs resulting from comparison of control and diamide-treated samples. (D) Dot plots of GO biological process terms for genes associated with TSRs that increased and decreased upon diamide treatment. (E) Venn diagrams of the overlap between DEGs identified by STRIPE-seq and RNA-seq in control and diamide-treated samples. (F) Cumulative distribution plots for fractions of DEGs captured by STRIPE-seq versus log2(FC) in poly(A)+ RNA-seq.
To systematically characterize differential initiation in diamide-treated yeast, we performed differential TSR analysis using the merged untreated/diamide TSR set. This analysis revealed 986 up-regulated and 1030 down-regulated TSRs at a fold change cutoff of 2 and a FDR threshold of 0.05 (Fig. 5C; Supplemental Table S2). Of these, 756/986 (76.7%) up-regulated and 871/1030 (84.6%) down-regulated TSRs were within the −250 to +100 promoter window (Supplemental Table S2). Gene Ontology (GO) analysis revealed that down-regulated TSRs were strongly enriched for biological processes related to ribosome and rRNA biogenesis (Fig. 5D), again consistent with the general down-regulation of ribosomal protein genes observed during environmental stress (Gasch et al. 2000; Weiner et al. 2012), whereas up-regulated TSRs were enriched for a number of metabolic processes as well as the GO term “oxidation-reduction process” (Fig. 5D). Last, we assessed potential shifts in TSS distribution within TSRs, because it was previously suggested that TSS shifting is a pervasive phenomenon between environmental conditions (Lu and Lin 2019). Using CAGEr (Haberle et al. 2015) to calculate TSS shifts, we detected only four shifted TSRs out of 7373 aggregated TSRs (0.054%) using default parameters. After removing the shifting score threshold but using a FDR threshold of 1 × 10⁻¹⁰, we detected shifts at 73/7373 (0.99%) aggregated TSRs; however, it is difficult to interpret this result given the modest magnitude of most of the observed changes. We conclude that diamide treatment of yeast is not accompanied by large-scale TSS shifting. This finding is consistent with a recent budding yeast CAGE study reporting exceptional stability of TSS positions across four distinct environmental conditions (Börlin et al. 2019).
Because we showed that quantification of STRIPE-seq fragments within transcripts provides measurements of transcript abundance comparable to those determined by RNA-seq (Fig. 3), we next asked if RNA-seq-like analysis of control and diamide STRIPE-seq data sets could provide comparable results to a more conventional differential expression analysis. Correlation analysis of three 100-ng control and three 100-ng diamide-treated STRIPE-seq replicates alongside matched RNA-seq replicates again revealed strong concordance (untreated Spearman's ρ = 0.798–0.818; diamide Spearman's ρ = 0.842–0.850) (Supplemental Fig. S16). Differential expression analysis with STRIPE-seq yielded 714 up-regulated and 886 down-regulated genes, whereas RNA-seq detected 1026 up-regulated and 1158 down-regulated genes (Supplemental Table S3). A total of 1197 up-regulated genes were detected by STRIPE-seq and/or RNA-seq; of these, 543 (45.4%) were shared, 171 (14.3%) were specific to STRIPE-seq, and 483 (40.4%) were specific to RNA-seq (Fig. 5E). We detected a total of 1321 down-regulated genes, with 723 (54.7%) shared between STRIPE-seq and RNA-seq, 163 (12.3%) specific to STRIPE-seq, and 435 (32.9%) specific to RNA-seq (Fig. 5E). Despite the smaller number of differentially expressed genes (DEGs) detected by STRIPE-seq versus RNA-seq, similar biological processes were enriched in up- and down-regulated genes (Supplemental Fig. S17), indicating that RNA-seq-like analysis of STRIPE-seq data can accurately capture overall changes in the cellular transcriptional program. Finally, to probe whether the reduced number of DEGs reported by STRIPE-seq might be attributable to reduced sensitivity, we assessed the cumulative fraction of RNA-seq DEGs detected by STRIPE-seq as a function of the absolute value of the RNA-seq log2(FC). We found that STRIPE-seq captured a large fraction of genes with robust fold changes in RNA-seq but was less likely to detect DEGs with moderate to low fold changes in RNA-seq (Fig. 5F).
STRIPE-seq effectively profiles initiation and transcript abundances in human cells
To explore the utility of STRIPE-seq in analyzing more complex initiation landscapes, we performed STRIPE-seq in human K562 erythroleukemia cells. We constructed three biological replicate STRIPE-seq libraries using 100-ng of total RNA (Supplemental Fig. S3). We obtained 686,981–806,174 accepted read pairs after processing, representing 11%–18.8% of the initial input, with most removed read pairs corresponding to rRNA or PCR duplicates (Supplemental Results; Supplemental Table S1). Saturation analysis suggested undersequencing of K562 STRIPE-seq libraries and that library complexity would benefit from a sequencing depth of 20–30 million mappable fragments (Supplemental Fig. S18). Although not tested directly for human samples, library complexity would likely also benefit from increased input amounts as was seen in the yeast samples. For comparison, we also analyzed K562 CAGE, RAMPAGE, and nanoCAGE-XL data sets (Adiconis et al. 2018). CAGE was the most sensitive method, detecting upward of 15,000 genes with a promoter-proximal TSS at fewer than 10 million mappable fragments (Supplemental Fig. S18). However, the comparison between CAGE and STRIPE-seq is not straightforward, because these CAGE libraries were constructed with the no-amplification nAnT-iCAGE approach and very high input (10 µg), whereas STRIPE-seq uses PCR and low input (100 ng). The most appropriate comparison for STRIPE-seq is RAMPAGE, which uses TSRT, PCR, and the CAGE cap-trapping approach, but with a high RNA input (5 µg). One deeply sequenced RAMPAGE sample detected a few thousand more genes with a promoter-proximal TSS than STRIPE-seq, but a second RAMPAGE replicate appeared essentially identical to STRIPE-seq in this regard (Supplemental Fig. S18).
At a threshold of 3 counts per TSS, we obtained promoter-proximal fractions (defined for these samples as −500 to +500 relative to an annotated TSS) of 0.938–0.942, with 7353–7778 genes having at least one unique STRIPE-seq TSS (Fig. 6A). K562 STRIPE-seq TSSs at a threshold of 3 were highly reproducible (Pearson's r = 0.932–0.937) (Fig. 6B). Consistent with the threshold analysis, the majority of detected TSSs were found within promoter regions, with stronger TSSs displaying a greater promoter bias (Fig. 6C; Supplemental Fig. S19A), an observation also confirmed by density analysis of unique TSS positions relative to annotated TSSs (Fig. 6D). Visual inspection of STRIPE-seq data revealed capture of features reflective of the complexity of the human transcriptome. For instance, at the TBPL1 locus, we observed preferential usage of a TSR that would lead to a short form of its 5′ UTR, a finding supported by visualization of matched poly(A)+ RNA-seq data (Fig. 6E). We also detected initiation at an internal site within the lncRNA-encoding MALAT1 gene (Fig. 6E).
Figure 6.

STRIPE-seq profiling of the human initiation landscape. (A) Plot of the fraction of unique TSSs that are promoter-proximal at the indicated read threshold. Dot color and size are indicative of the number of genes with a promoter-proximal TSS. (B) Heatmap of Pearson's r values for pairwise comparisons between TSSs identified in STRIPE-seq samples. Before clustering, samples were thresholded such that each TSS had to have at least 3 raw counts in one sample, and then counts were TMM normalized. (C) Genomic distribution of TSSs in K562 STRIPE-seq replicate 1 broken into quintiles by TSS strength. Genomic distributions of TSSs for all K562 STRIPE-seq samples are presented in Supplemental Figure S19A. (D) Density plot of K562 STRIPE-seq replicate 1 unique TSS positions relative to annotated TSSs. (E) Genome browser tracks showing CPM-normalized STRIPE-seq and poly(A)+ RNA-seq (replicate 1) at two representative regions of the human genome. (F) Sequence logos of TSSs detected in K562 STRIPE-seq replicate 1 broken into quintiles by TSS read count. Sequence logos of TSSs in all K562 STRIPE-seq samples are presented in Supplemental Figure S19B. (G) Nucleotide color plot of the sequence context of TSSs detected in K562 STRIPE-seq replicate 1. TSSs are ranked descending by read count. (H) Dinucleotide frequencies at TSSs detected in K562 STRIPE-seq replicate 1. Dinucleotide frequencies at TSSs in all STRIPE-seq samples are presented in Supplemental Figure S19C.
We then analyzed the sequences found at STRIPE-seq TSSs. Consistent with previously published CAGE data, we detected a strong Y−1R+1 initiator with a bias for G at the +1 position (Fig. 6F,G; Supplemental Fig. S19B). Notably, the −1 preference for R progressively diminished as weaker TSSs were considered, whereas the +1 bias for R, and G in particular, remained consistent (Fig. 6F). We note that although the Y−1R+1 initiator we report here is consistent with that found by CAGE (Frith et al. 2008), it is distinct from that detected by 5′-GRO-seq (BBCA+1BW) (Vo ngoc et al. 2017), potentially owing to the analysis of steady-state versus nascent transcripts by these methods, respectively. Alternatively, differences in analysis (individual TSS positions for the present analysis of STRIPE-seq data versus identification and characterization of sequences at highly focused, strong TSSs) may contribute to the different sequences detected. Consistent with sequence logo and color plot analysis, four of the five most frequently detected dinucleotides followed the NG pattern (Fig. 6H; Supplemental Fig. S19C). In all methods but nanoCAGE-XL, ∼50%–60% of mapped reads had soft-clipped bases, with the majority of reads only displaying a single added base (Supplemental Fig. S20). Most of the added bases on the first-strand cDNA were cytosine, with a much smaller fraction of thymidine (Supplemental Fig. S21). Because human promoters tend to be more GC rich than those of yeast (Fenouil et al. 2012), it is likely more common for these spurious guanosines to be incidentally templated onto the genome, which would explain the smaller fraction of TSSs having soft-clipped bases compared to yeast in all methods.
We then assessed the ability of STRIPE-seq to measure transcript levels in K562 cells by quantification of fragments within annotated exons compared to matched poly(A)+ RNA-seq data. As observed for yeast, transcript signal for STRIPE-seq and RNA-seq was well correlated (Pearson's r = 0.822–0.835) (Supplemental Fig. S22), indicating that STRIPE-seq can be used for estimation of transcript abundances alongside TSS usage in human cells.
We next compared STRIPE-seq to CAGE, RAMPAGE, and nanoCAGE-XL data generated from K562 cells (Adiconis et al. 2018). We first analyzed correlation between the methods in a promoter window of −500 to +500 bp relative to 152,701 annotated TSSs of protein-coding genes. Within these promoter windows, replicates of each method were well correlated (STRIPE-seq Spearman's ρ = 0.842–0.846; CAGE Spearman's ρ = 0.912; RAMPAGE Spearman's ρ = 0.849) (Fig. 7A). STRIPE-seq signal was also highly correlated with that of CAGE (Spearman's ρ = 0.790–0.805) and RAMPAGE (Spearman's ρ = 0.771–0.798). Of note, these correlations are similar to those between CAGE and RAMPAGE (Spearman's ρ = 0.772–0.804) (Fig. 7A). Poor correlation was observed between nanoCAGE-XL and all other methods. Good correspondence between STRIPE-seq and other methods was observed visually at the shared promoter region of the RARS2 and ORC3 genes (Fig. 7B). The dinucleotide frequencies of TSSs detected by STRIPE-seq were very similar to those found by CAGE and RAMPAGE, whereas no consistent dinucleotide preferences were found for nanoCAGE-XL TSSs (Fig. 7C). Last, as was done for yeast, we assessed the sensitivity of STRIPE-seq relative to CAGE-based methods by calling TSRs and determining the number of transcripts with a promoter-proximal TSR (defined in this analysis as a TSR within −500 to +500 bp of an annotated TSS). With three STRIPE-seq replicates, we detected 8474–9006 transcripts with promoter-proximal TSRs, a lower quantity than were detected in the analyzed CAGE samples (13,076 and 13,903) (Fig. 7D). STRIPE-seq detected fewer proximal TSR-associated transcripts than RAMPAGE replicate 1 (13,266) but more than replicate 2 (7340), potentially because of their different sequencing depths: Replicate 1 had a total of ∼36.4 million reads from two separate runs, whereas replicate 2 yielded ∼5.3 million reads from a single run (Fig. 7D). This observation may suggest that higher sequencing depth is necessary to fully realize the complexity of RAMPAGE libraries (Supplemental Fig. S18).
Figure 7.

Comparison of human STRIPE-seq to CAGE, RAMPAGE, and nanoCAGE-XL. (A) Hierarchically clustered heatmap of Spearman's ρ values for pairwise comparisons of STRIPE-seq, CAGE, RAMPAGE, and nanoCAGE-XL signal within promoter regions (−500 to +500 bp relative to an annotated TSSs). Before clustering, samples were thresholded such that each promoter had to have at least 3 read counts in one sample, and then counts were TMM normalized. (B) Genome browser-style tracks showing CPM-normalized STRIPE-seq, CAGE, RAMPAGE, nanoCAGE-XL (replicate 1 for each input amount), and poly(A)+ RNA-seq (replicate 1) at a representative region of the human genome. (C) Dinucleotide frequencies at TSSs in all replicates of all technologies. (D) Jitter plot of the number of transcripts with a promoter-proximal TSR in each sample. Error bars represent standard deviation.
Last, we analyzed human TSR shape. Across our three K562 STRIPE-seq replicates, we detected peaked TSR proportions of 56.6%–59.5% (Supplemental Fig. S23). Both CAGE and RAMPAGE detected slightly lower peaked fractions (47.1% and 49.1% for CAGE; 48.6% and 53.1% for RAMPAGE). nanoCAGE-XL gave a peaked proportion of 57.7%, although the interpretation of this result is complicated by the fact that nanoCAGE-XL appears to detect unusually large TSRs (Supplemental Fig. S23). These observations indicate that although STRIPE-seq effectively detects a range of TSR shapes in human cells, it has somewhat reduced sensitivity for broad TSRs compared to higher-input CAGE and RAMPAGE. From a biological perspective, our data suggest that TSSs are generally more dispersed in human versus yeast TSRs.
Analysis of promoter-distal TSRs in human cells
Although the majority of TSSs detected by STRIPE-seq in K562 cells are promoter-proximal, a small fraction was located within genes or intergenic regions (Fig. 6C; Supplemental Fig. S19A). Given that enhancers may be transcribed to generate enhancer RNAs (eRNAs) (Lam et al. 2014), we asked whether these distal TSSs were representative of eRNA initiation. To investigate this possibility, we first detected TSRs in K562 STRIPE-seq data and divided them into promoter-proximal (<1 kb from an annotated TSS) and distal (≥1 kb from an annotated TSS) sets. Considering only TSRs present in all three STRIPE-seq replicates, we detected 6648 proximal and 513 distal TRSs. The majority of distal TSRs detected by STRIPE-seq also showed signal in CAGE, RAMPAGE, and nanoCAGE-XL data sets, suggesting that they are unlikely to be artifacts (Supplemental Fig. S24A). We next compared proximal and distal TSRs to a set of 43,119 K562 enhancers from EnhancerAtlas 2.0 (Gao and Qian 2019). Only 310 of 6648 (4.7%) of proximal TSRs overlapped enhancers, but 179 of 513 (34.9%) distal TSRs coincided with annotated enhancers, a significantly higher proportion by Pearson's χ2 test (p = 9.49 × 10−150). Consistent with this, heatmap visualization of histone modification cleavage under targets and tagmentation (CUT&Tag) (Kaya-Okur et al. 2019) enrichment around distal TSRs revealed that a fraction of these sites are highly enriched for H3K4me1 and H3K27ac but not H3K4me3 (Supplemental Fig. S24B), a chromatin signature of active enhancers (Heintzman et al. 2009; Creyghton et al. 2010; Rada-Iglesias et al. 2011; Zentner et al. 2011). These large-scale analyses were confirmed by visual inspection of specific loci. For instance, at a TSR within an intron of LDLRAD3, we observed signal in all analyzed TSS data sets as well as strong H3K4me1 and H3K27ac CUT&Tag signal (Supplemental Fig. S24C). This active enhancer signature was also observed at an intergenic site containing a TSR (Supplemental Fig. S24C). We conclude that, even with modest input (100 ng total RNA), STRIPE-seq can detect a moderate number of eRNAs. The number of putative eRNA TSRs identified here is likely a conservative estimate, because the number of distal TSRs in total is 2948 when a TSR is only required to be present in a single sample. The presence of many single-replicate distal TSRs may be attributable in part to the generally low abundance of eRNAs (De Santa et al. 2010; Rahman et al. 2017).
Discussion
Here, we present STRIPE-seq, a rapid and efficient method for genome-wide profiling of TSSs. Requiring only a TSRT reaction and PCR amplification following depletion of uncapped RNA, STRIPE-seq is a simple and cost-effective protocol that can be performed in any molecular biology laboratory in <5 h for ∼US$11.76/sample. STRIPE-seq thus provides a substantial savings in terms of time and cost versus other TSS profiling methods (Supplemental Fig. S25; Supplemental Table S4). STRIPE-seq incorporates a number of modifications to TSRT-based cDNA 5′ end profiling methods that address concerns related to efficiency and bias (Supplemental Fig. S1). First, to reduce the occurrence of spurious TSSs within gene bodies owing to premature template switching, addition of the TSO is not added until reverse transcription has proceeded for 5 min. Second, to minimize TSO chaining, we rigorously tested TSO sequences for intrinsically low concatemerization potential and modified the 5′ end of the final TSO with biotin. Because we were reproducibly unable to generate STRIPE-seq libraries from oligo-only samples (i.e., no-RNA samples) (Supplemental Fig. S3), these strategies are effective in minimizing TSO concatemerization. Third, we used SPRI bead cleanups rather than tagmentation to optimize the size distribution of the cDNA library, removing the post-tagmentation PCR step necessary in nanoCAGE when ≥50 ng of total RNA are available, and thus minimizing the PCR cycles required for library amplification. In addition to the STRIPE-seq methodology, we provide an end-to-end computational workflow that enables reproducible analysis of STRIPE-seq data. With appropriate modifications to parameters at the alignment and processing steps, TSRbuild can be used to identify TSSs and TSRs from any related mapping technology. Furthermore, we are currently developing an R package, TSRexploreR, that will allow comprehensive exploration of TSSs and TSRs derived from our method and processing workflow.
The major limitation of STRIPE-seq, and indeed any TSRT-based method, is the efficiency of TSRT itself (Wulf et al. 2019). Although we were able to lower the number of PCR cycles required for library amplification relative to related methods using tagmentation or semisuppressive PCR (Poulain et al. 2017), the high frequencies of PCR duplicates in STRIPE-seq libraries are indicative of an upper limit on library complexity with the current iteration of the protocol. Using increasing amounts of yeast total RNA, we observed a positive relationship between the proportion of unique read pairs and the amount of RNA used for library preparation, indicating that library complexity is partially limited by input amount. This is not a practical limitation for STRIPE-seq in budding yeast and would presumably not complicate STRIPE-seq in other organisms with similar numbers of expressed transcripts, as our data indicate comparable sensitivity to both SLIC-CAGE and nanoCAGE. However, STRIPE-seq of more complex transcriptomes may yield fewer transcripts relative to CAGE and deeply sequenced RAMPAGE samples. Thus, in its present form, STRIPE-seq has reduced sensitivity in large transcriptomes relative to current high-input gold-standard methods at low to moderate sequencing depths. However, given the simplicity and rapidity of the protocol, its low cost, and modest input requirements, we think that it will be broadly useful and a practical approach for exploring transcription initiation on a global scale. Future development of STRIPE-seq will focus on improving TSRT efficiency to increase the complexity of the initial cDNA pool to overcome this problem. A recent rigorous examination of TSRT parameters (Wulf et al. 2019) may provide some improvements in this area. For instance, adding excess dCTP to a TSRT reaction was shown to almost double TSRT efficiency.
An exciting potential application of STRIPE-seq is TSS profiling in precious clinical or developmental samples from which only modest quantities of RNA are available. We found that STRIPE-seq can reliably generate libraries from as little as 50 ng of total RNA. Assuming a total RNA content of 1–50 pg per mammalian cell (Han and Lillard 2000; Livesey 2003; Islam et al. 2011), STRIPE-seq could, in its present form, be used with the amount of RNA extracted from fewer than 50,000 such cells, depending on yield. Furthermore, we envision that, in conjunction with methodologies for single-cell isolation and lysis such as those used in Smart-seq2 (Picelli et al. 2013), STRIPE-seq could be adapted for single-cell profiling of TSSs. The demonstrated sensitivity of STRIPE-seq for low-abundance and/or unstable transcripts such as eRNAs could also potentially be enhanced by using nascent rather than total RNA as input for library preparation. Furthermore, the addition of barcodes during the TSRT reaction opens the possibility of pooling samples after this step, allowing simultaneous processing of multiple STRIPE-seq samples to further save on cost and time. Last, given the simplicity of the STRIPE-seq method, we anticipate that some or all of the protocol could be automated to enhance throughput.
Methods
Biological samples
Yeast strain S288C was grown in YPD medium at 30°C under constant agitation. Where indicated, cells were treated with 1.5 mM diamide under the same growth conditions for 1 h. Yeast total RNA was extracted with the MasterPure Yeast RNA Purification Kit (Lucigen MPY03100) per the manufacturer's protocol. Human K562 cells were grown in DMEM + 10% FBS and 1× penicillin/streptomycin at 37°C with 5% CO2. K562 total RNA was extracted with TRIzol (Invitrogen) per the manufacturer's protocol, treated with DNase I, and purified using RNAClean XP beads (Beckman Coulter) at a beads:sample ratio of 1.8:1 per the manufacturer's protocol.
STRIPE-seq library preparation
Terminator exonuclease (TEX) treatment of total RNA, TSRT, and library PCR were performed as described in the Supplemental Methods. See Supplemental Table S5 for RTO and TSO sequences. A step-by-step STRIPE-seq library construction protocol is available at protocols.io (https://www.protocols.io/view/stripe-seq-library-construction-bdtri6m6) and as a Supplemental Protocol. STRIPE-seq libraries were sequenced for 150 cycles in paired-end mode on the Illumina NextSeq 500 platform at the Indiana University Center for Genomics and Bioinformatics (CGB). See the Supplemental Methods for further considerations on sequencing STRIPE-seq libraries.
RNA-seq
Total RNA (10 µg) was used to generate poly(A)+ libraries with the Illumina TruSeq Stranded mRNA Library Prep kit. Libraries were prepared by the CGB and sequenced as for STRIPE-seq samples.
Data analysis
Our analysis of STRIPE-seq and RNA-seq data is comprehensively described in the Supplemental Methods.
Public data sets
All raw data sets were obtained from the NCBI Sequence Read Archive (SRA) using the accession numbers listed in Supplemental Table S6. Yeast Ribo-seq WIG files were obtained from NCBI Gene Expression Omnibus (GEO) (GSM1949550/1) (Nissley et al. 2016). Chromosome names in the Ribo-seq WIG files were converted from UCSC to Ensembl format (e.g., chrI to I) using the Linux command sed s/ = chr/ = /g to permit display in Gviz.
Data access
All raw and processed sequencing data generated in this study have been submitted to the NCBI Gene Expression Omnibus (GEO; https://www.ncbi.nlm.nih.gov/geo/) under accession number GSE142524. Scripts used to perform all analyses described here are available at GitHub (https://github.com/zentnerlab/STRIPE-seq; also see Supplemental Methods) and as Supplemental Code.
Competing interest statement
R.A.P. and G.E.Z. are listed as inventors on a provisional patent application that has been filed for the STRIPE-seq methodology.
Supplementary Material
Acknowledgments
We thank Jie Huang, Nathan Keith, and David Miller for assistance with development and testing of the STRIPE-seq library construction protocol and Sungyun Kang for K562 cell culture. This work was supported by the Indiana Clinical and Translational Sciences Institute, funded in part by grant UL1 TR001108 from the National Institutes of Health, National Center for Advancing Translational Sciences, Clinical and Translational Sciences Award to R.T.R., National Science Foundation grant IOS-1221984 to V.P.B., and Indiana University startup funds and National Institutes of Health grant R35GM128631 to G.E.Z. R.T.R. was partially supported by National Institutes of Health grant 5R35GM122566.
Author contributions: R.A.P. developed the method and performed all experiments. R.A.P., V.P.B., and G.E.Z. analyzed the data. R.A.P., R.T.R., and V.P.B. wrote software. R.A.P., R.T.R., V.P.B., and G.E.Z. interpreted the results and wrote the manuscript.
Footnotes
[Supplemental material is available for this article.]
Article published online before print. Article, supplemental material, and publication date are at http://www.genome.org/cgi/doi/10.1101/gr.261545.120.
References
- Adiconis X, Haber AL, Simmons SK, Levy Moonshine A, Ji Z, Busby MA, Shi X, Jacques J, Lancaster MA, Pan JQ, et al. 2018. Comprehensive comparative analysis of 5′-end RNA-sequencing methods. Nat Methods 15: 505–511. 10.1038/s41592-018-0014-2 [DOI] [PMC free article] [PubMed] [Google Scholar]
- Andersson R, Gebhard C, Miguel-Escalada I, Hoof I, Bornholdt J, Boyd M, Chen Y, Zhao X, Schmidl C, Suzuki T, et al. 2014. An atlas of active enhancers across human cell types and tissues. Nature 507: 455–461. 10.1038/nature12787 [DOI] [PMC free article] [PubMed] [Google Scholar]
- Arribere JA, Gilbert WV. 2013. Roles for transcript leaders in translation and mRNA decay revealed by transcript leader sequencing. Genome Res 23: 977–987. 10.1101/gr.150342.112 [DOI] [PMC free article] [PubMed] [Google Scholar]
- Barbosa C, Peixeiro I, Romão L. 2013. Gene expression regulation by upstream open reading frames and human disease. PLoS Genet 9: e1003529 10.1371/journal.pgen.1003529 [DOI] [PMC free article] [PubMed] [Google Scholar]
- Batut P, Dobin A, Plessy C, Carninci P, Gingeras TR. 2013. High-fidelity promoter profiling reveals widespread alternative promoter usage and transposon-driven developmental gene expression. Genome Res 23: 169–180. 10.1101/gr.139618.112 [DOI] [PMC free article] [PubMed] [Google Scholar]
- Bhardwaj V, Semplicio G, Erdogdu NU, Manke T, Akhtar A. 2019. MAPCap allows high-resolution detection and differential expression analysis of transcription start sites. Nat Commun 10: 3219 10.1038/s41467-019-11115-x [DOI] [PMC free article] [PubMed] [Google Scholar]
- Börlin CS, Cvetesic N, Holland P, Bergenholm D, Siewers V, Lenhard B, Nielsen J. 2019. Saccharomyces cerevisiae displays a stable transcription start site landscape in multiple conditions. FEMS Yeast Res 19: foy128. 10.1093/femsyr/foy128 [DOI] [PMC free article] [PubMed] [Google Scholar]
- Boyd M, Thodberg M, Vitezic M, Bornholdt J, Vitting-Seerup K, Chen Y, Coskun M, Li Y, Lo BZS, Klausen P, et al. 2018. Characterization of the enhancer and promoter landscape of inflammatory bowel disease from human colon biopsies. Nat Commun 9: 1661 10.1038/s41467-018-03766-z [DOI] [PMC free article] [PubMed] [Google Scholar]
- Calvo SE, Pagliarini DJ, Mootha VK. 2009. Upstream open reading frames cause widespread reduction of protein expression and are polymorphic among humans. Proc Natl Acad Sci 106: 7507–7512. 10.1073/pnas.0810916106 [DOI] [PMC free article] [PubMed] [Google Scholar]
- Carninci P, Sandelin A, Lenhard B, Katayama S, Shimokawa K, Ponjavic J, Semple CAM, Taylor MS, Engström PG, Frith MC, et al. 2006. Genome-wide analysis of mammalian promoter architecture and evolution. Nat Genet 38: 626–635. 10.1038/ng1789 [DOI] [PubMed] [Google Scholar]
- Cole C, Byrne A, Beaudin AE, Forsberg EC, Vollmers C. 2018. Tn5Prime, a Tn5 based 5′ capture method for single cell RNA-seq. Nucleic Acids Res 46: e62 10.1093/nar/gky182 [DOI] [PMC free article] [PubMed] [Google Scholar]
- Core LJ, Martins AL, Danko CG, Waters C, Siepel A, Lis JT. 2014. Analysis of nascent RNA identifies a unified architecture of initiation regions at mammalian promoters and enhancers. Nat Genet 46: 1311–1320. 10.1038/ng.3142 [DOI] [PMC free article] [PubMed] [Google Scholar]
- Creyghton MP, Cheng AW, Welstead GG, Kooistra T, Carey BW, Steine EJ, Hanna J, Lodato MA, Frampton GM, Sharp PA, et al. 2010. Histone H3K27ac separates active from poised enhancers and predicts developmental state. Proc Natl Acad Sci 107: 21931–21936. 10.1073/pnas.1016071107 [DOI] [PMC free article] [PubMed] [Google Scholar]
- Cumbie JS, Ivanchenko MG, Megraw M. 2015. NanoCAGE-XL and CapFilter: an approach to genome wide identification of high confidence transcription start sites. BMC Genomics 16: 597 10.1186/s12864-015-1670-6 [DOI] [PMC free article] [PubMed] [Google Scholar]
- Cvetesic N, Leitch HG, Borkowska M, Müller F, Carninci P, Hajkova P, Lenhard B. 2018. SLIC-CAGE: high-resolution transcription start site mapping using nanogram-levels of total RNA. Genome Res 28: 1943–1956. 10.1101/gr.235937.118 [DOI] [PMC free article] [PubMed] [Google Scholar]
- Danks GB, Navratilova P, Lenhard B, Thompson EM. 2018. Distinct core promoter codes drive transcription initiation at key developmental transitions in a marine chordate. BMC Genomics 19: 164 10.1186/s12864-018-4504-5 [DOI] [PMC free article] [PubMed] [Google Scholar]
- Davuluri RV, Suzuki Y, Sugano S, Plass C, Huang THM. 2008. The functional consequences of alternative promoter use in mammalian genomes. Trends Genet 24: 167–177. 10.1016/j.tig.2008.01.008 [DOI] [PubMed] [Google Scholar]
- Demircioğlu D, Cukuroglu E, Kindermans M, Nandi T, Calabrese C, Fonseca NA, Kahles A, Lehmann KV, Stegle O, Brazma A, et al. 2019. A pan-cancer transcriptome analysis reveals pervasive regulation through alternative promoters. Cell 178: 1465–1477.e17. 10.1016/j.cell.2019.08.018 [DOI] [PubMed] [Google Scholar]
- De Santa F, Barozzi I, Mietton F, Ghisletti S, Polletti S, Tusi BK, Muller H, Ragoussis J, Wei CL, Natoli G. 2010. A large fraction of extragenic RNA Pol II transcription sites overlap enhancers. PLoS Biol 8: e1000384 10.1371/journal.pbio.1000384 [DOI] [PMC free article] [PubMed] [Google Scholar]
- Djebali S, Davis CA, Merkel A, Dobin A, Lassmann T, Mortazavi A, Tanzer A, Lagarde J, Lin W, Schlesinger F, et al. 2012. Landscape of transcription in human cells. Nature 489: 101–108. 10.1038/nature11233 [DOI] [PMC free article] [PubMed] [Google Scholar]
- The FANTOM Consortium and the RIKEN PMI and CLST (DGT). 2014. A promoter-level mammalian expression atlas. Nature 507: 462–470. 10.1038/nature13182 [DOI] [PMC free article] [PubMed] [Google Scholar]
- Fenouil R, Cauchy P, Koch F, Descostes N, Cabeza JZ, Innocenti C, Ferrier P, Spicuglia S, Gut M, Gut I, et al. 2012. CpG islands and GC content dictate nucleosome depletion in a transcription-independent manner at mammalian promoters. Genome Res 22: 2399–2408. 10.1101/gr.138776.112 [DOI] [PMC free article] [PubMed] [Google Scholar]
- Frith MC, Valen E, Krogh A, Hayashizaki Y, Carninci P, Sandelin A. 2008. A code for transcription initiation in mammalian genomes. Genome Res 18: 1–12. 10.1101/gr.6831208 [DOI] [PMC free article] [PubMed] [Google Scholar]
- Gao T, Qian J. 2019. EnhancerAtlas 2.0: an updated resource with enhancer annotation in 586 tissue/cell types across nine species. Nucleic Acids Res 48: D58–D64. 10.1093/nar/gkz980 [DOI] [PMC free article] [PubMed] [Google Scholar]
- Gasch AP, Spellman PT, Kao CM, Carmel-Harel O, Eisen MB, Storz G, Botstein D, Brown PO. 2000. Genomic expression programs in the response of yeast cells to environmental changes. Mol Biol Cell 11: 4241–4257. 10.1091/mbc.11.12.4241 [DOI] [PMC free article] [PubMed] [Google Scholar]
- Gu W, Lee HC, Chaves D, Youngman EM, Pazour Gregory J, Conte D, Mello Craig C. 2012. CapSeq and CIP-TAP identify Pol II start sites and reveal capped small RNAs as C. elegans piRNA precursors. Cell 151: 1488–1500. 10.1016/j.cell.2012.11.023 [DOI] [PMC free article] [PubMed] [Google Scholar]
- Haberle V, Li N, Hadzhiev Y, Plessy C, Previti C, Nepal C, Gehrig J, Dong X, Akalin A, Suzuki AM, et al. 2014. Two independent transcription initiation codes overlap on vertebrate core promoters. Nature 507: 381–385. 10.1038/nature12974 [DOI] [PMC free article] [PubMed] [Google Scholar]
- Haberle V, Forrest ARR, Hayashizaki Y, Carninci P, Lenhard B. 2015. CAGEr: precise TSS data retrieval and high-resolution promoterome mining for integrative analyses. Nucleic Acids Res 43: e51 10.1093/nar/gkv054 [DOI] [PMC free article] [PubMed] [Google Scholar]
- Hafner M, Renwick N, Brown M, Mihailović A, Holoch D, Lin C, Pena JTG, Nusbaum JD, Morozov P, Ludwig J, et al. 2011. RNA-ligase-dependent biases in miRNA representation in deep-sequenced small RNA cDNA libraries. RNA 17: 1697–1712. 10.1261/rna.2799511 [DOI] [PMC free article] [PubMed] [Google Scholar]
- Han F, Lillard SJ. 2000. In-situ sampling and separation of RNA from individual mammalian cells. Anal Chem 72: 4073–4079. 10.1021/ac000428g [DOI] [PubMed] [Google Scholar]
- Harbers M, Carninci P. 2005. Tag-based approaches for transcriptome research and genome annotation. Nat Methods 2: 495–502. 10.1038/nmeth768 [DOI] [PubMed] [Google Scholar]
- Heintzman ND, Hon GC, Hawkins RD, Kheradpour P, Stark A, Harp LF, Ye Z, Lee LK, Stuart RK, Ching CW, et al. 2009. Histone modifications at human enhancers reflect global cell-type-specific gene expression. Nature 459: 108–112. 10.1038/nature07829 [DOI] [PMC free article] [PubMed] [Google Scholar]
- Hoskins RA, Landolin JM, Brown JB, Sandler JE, Takahashi H, Lassmann T, Yu C, Booth BW, Zhang D, Wan KH, et al. 2011. Genome-wide analysis of promoter architecture in Drosophila melanogaster. Genome Res 21: 182–192. 10.1101/gr.112466.110 [DOI] [PMC free article] [PubMed] [Google Scholar]
- Islam S, Kjällquist U, Moliner A, Zajac P, Fan JB, Lönnerberg P, Linnarsson S. 2011. Characterization of the single-cell transcriptional landscape by highly multiplex RNA-seq. Genome Res 21: 1160–1167. 10.1101/gr.110882.110 [DOI] [PMC free article] [PubMed] [Google Scholar]
- Jayaprakash AD, Jabado O, Brown BD, Sachidanandam R. 2011. Identification and remediation of biases in the activity of RNA ligases in small-RNA deep sequencing. Nucleic Acids Res 39: e141 10.1093/nar/gkr693 [DOI] [PMC free article] [PubMed] [Google Scholar]
- Kapteyn J, He R, McDowell ET, Gang DR. 2010. Incorporation of non-natural nucleotides into template-switching oligonucleotides reduces background and improves cDNA synthesis from very small RNA samples. BMC Genomics 11: 413 10.1186/1471-2164-11-413 [DOI] [PMC free article] [PubMed] [Google Scholar]
- Kawaji H, Lizio M, Itoh M, Kanamori-Katayama M, Kaiho A, Nishiyori-Sueki H, Shin JW, Kojima-Ishiyama M, Kawano M, Murata M, et al. 2014. Comparison of CAGE and RNA-seq transcriptome profiling using clonally amplified and single-molecule next-generation sequencing. Genome Res 24: 708–717. 10.1101/gr.156232.113 [DOI] [PMC free article] [PubMed] [Google Scholar]
- Kaya-Okur HS, Wu SJ, Codomo CA, Pledger ES, Bryson TD, Henikoff JG, Ahmad K, Henikoff S. 2019. CUT&Tag for efficient epigenomic profiling of small samples and single cells. Nat Commun 10: 1930 10.1038/s41467-019-09982-5 [DOI] [PMC free article] [PubMed] [Google Scholar]
- Kodzius R, Kojima M, Nishiyori H, Nakamura M, Fukuda S, Tagami M, Sasaki D, Imamura K, Kai C, Harbers M, et al. 2006. CAGE: cap analysis of gene expression. Nat Methods 3: 211–222. 10.1038/nmeth0306-211 [DOI] [PubMed] [Google Scholar]
- Kurihara Y, Makita Y, Kawashima M, Fujita T, Iwasaki S, Matsui M. 2018. Transcripts from downstream alternative transcription start sites evade uORF-mediated inhibition of gene expression in Arabidopsis. Proc Natl Acad Sci 115: 7831–7836. 10.1073/pnas.1804971115 [DOI] [PMC free article] [PubMed] [Google Scholar]
- Kurtzer GM, Sochat V, Bauer MW. 2017. Singularity: scientific containers for mobility of compute. PLoS One 12: e0177459 10.1371/journal.pone.0177459 [DOI] [PMC free article] [PubMed] [Google Scholar]
- Lam MTY, Li W, Rosenfeld MG, Glass CK. 2014. Enhancer RNAs and regulated transcriptional programs. Trends Biochem Sci 39: 170–182. 10.1016/j.tibs.2014.02.007 [DOI] [PMC free article] [PubMed] [Google Scholar]
- Livesey FJ. 2003. Strategies for microarray analysis of limiting amounts of RNA. Brief Funct Genomics 2: 31–36. 10.1093/bfgp/2.1.31 [DOI] [PubMed] [Google Scholar]
- Lizio M, Deviatiiarov R, Nagai H, Galan L, Arner E, Itoh M, Lassmann T, Kasukawa T, Hasegawa A, Ros MA, et al. 2017. Systematic analysis of transcription start sites in avian development. PLoS Biol 15: e2002887 10.1371/journal.pbio.2002887 [DOI] [PMC free article] [PubMed] [Google Scholar]
- Lu Z, Lin Z. 2019. Pervasive and dynamic transcription initiation in Saccharomyces cerevisiae. Genome Res 29: 1198–1210. 10.1101/gr.245456.118 [DOI] [PMC free article] [PubMed] [Google Scholar]
- Morton T, Petricka J, Corcoran DL, Li S, Winter CM, Carda A, Benfey PN, Ohler U, Megraw M. 2014. Paired-end analysis of transcription start sites in Arabidopsis reveals plant-specific promoter signatures. Plant Cell 26: 2746–2760. 10.1105/tpc.114.125617 [DOI] [PMC free article] [PubMed] [Google Scholar]
- Mueller PP, Hinnebusch AG. 1986. Multiple upstream AUG codons mediate translational control of GCN4. Cell 45: 201–207. 10.1016/0092-8674(86)90384-3 [DOI] [PubMed] [Google Scholar]
- Murata M, Nishiyori-Sueki H, Kojima-Ishiyama M, Carninci P, Hayashizaki Y, Itoh M. 2014. Detecting expressed genes using CAGE. In Transcription factor regulatory networks: methods and protocols (ed. Miyamoto-Sato E, et al. ), pp. 67–85. Springer, New York. [DOI] [PubMed] [Google Scholar]
- Nepal C, Hadzhiev Y, Previti C, Haberle V, Li N, Takahashi H, Suzuki AMM, Sheng Y, Abdelhamid RF, Anand S, et al. 2013. Dynamic regulation of the transcription initiation landscape at single nucleotide resolution during vertebrate embryogenesis. Genome Res 23: 1938–1950. 10.1101/gr.153692.112 [DOI] [PMC free article] [PubMed] [Google Scholar]
- Ni T, Corcoran DL, Rach EA, Song S, Spana EP, Gao Y, Ohler U, Zhu J. 2010. A paired-end sequencing strategy to map the complex landscape of transcription initiation. Nat Methods 7: 521–527. 10.1038/nmeth.1464 [DOI] [PMC free article] [PubMed] [Google Scholar]
- Nissley DA, Sharma AK, Ahmed N, Friedrich UA, Kramer G, Bukau B, O'Brien EP. 2016. Accurate prediction of cellular co-translational folding indicates proteins can switch from post- to co-translational folding. Nat Commun 7: 10341 10.1038/ncomms10341 [DOI] [PMC free article] [PubMed] [Google Scholar]
- Park D, Morris AR, Battenhouse A, Iyer VR. 2014. Simultaneous mapping of transcript ends at single-nucleotide resolution and identification of widespread promoter-associated non-coding RNA governed by TATA elements. Nucleic Acids Res 42: 3736–3749. 10.1093/nar/gkt1366 [DOI] [PMC free article] [PubMed] [Google Scholar]
- Pelechano V, Wei W, Steinmetz LM. 2013. Extensive transcriptional heterogeneity revealed by isoform profiling. Nature 497: 127–131. 10.1038/nature12121 [DOI] [PMC free article] [PubMed] [Google Scholar]
- Picelli S, Björklund ÅK, Faridani OR, Sagasser S, Winberg G, Sandberg R. 2013. Smart-seq2 for sensitive full-length transcriptome profiling in single cells. Nat Methods 10: 1096–1098. 10.1038/nmeth.2639 [DOI] [PubMed] [Google Scholar]
- Plessy C, Bertin N, Takahashi H, Simone R, Salimullah M, Lassmann T, Vitezic M, Severin J, Olivarius S, Lazarevic D, et al. 2010. Linking promoters to functional transcripts in small samples with nanoCAGE and CAGEscan. Nat Methods 7: 528–534. 10.1038/nmeth.1470 [DOI] [PMC free article] [PubMed] [Google Scholar]
- Poulain S, Kato S, Arnaud O, Morlighem J-É, Suzuki M, Plessy C, Harbers M. 2017. NanoCAGE: a method for the analysis of coding and noncoding 5′-capped transcriptomes. In Promoter associated RNA: methods and protocols (ed. Napoli S), pp. 57–109. Springer, New York. [DOI] [PubMed] [Google Scholar]
- Rada-Iglesias A, Bajpai R, Swigut T, Brugmann SA, Flynn RA, Wysocka J. 2011. A unique chromatin signature uncovers early developmental enhancers in humans. Nature 470: 279–283. 10.1038/nature09692 [DOI] [PMC free article] [PubMed] [Google Scholar]
- Rahman S, Zorca CE, Traboulsi T, Noutahi E, Krause MR, Mader S, Zenklusen D. 2017. Single-cell profiling reveals that eRNA accumulation at enhancer-promoter loops is not required to sustain transcription. Nucleic Acids Res 45: 3017–3030. 10.1093/nar/gkw1220 [DOI] [PMC free article] [PubMed] [Google Scholar]
- Reyes A, Huber W. 2018. Alternative start and termination sites of transcription drive most transcript isoform differences across human tissues. Nucleic Acids Res 46: 582–592. 10.1093/nar/gkx1165 [DOI] [PMC free article] [PubMed] [Google Scholar]
- Robinson MD, Oshlack A. 2010. A scaling normalization method for differential expression analysis of RNA-seq data. Genome Biol 11: R25 10.1186/gb-2010-11-3-r25 [DOI] [PMC free article] [PubMed] [Google Scholar]
- Russo P, Simonen M, Uimari A, Teesalu T, Makarow M. 1993. Dual regulation by heat and nutrient stress of the yeast HSP150 gene encoding a secretory glycoprotein. Mol Gen Genet 239: 273–280. 10.1007/BF00281628 [DOI] [PubMed] [Google Scholar]
- Schmidt WM, Mueller MW. 1999. CapSelect: a highly sensitive method for 5′ CAP-dependent enrichment of full-length cDNA in PCR-mediated analysis of mRNAs. Nucleic Acids Res 27: e31 10.1093/nar/27.21.e31 [DOI] [PMC free article] [PubMed] [Google Scholar]
- Schon MA, Kellner MJ, Plotnikova A, Hofmann F, Nodine MD. 2018. NanoPARE: parallel analysis of RNA 5′ ends from low-input RNA. Genome Res 28: 1931–1942. 10.1101/gr.239202.118 [DOI] [PMC free article] [PubMed] [Google Scholar]
- Shiraki T, Kondo S, Katayama S, Waki K, Kasukawa T, Kawaji H, Kodzius R, Watahiki A, Nakamura M, Arakawa T, et al. 2003. Cap analysis gene expression for high-throughput analysis of transcriptional starting point and identification of promoter usage. Proc Natl Acad Sci USA 100: 15776–15781. 10.1073/pnas.2136655100 [DOI] [PMC free article] [PubMed] [Google Scholar]
- Suzuki Y, Sugano S. 2003. Construction of a full-length enriched and a 5′-end enriched cDNA library using the oligo-capping method. In Generation of cDNA libraries: methods and protocols (ed. Ying SY), pp. 73–91. Humana Press, Totowa, NJ. [DOI] [PubMed] [Google Scholar]
- Takahashi H, Lassmann T, Murata M, Carninci P. 2012. 5′ end–centered expression profiling using cap-analysis gene expression and next-generation sequencing. Nat Protoc 7: 542–561. 10.1038/nprot.2012.005 [DOI] [PMC free article] [PubMed] [Google Scholar]
- Thorsen K, Schepeler T, Øster B, Rasmussen MH, Vang S, Wang K, Hansen KQ, Lamy P, Pedersen JS, Eller A, et al. 2011. Tumor-specific usage of alternative transcription start sites in colorectal cancer identified by genome-wide exon array analysis. BMC Genomics 12: 505 10.1186/1471-2164-12-505 [DOI] [PMC free article] [PubMed] [Google Scholar]
- Turchinovich A, Surowy H, Serva A, Zapatka M, Lichter P, Burwinkel B. 2014. Capture and amplification by tailing and switching (CATS): an ultrasensitive ligation-independent method for generation of DNA libraries for deep sequencing from picogram amounts of DNA and RNA. RNA Biol 11: 817–828. 10.4161/rna.29304 [DOI] [PMC free article] [PubMed] [Google Scholar]
- Valen E, Pascarella G, Chalk A, Maeda N, Kojima M, Kawazu C, Murata M, Nishiyori H, Lazarevic D, Motti D, et al. 2009. Genome-wide detection and analysis of hippocampus core promoters using DeepCAGE. Genome Res 19: 255–265. 10.1101/gr.084541.108 [DOI] [PMC free article] [PubMed] [Google Scholar]
- Vo ngoc L, Cassidy CJ, Huang CY, Duttke SHC, Kadonaga JT. 2017. The human initiator is a distinct and abundant element that is precisely positioned in focused core promoters. Genes Dev 31: 6–11. 10.1101/gad.293837.116 [DOI] [PMC free article] [PubMed] [Google Scholar]
- Wakaguri H, Yamashita R, Suzuki Y, Sugano S, Nakai K. 2007. DBTSS: database of transcription start sites, progress report 2008. Nucleic Acids Res 36: D97–D101. 10.1093/nar/gkm901 [DOI] [PMC free article] [PubMed] [Google Scholar]
- Wang X, Hou J, Quedenau C, Chen W. 2016. Pervasive isoform-specific translational regulation via alternative transcription start sites in mammals. Mol Sys Biol 12: 875 10.15252/msb.20166941 [DOI] [PMC free article] [PubMed] [Google Scholar]
- Weiner A, Chen HV, Liu CL, Rahat A, Klien A, Soares L, Gudipati M, Pfeffner J, Regev A, Buratowski S, et al. 2012. Systematic dissection of roles for chromatin regulators in a yeast stress response. PLoS Biol 10: e1001369 10.1371/journal.pbio.1001369 [DOI] [PMC free article] [PubMed] [Google Scholar]
- Wulf MG, Maguire S, Humbert P, Dai N, Bei Y, Nichols NM, Corrêa IR, Guan S. 2019. Non-templated addition and template switching by Moloney murine leukemia virus (MMLV)-based reverse transcriptases co-occur and compete with each other. J Biol Chem 294: 18220–18231. 10.1074/jbc.RA119.010676 [DOI] [PMC free article] [PubMed] [Google Scholar]
- Yamashita R, Sathira NP, Kanai A, Tanimoto K, Arauchi T, Tanaka Y, Hashimoto SI, Sugano S, Nakai K, Suzuki Y. 2011. Genome-wide characterization of transcriptional start sites in humans by integrative transcriptome analysis. Genome Res 21: 775–789. 10.1101/gr.110254.110 [DOI] [PMC free article] [PubMed] [Google Scholar]
- Zajac P, Islam S, Hochgerner H, Lönnerberg P, Linnarsson S. 2013. Base preferences in non-templated nucleotide incorporation by MMLV-derived reverse transcriptases. PLoS One 8: e85270 10.1371/journal.pone.0085270 [DOI] [PMC free article] [PubMed] [Google Scholar]
- Zentner GE, Tesar PJ, Scacheri PC. 2011. Epigenetic signatures distinguish multiple classes of enhancers with distinct cellular functions. Genome Res 21: 1273–1283. 10.1101/gr.122382.111 [DOI] [PMC free article] [PubMed] [Google Scholar]
- Zhang Z, Dietrich FS. 2005. Mapping of transcription start sites in Saccharomyces cerevisiae using 5′ SAGE. Nucleic Acids Res 33: 2838–2851. 10.1093/nar/gki583 [DOI] [PMC free article] [PubMed] [Google Scholar]
- Zhang P, Dimont E, Ha T, Swanson DJ, the FC, Hide W, Goldowitz D. 2017. Relatively frequent switching of transcription start sites during cerebellar development. BMC Genomics 18: 461 10.1186/s12864-017-3834-z [DOI] [PMC free article] [PubMed] [Google Scholar]
- Zhu Y, Machleder E, Chenchik A, Li R, Siebert P. 2001. Reverse transcriptase template switching: a SMARTTM approach for full-length cDNA library construction. BioTechniques 30: 892–897. 10.2144/01304pf02 [DOI] [PubMed] [Google Scholar]
Associated Data
This section collects any data citations, data availability statements, or supplementary materials included in this article.