

Abstract
A large number of genes have been implicated in neurodevelopmental disorders (NDDs), but their contributions to NDD pathology are difficult to decipher without understanding their diverse roles in different brain cell types. Here, we integrated NDD genetics with single-cell RNA sequencing data to assess coexpression enrichment patterns of various NDD gene sets. We identified midfetal cortical neural progenitor cell development—more specifically, the ventricular radial glia-to-intermediate progenitor cell transition at gestational week 10—as a key point of convergence in autism spectrum disorder (ASD) and epilepsy. Integrated Gene Ontology–based analysis further revealed that ASD genes activate neural differentiation and inhibit cell cycle during the transition, whereas epilepsy genes function as downstream effectors in the same processes, offering one possible explanation for the high comorbidity rate of the two disorders. This approach provides a framework for investigating the cell-type-specific pathophysiology of NDDs.
Over the last decade, large-scale exome and genome sequencing studies have established that hundreds of de novo genetic variants contribute to neurodevelopmental disorders (NDDs), including autism spectrum disorder (ASD) (De Rubeis et al. 2014; Iossifov et al. 2014; Krumm et al. 2015; Sanders et al. 2015; Yuen et al. 2017), epilepsy (Epi4K and EPGP Investigators 2013; EuroEPINOMICS-RES Consortium et al. 2017; Heyne et al. 2018), intellectual disability (ID) (de Ligt et al. 2012; Rauch et al. 2012; Lelieveld et al. 2016), and developmental delay (DD) (Deciphering Developmental Disorders Study 2017). The underlying genetic landscapes of these disorders are so heterogeneous that most NDD-associated genes account for only a few cases of a given disease. Yet the fact that certain endophenotypes, such as seizures, are common to multiple NDDs suggests that the disease-associated genes might functionally converge on certain shared events in brain development (Lo-Castro and Curatolo 2014; Anttila et al. 2018). Identifying these convergences should deepen our understanding of NDD pathophysiology and may lead to viable treatments.
Several systems-level studies have made progress in this regard by integrating NDD genes with functional data. For example, one study applied weighted gene coexpression network analysis to identify modules of coexpressed genes that are enriched for association with ASD (Parikshak et al. 2013). This top-down analysis suggested that at the circuit level, ASD genes are enriched in superficial cortical layers and glutamatergic projection neurons during fetal cortical development. Another study took a bottom-up approach by focusing on nine high-confidence ASD genes and searching for spatiotemporal conditions in which probable ASD genes coexpress with them; this strategy suggested that glutamatergic projection neurons in deep cortical layers of human midfetal prefrontal and primary motor-somatosensory cortex are a key point of ASD gene convergence (Willsey et al. 2013). Integrating gene coexpression with protein–protein interaction networks to identify modules that enrich for genes mutated in several NDDs revealed that different NDDs share a major point of gene convergence during early embryonic brain development (Hormozdiari et al. 2015). Although these and other studies (Chang et al. 2015; Lin et al. 2015; Krishnan et al. 2016; Shohat et al. 2017) applied different methods, the main conclusions are similar: A substantial subset of ASD and/or other NDD genes converge in fetal cortical development.
The majority of coexpression analyses on NDDs used the BrainSpan data set, which contains spatiotemporal gene expression data from the developing human brain (Kang et al. 2011). Because this data set was collected from bulk brain tissue, it is hard to investigate cell-type-specific coexpression patterns. The recent publication of single-cell RNA sequencing (scRNA-seq) profile from the developing human prefrontal cortex (Zhong et al. 2018), however, provides an unprecedented opportunity to understand NDD pathophysiology in a cell-type-specific manner. Given that dysfunction of the prefrontal cortex has been implicated in multiple NDDs (Arnsten 2006; Xiong et al. 2007; Gulsuner et al. 2013; Parikshak et al. 2013; Willsey et al. 2013), we decided to integrate this scRNA-seq data set with disease genes from NDDs to see if we could identify disease-specific convergence of NDD genes in specific cell types and developmental stages. We accomplished this and in the process uncovered critical cellular processes affected in ASD and epilepsy.
Results
Genes associated with specific NDDs are coexpressed in specific cell types
To identify high-confidence genes associated with risk for each NDD, we first interrogated genes with de novo protein-altering variants for the four NDDs in the denovo-db database (Turner et al. 2017) and nonredundant data for epilepsy (Epi) from two studies (EuroEPINOMICS-RES Consortium et al. 2017; Heyne et al. 2018). Nonsense, frameshift, and canonical splice-site mutations generally lead to loss of function, whereas missense mutations can cause hypomorphic, hypermorphic, antimorphic, or neomorphic effects. Thus, for each NDD, we divided the associated genes into two categories: genes with de novo loss-of-function (dnLoF) mutations and genes with de novo missense (dnMis) mutations. To select the most relevant genes for each NDD, we included only genes with at least two or three (depending on gene set sizes) de novo mutations of the same category in each specific disorder (Methods). In total, we defined eight high-confidence NDD gene sets: dnLoF-ASD, dnLoF-Epi, dnLoF-ID, dnLoF-DD, dnMis-ASD, dnMis-Epi, dnMis-ID, and dnMis-DD (Supplemental Table S1A). The different gene sets overlap somewhat, as expected from the high comorbidity among these NDDs (Supplemental Fig. S1).
To investigate the coexpression dynamics of NDD genes in specific cell types, we used the scRNA-seq data set from more than 2300 single cells of the developing human prefrontal cortex at gestational weeks (GWs) 8–26 (Zhong et al. 2018). This data set contains six major cell types: neural progenitor cells (NPCs), excitatory neurons, interneurons, astrocytes, oligodendrocyte progenitor cells (OPCs), and microglia. We performed coexpression analyses of the different NDD gene sets using the transcriptomic data from each of these cell types.
We reasoned that mutations in different genes that cause similar symptoms are more likely to functionally converge on processes, stages in brain development, or specific cell types. This functional convergence should be reflected by an increase in the level of coexpression within a particular NDD gene set compared with the overall coexpression level of all the expressed genes (background genes) in that cell type (Methods). In brief, we calculated the pairwise Spearman's correlation coefficients between background genes in each cell type and defined the top 0.5% gene pairs with the highest correlation coefficients as significantly coexpressed. We then calculated the fraction of significantly coexpressed gene pairs out of all pairs of genes in the NDD gene set and divided it by 0.5% to get a coexpression fold enrichment score of the NDD gene set. A high coexpression fold enrichment score indicates that the genes in the set are more significantly coexpressed than background genes. To verify that enrichment is specific and disease-relevant, we also included several control gene sets, including genes with dnLoF mutations in unaffected ASD siblings (Turner et al. 2017), genes with LoF mutations in the general population (Lek et al. 2016), brain-specific gene regulatory factors (Brain-GRF) (Berto et al. 2016), and synaptic genes (Koopmans et al. 2019) (Methods; Supplemental Table S1A).
We calculated coexpression fold enrichment scores for the eight NDD gene sets and four control gene sets across the six major cell types (Fig. 1A; Supplemental Fig. S2). In general, NDD gene sets showed significantly higher coexpression than control gene sets (Fig. 1A; Supplemental Figs. S2, S3). The majority of NDD gene sets showed high coexpression in NPCs (Fig. 1A), suggesting a convergent involvement of NPCs in different NDDs. Moreover, dnLoF-ASD and dnMis-Epi genes stood out as having the highest coexpression enrichment scores in specific cell types (Fig. 1A; Supplemental Fig. S4). dnLoF-ASD genes have the highest coexpression in NPCs (18.8-fold enrichment), suggesting a significant contribution of NPCs to ASD pathophysiology (Fig. 1A). dnMis-ASD genes showed low coexpression in the six cell types (Fig. 1A), consistent with previous estimates that ∼43% of dnLoF mutations (but only ∼13% of dnMis mutations) contribute to ASD diagnosis (Iossifov et al. 2014). dnMis-Epi genes are highly coexpressed in NPCs, excitatory neurons, and, more prominently, interneurons (Fig. 1A), in line with previous findings that dnMis mutations (Hamdan et al. 2017; Heyne et al. 2018) and interneuron dysfunction (Lado et al. 2013; Noebels 2015) contribute significantly to the etiology of epilepsy. ID and DD genes did not show comparable coexpression, suggesting either less functional convergence or perhaps the need to examine single-cell data from other brain regions.
Figure 1.

Coexpression enrichment analysis of high-confidence NDD genes in six major cell types. (A) Coexpression fold enrichment of eight NDD gene sets (four with dnLoF mutations and four with dnMis mutations) in six cortical cell types, along with the sample size of each. Gene set size is shown in parentheses. Circle size is proportional to enrichment score. (B,C) Coexpression fold enrichment of dnLoF-ASD (B) and dnMis-Epi genes (C) in six major cell types by downsampling the same number of cells for each cell type. Violin plot shows the mean value (point). P-value indicates whether the mean coexpression fold enrichment score of the corresponding gene set is higher than that of the background genes (one-sided Fisher's exact test). (D,E) Coexpression networks of dnLoF-ASD (D) and dnMis-Epi genes (E) in the six cell types using the original sample size. Node size is proportional to coexpression degree.
To determine whether the observed coexpression enrichment reflects true biological signals, we systematically tested possible confounders (Supplemental Methods; Crow et al. 2016; McCall et al. 2016; Skinnider et al. 2019). We found that coexpression enrichment is robust to changes in the coexpression threshold (Supplemental Figs. S5, S6) and correlation-based measures of association (Supplemental Fig. S7). Coexpression enrichment calculated using Spearman's correlation can capture known correlated pathways (Supplemental Fig. S8; Supplemental Table S1C). Coexpression enrichment remains similar after controlling for gene set size difference (Supplemental Fig. S9), gene expression level dependence (Supplemental Fig. S10), and severity of missense mutations (Supplemental Fig. S11). Because cell numbers vary across the six major cell types (Fig. 1A; Supplemental Table S1B), we downsampled the same number of cells for each type to make the coexpression enrichment scores comparable (Methods). We found that reducing cell numbers generally decreases the coexpression enrichment scores (Fig. 1B,C; Supplemental Fig. S12), consistent with the previous finding that larger cell numbers facilitate the reconstruction of more robust and coherent networks (Skinnider et al. 2019). Nevertheless, even after downsampling, dnLoF-ASD genes still had the highest coexpression in NPCs (Fig. 1B), and dnMis-Epi genes were still highly coexpressed in NPCs and interneurons (their highest coexpression was in microglia) (Fig. 1C). Although we used percentile-based cutoff for coexpression enrichment analysis to mitigate the effect of global coexpression differences across cell types, the findings are consistent with results from absolute correlation analysis (Supplemental Figs. S13, S14). Although microglia have been implicated in epilepsy (Vezzani et al. 2011, 2013), all our subsequent analyses focus on NPCs and interneurons because of their larger sample sizes.
Supplemental Figures S15 and S16 present several examples of dnLoF-ASD and dnMis-Epi gene pairs that show higher coexpression in NPCs and interneurons, respectively. Figure 1, D and E, shows the coexpression networks for dnLoF-ASD and dnMis-Epi genes in the six major cell types using the original sample size, highlighting the larger number of network edges in the cell types with higher coexpression enrichment.
ASD and epilepsy genes coexpress at specific developmental stages in NPCs and interneurons
To determine the specific developmental stages that contribute to the coexpression of dnLoF-ASD in NPCs and dnMis-Epi genes in NPCs and interneurons, we performed coexpression enrichment analysis of these two gene sets at different time points. To overcome sample size difference and increase the accuracy of coexpression enrichment score estimation, we focused on cell stages with at least 50 cells and downsampled the same number of cells for each cell stage to make results comparable (Methods; Fig. 2A–C; Supplemental Fig. S17). We included excitatory neurons for comparison (Fig. 2B).
Figure 2.

Coexpression enrichment analysis of dnLoF-ASD and dnMis-Epi genes during NPC and neuron development. (A–C) Coexpression fold enrichment of dnLoF-ASD and dnMis-Epi genes at specific stages of NPCs (A), excitatory neurons (B), and interneurons (C) by downsampling the same number of cells for each cell stage. (D) Coexpression fold enrichment of dnLoF-ASD and dnMis-Epi genes in vRG cells, IPCs, and the transition at GW10 by downsampling the same number of cells for each condition. (E,F) Coexpression fold enrichment of dnLoF-ASD and dnMis-Epi genes in vRG cells, oRG cells, IPCs, and their transitions at GW16 by downsampling 20 cells (E) and 37 cells (F) for each condition. In A–F, asterisks indicate −log10 P-values for differences in mean enrichment scores between the gene sets and the background genes (one-sided Fisher's exact test): (*) 1 ≤ −log10P < 2; (**) 2 ≤ −log10P < 5. (G) Expression of dnLoF-ASD and dnMis-Epi genes significantly increased during the transition from vRG cells to IPCs at GW10. The dashed horizontal line indicates the median log2(fold change) value of the background genes. P-values indicate differences between log2(fold change) values of dnLoF-ASD or dnMis-Epi genes and those of background genes during the transition (one-sided Wilcoxon rank-sum test). (H,I) Coexpression networks of dnLoF-ASD (H) and dnMis-Epi genes (I) in vRG cells, IPCs, and the transition at GW10 using original sample size. Node size is proportional to coexpression degree.
In NPCs, dnLoF-ASD genes were highly coexpressed at GW10 and, to a lesser extent, GW16 (Fig. 2A; Supplemental Fig. S17A). At GW10, ventricular radial glia (vRG) cells in the subventricular zone give rise to intermediate progenitor cells (IPCs) (Lui et al. 2011), which further differentiate into deep-layer neurons (Nowakowski et al. 2016). We found high coexpression of dnLoF-ASD genes in GW10 vRG cells and IPCs together, but little to no coexpression in either cell type alone (Fig. 2D; Supplemental Figs. S18A, S19A, S20), that is, the high coexpression occurs during the vRG-to-IPC transition. Consistently, most dnLoF-ASD genes concurrently increased expression during the transition from vRG cells to IPCs (Fig. 2G; Supplemental Table S2). ASD genes with one or two dnLoF mutations and all the SFARI curated gene sets except category six (Basu et al. 2009) also increased expression during this transition (Supplemental Fig. S22). Figure 2, H and I, compares the coexpression networks between individual cell types and the cell-type transition at GW10 for dnLoF-ASD and dnMis-Epi genes using the original sample size.
At GW16, vRG cells not only give rise to IPCs in the subventricular zone but also produce outer radial glia (oRG) cells that will migrate to the outer subventricular zone (Fietz et al. 2010; Hansen et al. 2010; Lui et al. 2011; Nowakowski et al. 2016), where they further differentiate into upper-layer neurons. Although GW16 vRG cells did not show coexpression enrichment, oRG cells and IPCs showed moderate coexpression enrichment (Fig. 2E; Supplemental Figs. S18B, S19B). Unlike the GW10 situation, however, coexpression enrichment was not higher in the combination of oRG cells and IPCs (Fig. 2F; Supplemental Fig. S19C), and dnLoF-ASD genes did not show expression change during the vRG-to-oRG, vRG-to-IPC, or oRG-to-IPC transitions (Supplemental Fig. S23). Coexpression scores for dnMis-Epi genes were generally lower than those of dnLoF-ASD genes but showed similar patterns at NPC stages and transitions (Fig. 2A,D–G; Supplemental Figs. S17A, S18, S19, S21, S23).
In excitatory neurons, neither dnLoF-ASD or dnMis-Epi genes showed much coexpression (Fig. 2B), despite their elevated absolute correlation at GW16 (Supplemental Fig. S17B). In interneurons, dnMis-Epi genes were highly coexpressed at later developmental stages, particularly GW23 (Fig. 2C; Supplemental Fig. S17C), when interneurons are developing axons and maturing in the prefrontal cortex (Zhong et al. 2018).
ASD and epilepsy genes during the differentiation from NPCs to excitatory neurons
To understand whether dnLoF-ASD or dnMis-Epi genes coordinate during cell differentiation, we analyzed the coexpression pattern of these two gene sets during NPC terminal differentiation (Fig. 3A,B). Because of the limited sample size (Supplemental Table S1B), we focused on NPC-to-excitatory neuron differentiation at GW10 and GW16 when we could study at least 50 samples in both NPCs and excitatory neurons. Excitatory neurons sampled from GW10 and GW16 are mostly deep-layer and upper-layer neurons, respectively (Supplemental Fig. S24). Both dnLoF-ASD and dnMis-Epi genes displayed their highest coexpression in NPCs but not in the combined cells (Fig. 3A,B; Supplemental Fig. S25). Their coexpression was not the highest in the combined cells of NPC subtypes and excitatory neurons either (Supplemental Figs. S26A,B, S27A–C). However, their expression rose during the differentiation, especially at GW16 (Fig. 3C,D; Supplemental Figs. S26C,D, S27D–F; Supplemental Table S3). These data indicate that as ASD and epilepsy genes become more abundant in excitatory neurons, they also become more specialized in function.
Figure 3.
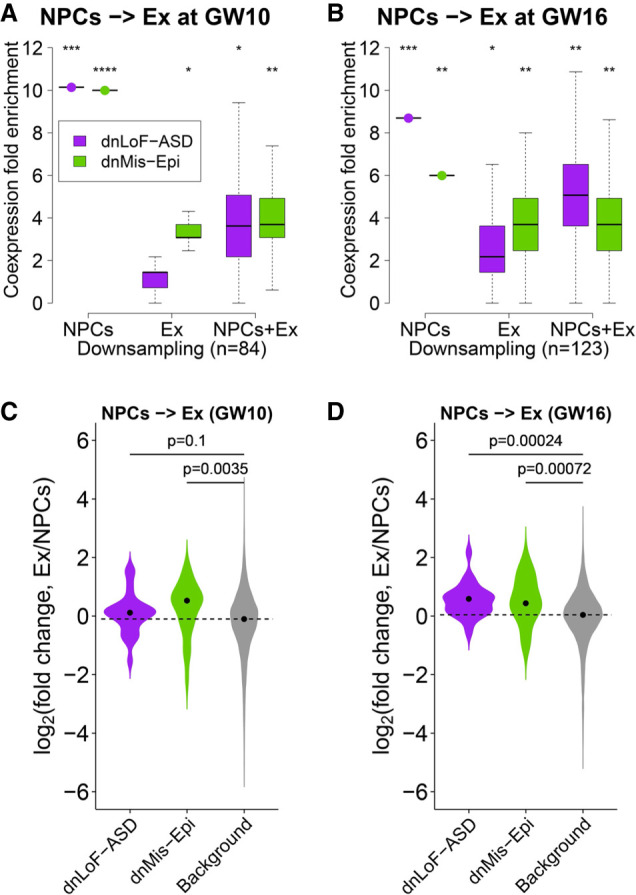
Coexpression enrichment analysis of dnLoF-ASD and dnMis-Epi genes during differentiation from NPCs to excitatory neurons (Ex). (A,B) Coexpression fold enrichment of dnLoF-ASD and dnMis-Epi genes in NPCs, excitatory neurons, and the differentiation at GW10 (A) and GW16 (B) by downsampling the same number of cells for each condition. Asterisks indicate −log10 P-values for differences in mean enrichment scores between the gene sets and the background genes (one-sided Fisher's exact test): (*) 1 ≤ −log10P < 2; (**) 2 ≤ −log10P < 5; (***) 5 ≤ −log10P < 10; (****) 10 ≤ −log10P. (C) Expression of dnMis-Epi but not dnLoF-ASD genes significantly increased during the differentiation from NPCs to excitatory neurons at GW10. (D) Expression of dnLoF-ASD and dnMis-Epi genes significantly increased during the differentiation from NPCs to excitatory neurons at GW16. In C and D, the dashed horizontal line indicates the median log2(fold change) value of the background genes.
ASD and epilepsy genes are associated with the transition at GW10
To identify the functions of dnLoF-ASD and dnMis-Epi genes during the vRG-to-IPC transition at GW10, we developed a Gene Ontology (GO) correlation analysis to determine the correlation between a given gene set and any GO term in a context-dependent manner (Methods). We found that ASD and epilepsy genes are positively correlated with genes involved in neurogenesis and neural differentiation (Fig. 4A,B; Supplemental Table S4A,B) but negatively correlated with genes involved in cell cycle and cellular respiration (Fig. 4C,D; Supplemental Table S4C,D).
Figure 4.

GO correlation analysis of dnLoF-ASD and dnMis-Epi genes and GO expression change analysis during the vRG-to-IPC transition at GW10. (A,B) Scatterplots show the significance values from GO positive correlation analysis of dnLoF-ASD (A) and dnMis-Epi genes (B) on the horizontal axis versus the significance values from GO expression increase analysis on the vertical axis during the transition. Dots represent individual GO biological process terms. Each dot has −log10FDR values on both the horizontal axis (how strongly genes annotated under a GO term positively correlate with dnLoF-ASD [A] and dnMis-Epi genes [B] during the transition) and the vertical axis (how much higher the log2[fold change] values are for genes annotated under the GO term compared to the background genes during the transition). The dashed vertical and horizontal lines indicate −log10FDR at 4 and 2 as significance thresholds. Red denotes GO terms significant in both analyses, green denotes GO terms significant only in GO positive correlation analysis, and blue denotes GO terms significant only in GO expression increase analysis. Selected representative GO terms are labeled. (C,D) Similar to A and B with GO negative correlation analysis of dnLoF-ASD (C) and dnMis-Epi genes (D) and GO expression decrease analysis during the transition.
Like ASD and epilepsy genes, genes in GO terms that show positive correlation increase their expression during the transition (Fig. 4A,B; Supplemental Table S4A,B). Genes in GO terms that show negative correlations, especially those involved in the cell cycle, tend to decrease their expression during the transition (Fig. 4C,D; Supplemental Table S4C,D). These observations are consistent with the fact that IPCs show increased neuronal commitment and decreased proliferation capacity compared with vRG cells (Noctor et al. 2004).
ASD and epilepsy genes serve different functions during the NPC transition
If dnLoF-ASD and dnMis-Epi genes are involved in the same biological pathways during the NPC transition at GW10, the differences between ASD and epilepsy suggest that the underlying mechanisms should differ. We therefore examined the composition of each gene set. We found that ASD genes are enriched in GO terms such as chromatin modification and organization, whereas epilepsy genes are enriched for neurogenesis and neural differentiation (Fig. 5A,B; Supplemental Table S5A,B). Given that chromatin modification and organization are critical for transcriptional regulation, and dozens of ASD-associated chromatin regulators have well-known regulatory functions in neurogenesis (Ronan et al. 2013; Ernst 2016; Courchesne et al. 2019), these results suggest that ASD genes serve as upstream regulators to control the transcription of other genes in these pathways to promote the NPC transition at GW10, whereas epilepsy genes could be downstream effectors. Neither ASD nor epilepsy genes showed enrichment in cell cycle–related GO terms with which they negatively correlate (Fig. 5C,D; Supplemental Table S5C,D). ASD genes might therefore also serve to repress cell cycle progression.
Figure 5.

GO enrichment and correlation analyses of dnLoF-ASD and dnMis-Epi genes during the vRG-to-IPC transition at GW10. (A,B) Scatterplots show the significance values from GO enrichment analysis on the horizontal axis versus the significance values from GO positive correlation analysis on the vertical axis of dnLoF-ASD (A) and dnMis-Epi genes (B) during the transition. Dots represent individual GO biological process terms. Each dot has −log10FDR value on the horizontal axis that indicates the statistical significance of the overlap between genes annotated under a GO term and dnLoF-ASD (A) or dnMis-Epi genes (B), and −log10FDR value on the vertical axis that indicates how strongly genes annotated under the GO term positively correlate with dnLoF-ASD (A) and dnMis-Epi genes (B) during the transition. Dashed vertical and horizontal lines indicate −log10FDR at 2 and 4 as significance thresholds. Red denotes GO terms significant in both analyses, green denotes GO terms significant only in GO enrichment analysis, and blue denotes GO terms significant only in GO positive correlation analysis. Selected representative GO terms are labeled. (C,D) Similar to A and B with GO enrichment and negative correlation analyses of dnLoF-ASD (C) and dnMis-Epi genes (D) during the transition.
CHD8 promotes neural differentiation and inhibits cell cycle
To determine whether dnLoF-ASD genes are indeed upstream regulators in the NPC transition, we studied the chromatin remodeling gene CHD8, a key high-confidence ASD gene (Bernier et al. 2014). CHD8 is a hub gene in the vRG-to-IPC transition network at GW10 (Fig. 2H). A previous study performed RNA-seq analysis on Chd8 haploinsufficient mice using forebrain tissue at five developmental stages (E12.5, E14.5, E17.5, P0, and adult) (Gompers et al. 2017). The top 300 down-regulated and top 300 up-regulated genes in Chd8 haploinsufficient mice at each stage were defined as CHD8-activated and CHD8-repressed genes, respectively (Supplemental Methods; Supplemental Table S6A). We found that only CHD8-activated genes at E14.5 are both preferentially bound by CHD8 (Gompers et al. 2017) and enriched for ASD genes (Supplemental Fig. S28), suggesting that they are more likely genuine CHD8 targets involved in ASD pathology. Thus, we deemed CHD8-activated and CHD8-repressed genes at E14.5 as CHD8 targets in ASD for further analysis.
We first analyzed the expression pattern of these CHD8 targets in human GW10 NPCs. CHD8 doubled its expression during the vRG-to-IPC transition (Fig. 2H; Supplemental Table S2). Expression of CHD8-activated genes rose during the transition, whereas CHD8-repressed genes decreased, compared with background genes (Fig. 6A; Supplemental Table S6B). CHD8 was more positively correlated with CHD8-activated genes and more negatively correlated with CHD8-repressed genes than the background genes (Fig. 6B; Supplemental Table S6C). Moreover, CHD8-activated genes were enriched for GO terms related to neurogenesis and neuron development (Fig. 6C; Supplemental Table S6D), whereas CHD8-repressed genes were enriched for GO terms related to cell cycle (Fig. 6D; Supplemental Table S6E). These results indicate that CHD8 promotes the vRG-to-IPC transition at GW10 by activating neural differentiation pathways and repressing cell cycle–related processes. This would predict that CHD8 haploinsufficiency shifts vRG cells toward proliferation instead of differentiation. Indeed, Chd8 haploinsufficient mice have a greater number of radial glia cells and fewer IPCs during embryonic development (Gompers et al. 2017).
Figure 6.

CHD8 target gene analysis. (A) Expression changes of CHD8-activated and CHD8-repressed genes during the transition from vRG cells to IPCs at GW10. The dashed horizontal line indicates the median log2(fold change) value of the background genes. P-values calculated by the one-sided Wilcoxon rank-sum test indicate whether CHD8-activated (-repressed) genes have higher (lower) log2(fold change) values than the background genes during the transition. (B) Spearman's correlation between CHD8-activated/CHD8-repressed genes and CHD8 during the transition. The dashed horizontal line indicates the median Spearman's correlation with CHD8 for the background genes. P-values calculated by the one-sided Wilcoxon rank-sum test indicate whether CHD8-activated (-repressed) genes have higher (lower) correlation with CHD8 than the background genes during the transition. (C,D) Top GO terms enriched with CHD8-activated (C) and CHD8-repressed genes (D).
Coexpression enrichment of NDD genes faithfully represents NDD pathophysiology
Our coexpression enrichment analysis assumes that functional convergences of high-confidence NDD genes represent core pathways underlying the diseases. If this assumption is correct, we would expect that lower-confidence NDD genes would also converge to core pathways. We therefore calculated Spearman's correlation with dnLoF-ASD genes in NPCs for dnLoF-ASD genes (with ≥3 dnLoF mutations) and ASD genes with fewer dnLoF mutations. As expected, ASD genes harboring one or two dnLoF mutations correlate more strongly with dnLoF-ASD genes than genes harboring no dnLoF mutations, independently confirming that coexpression enrichment of dnLoF-ASD genes in NPCs captures ASD pathology (Fig. 7A; Supplemental Table S7A). Similar results were obtained for dnMis-Epi genes in interneurons (Fig. 7B; Supplemental Table S7B).
Figure 7.

Coexpression network organization of ASD genes with dnLoF mutations in NPCs, and epilepsy genes with dnMis mutations in interneurons. (A) Spearman's correlation with dnLoF-ASD genes in NPCs for ASD genes with ≥3, 2, 1, and 0 dnLoF mutations. (B) Spearman's correlation with dnMis-Epi genes in interneurons for epilepsy genes with ≥2, 1, and 0 dnMis mutations. (C) Coexpression network of ASD genes with at least one dnLoF mutation in NPCs. Red, green, and blue nodes indicate ASD genes with ≥3, 2, and 1 dnLoF mutations, respectively. Red, green, and blue edges indicate coexpression within ASD genes with ≥3, 2, and 1 dnLoF mutations, respectively, and orange edges indicate coexpression between ASD genes with ≥3 dnLoF mutations and ASD genes with 2 dnLoF mutations. (D) Coexpression network of epilepsy genes with at least one dnMis mutation in interneurons. Red and blue nodes indicate epilepsy genes with ≥2 and 1 dnMis mutations, respectively. Red and blue edges indicate coexpression within epilepsy genes with ≥2 and 1 dnMis mutations, respectively. In C and D, node size is proportional to coexpression degree. (E) Coexpression degree in the NPC network of ASD genes with ≥3, 2, and 1 dnLoF mutations. (F) Coexpression degree in the interneuron network of epilepsy genes with ≥2 and 1 dnMis mutations. In A,B,E,F, P-values were calculated using the one-sided Wilcoxon rank-sum test.
These results suggest that genes with more mutations tend to be at the core of the NDD gene coexpression network, and genes with fewer mutations tend to be in the periphery. To test this hypothesis, we constructed an NPC coexpression network of all the ASD genes with dnLoF mutations (Fig. 7C; Supplemental Table S7C) and an interneuron coexpression network of all the epilepsy genes with dnMis mutations (Fig. 7D; Supplemental Table S7D). Consistent with our hypothesis, genes with more mutations tended to occupy the core of the network, as indicated by a significantly higher coexpression degree (Fig. 7E,F; Supplemental Table S7E,F). These findings confirm that coexpression enrichment of NDD-associated genes faithfully reveals biological mechanisms.
Discussion
This study supports the hypothesis that heterogeneous genetic mutations in ASD and epilepsy converge to disrupt a small set of critical neurodevelopmental events in particular cell types, expanding our understanding of NDD pathophysiology and leading toward comprehensive cell maps in neuropsychiatric disorders (Willsey et al. 2018). Our study also presents a computational framework for analyzing disease pathophysiology using scRNA-seq data sets.
NDD pathophysiology depends on types of genetic perturbations
When analyzing the NDD gene sets, we found that for the same disorder, genes with different types of mutations display distinct coexpression patterns. For instance, dnLoF-ASD genes have the highest coexpression enrichment in NPCs among all the NDD gene sets, but dnMis-ASD genes showed little coexpression; dnLoF-Epi genes showed little coexpression in interneurons, but dnMis-Epi genes had high enrichment in the same cell type. One possible explanation is that haploinsufficiency is the major genetic mechanism for highly penetrant ASD genes, whereas gain-of-function or dominant-negative missense mutations dominate the mutational spectrum of highly penetrant genes in epilepsy. Several lines of evidence support this explanation. First, about three times as many LoF mutations contribute to ASD diagnosis as missense mutations (Iossifov et al. 2014). Second, missense variants explain a larger proportion of individuals with epilepsy than of individuals with ID (Hamdan et al. 2017), and NDD individuals with missense variants are more likely to have epilepsy than individuals with LoF variants (Heyne et al. 2018). In fact, dozens of dominant-negative or gain-of-function missense mutations have been reported in epilepsy (Barcia et al. 2012; Veeramah et al. 2012; Lemke et al. 2014; Nava et al. 2014; Orhan et al. 2014; Yuan et al. 2014; Li et al. 2016b). Finally, at the individual gene level, missense variants in SCN2A and SCN8A are more strongly implicated in epilepsy than LoF variants (Heyne et al. 2018), and although gain-of-function variants in SCN2A contribute to seizure, all ASD-associated variants dampen or eliminate channel function (Ben-Shalom et al. 2017). Furthermore, we found that ASD genes tend to regulate the transcription of other genes in neural differentiation pathways, whereas epilepsy genes tend to serve as downstream effectors. This helps explain why so many ASDs involve seizures (Betancur 2011; Sundelin et al. 2016) but most epilepsies do not involve ASD: A mutation in a single ion channel downstream from the differentiation program might severely affect one electrophysiological property of IPCs and neurons, but a mutation in a transcription regulator upstream of the differentiation program could broadly and moderately affect multiple aspects of the cell, such as proliferation, specification, and maturation. Some ASD genes, like CHD8, might also determine whether to initiate the transition and/or regulate the balance of NPC proliferation and differentiation at the early stage of the transition. LoF mutations in this kind of genes could explain early brain overgrowth in ASD (Courchesne et al. 2007, 2019; Ernst 2016; Gompers et al. 2017).
NPCs and cell-type transition in ASD and epilepsy
Another finding is the difference in coexpression patterns within a cell type and during the cell-type transition. Both dnLoF-ASD and dnMis-Epi genes are more strongly coexpressed at GW10 in the whole NPC population than within vRG cells or IPCs alone, suggesting that these genes play a critical role in the vRG-to-IPC transition. This transition is central to cortical development. vRG cells undergo either symmetric division to proliferate and expand the radial glia pool or asymmetric division to generate neurons or IPCs. IPCs migrate out of the ventricular zone to form the SVZ at the basal side. There, they undergo limited rounds of divisions to produce multiple neurons. Disruptions in this two-step pattern of neurogenesis would therefore derail cerebral cortex development (Kriegstein et al. 2006; Martínez-Cerdeño et al. 2006; Shenhav et al. 2012; Mihalas et al. 2016; Krogan et al. 2016; Li et al. 2016a; Gompers et al. 2017). Moreover, the morphological and electrophysiological properties of upper-layer neurons depend on their origins from radial glia cells or IPCs (Haydar et al. 2015). Thus, gene misexpression during the vRG-to-IPC transition is a plausible pathogenic pathway for ASD and epilepsy. Without transcriptomic data at the single-cell level, this kind of subpopulation analysis would be very difficult if not impossible.
Our approach not only yields a list of core genes with a high coexpression degree but also identifies the most relevant cell types in which these genes and pathways show convergent function. Future investigations focusing on these core genes and their related regulatory pathways in the most relevant cell types and developmental stages would accelerate ASD and epilepsy gene discovery and enable a more comprehensive understanding of their pathophysiology. Development of precise therapies targeting convergent mechanisms could benefit groups of individuals across NDDs with similar symptoms (Pang et al. 2014; Ernst 2016; Sztainberg and Zoghbi 2016; Sestan and State 2018).
Robustness of coexpression enrichment analysis
We have shown that our coexpression enrichment analysis is not affected by coexpression threshold, correlation-based measures of association, gene set size, gene expression level, or severity of missense mutations. Sample size did correlate with coexpression enrichment score, however, and previous work has also shown that larger cell numbers facilitate the reconstruction of more robust and coherent networks (Skinnider et al. 2019). We suggest that controlling for sample size difference be established as a standard for coexpression comparison analysis across different conditions. Previous studies based on coexpression comparison analyses across different conditions that did not control for sample size difference (Gulsuner et al. 2013; Willsey et al. 2013; Lin et al. 2015) probably need to be evaluated for sample size effect. Sample size effect could also emerge when combining different conditions to construct a global coexpression network, because the signal would be dominated by conditions with larger sample sizes. Although we used percentile-based cutoff for coexpression enrichment analysis to mitigate the effect of global coexpression differences across cell types, our findings were consistent with results from the absolute correlation analysis. The high coexpression enrichment score also reflects the absolute elevation of coexpression level, especially for dnLoF-ASD genes in NPCs (Supplemental Fig. S13A), dnMis-Epi genes in interneurons (Supplemental Fig. S13B), dnLoF-ASD and dnMis-Epi genes in NPCs at GW10 and GW16 (Supplemental Fig. S17A), and dnLoF-ASD and dnMis-Epi genes in the vRG-to-IPC transition at GW10 (Supplemental Fig. S19A).
Last, the relatively small sample size limited our analysis to a few cell types and developmental stages. Because we used the scRNA-seq data set from the midfetal stage of the developing human brain, our analysis focused on transcriptional programs and cell-autonomous effects that take place early in brain development. In the future, it could be fruitful to expand our analysis to more cell types and developmental stages at both cell-autonomous and cell–cell interaction levels, as larger scRNA-seq data sets covering later developmental stages become available.
Methods
High-confidence NDD gene sets
We downloaded de novo mutation data for four NDDs: ASD, epilepsy, ID, and DD from the denovo-db v.1.5 database release (Turner et al. 2017) (http://denovo-db.gs.washington.edu). For epilepsy, we also added de novo mutation data from two studies (EuroEPINOMICS-RES Consortium et al. 2017; Heyne et al. 2018) not included in the denovo-db v.1.5 database. We extracted genes with dnLoF (nonsense, frameshift, and canonical splice site) and dnMis mutations from whole-exome or whole-genome sequencing data for these four NDDs. The number of dnLoF (dnMis) mutations for a gene in a disorder was defined as the number of distinct individuals with the disorder harboring dnLoF (dnMis) mutations in the gene. High-confidence dnLoF (dnMis) genes for ASD, epilepsy, ID, and DD were defined as genes with at least three dnLoF (dnMis) mutations in each disorder. For high-confidence gene sets with fewer than 20 genes (dnLoF-Epi, dnLoF-ID, dnMis-Epi, and dnMis-ID), we used genes with at least two de novo mutations. For comparison, we used several control sets: (1) genes with at least one dnLoF mutation in unaffected ASD siblings in the denovo-db database as sibling controls; (2) genes with at least one LoF mutation in the ExAC database (Lek et al. 2016) with known neuropsychiatric cohorts removed as general controls; (3) Brain-GRF, a literature-curated list of gene regulatory factors that function in the human brain (Berto et al. 2016); (4) synapse genes from the SynGO knowledge base (Koopmans et al. 2019). SFARI ASD genes from the SFARI Gene database (Basu et al. 2009) were grouped into syndromic genes (category S) and genes with different evidence levels (categories 1–6; high confidence-low evidence). In addition, we assessed whether pathogenicity metrics such as CADD score (Kircher et al. 2014) could improve NDD gene sets with dnMis mutations. We focused on ASD and DD genes with a large number of dnMis mutations and obtained two high-confidence gene sets: ASD gene sets harboring at least two dnMis mutations with CADD score > 25, and DD gene sets harboring at least three dnMis mutations with CADD score > 25.
Processing scRNA-seq data according to cell type and stage
Human fetal prefrontal cortical scRNA-seq data (Zhong et al. 2018) were downloaded from the NCBI Gene Expression Omnibus (GEO) under the accession number GSE104276. The transcript counts of each cell were normalized to transcripts per million (TPM), in which TPM is the transcript count of each gene divided by the total transcript count of the cell and multiplied by one million. Gene-level TPM expression values were further transformed to log2 (TPM + 1) values.
Based on the sample annotation file, cells were first divided into six major types: NPCs, excitatory neurons, interneurons, astrocytes, OPCs, and microglia. For each type, genes were considered to be expressed in that type if the expression level was >0 in at least 10% of cells for that type. Samples in each major cell type were further divided into cell stages based on developmental time points, and only the cell stages containing at least 50 samples were used for analysis. Only the time-matched cell stages containing at least 50 samples in both NPCs and excitatory neurons (astrocytes or OPCs) were used to study the differentiation from NPCs to excitatory neurons (astrocytes or OPCs). Samples in NPCs were further divided into three cell subtypes: vRG cells, oRG cells, and IPCs according to the clustering result of NPCs (Zhong et al. 2018), in which vRG cells correspond to clusters 1, 2, and 6; oRG cells correspond to clusters 7, 8, and 9; and IPCs correspond to clusters 3, 4, and 5. Samples in excitatory neurons at GW16 were also divided into three cell subclusters: Ex_C3, Ex_C4, and Ex_C5 according to the clustering result of excitatory neurons (Zhong et al. 2018). P-values for the expression difference of layer marker genes between GW16 excitatory neuron subclusters and GW10 excitatory neurons were computed using DESeq2 on unnormalized counts (Love et al. 2014). P-values for the overlap between eight NDD gene sets were calculated by the one-sided Fisher's exact test using genes expressed in at least one major cell type as background genes.
Construction of coexpression networks
To construct a coexpression network for each of six major cell types, we used genes expressed in the cell type as background genes. We first computed the pairwise Spearman's rank correlation coefficients between background genes and sorted all the pairwise Spearman's correlation coefficients in descending order. Then, we determined the correlation threshold for the top 0.5% highest pairwise Spearman's correlation coefficients (commonly used to construct coexpression networks) (Lee et al. 2004; Crow et al. 2016), and the value 0.5% was defined as coexpression network density for the background genes. Next, we used the same correlation threshold to construct a coexpression network for a given gene set.
For cell stages divided based on developmental time points in each major cell type, we used genes expressed in the major cell type as background genes. For three cell subtypes of NPCs: vRG cells, oRG cells, and IPCs as well as their transitions, we used genes expressed in NPCs as background genes. Genes expressed in either NPCs or excitatory neurons were defined as genes expressed in the NPC-to-excitatory neuron differentiation and used as background genes for the differentiation. The coexpression degree of a gene in the coexpression network is the number of genes coexpressed with the gene. All the coexpression networks were visualized using Cytoscape (Shannon et al. 2003).
Coexpression enrichment analysis
When constructing a coexpression network for the background genes in one cell type, the value 0.5% used for selection of correlation threshold was defined as coexpression network density for the background genes. Similarly, the coexpression network density for a gene set was defined as the number of significant coexpressed pairs divided by the number of all pairs between genes in the gene set. Then, the coexpression fold enrichment score for the gene set was defined as the ratio of the coexpression network density for the gene set to the coexpression network density for the background genes. The statistical significance of the coexpression fold enrichment score of the gene set was assessed in two ways. First, we compared the coexpression network density for the gene set against the coexpression network density for the background genes by the one-sided Fisher's exact test with R function:
where A is the number of significant coexpressed pairs between genes in the gene set; B is the number of all pairs between genes in the gene set; C is the number of significant coexpressed pairs between the background genes; and D is the number of all pairs between the background genes. Second, we also assessed the statistical significance of the coexpression fold enrichment score of the gene set by comparing whether the gene set has a higher coexpression fold enrichment score than the other NDD gene sets. Similarly, the one-sided Fisher's exact test was used to compute the statistical significance of the comparison of the coexpression network density for the gene set against the coexpression network density for another NDD gene set.
Downsampling to control for sample size difference
The six major cell types had different sample sizes, and microglia had a minimum sample size (68 cells). For fair comparison across the major cell types, we downsampled the same number of cells (68 cells) 1000 times for NPCs, excitatory neurons, interneurons, astrocytes, and OPCs to calculate coexpression fold enrichment score. For fair comparison across the cell stages of the major cell types, we downsampled the same number of cells (50 cells) 1000 times for each cell stage to calculate a coexpression fold enrichment score. For cell-type transition or differentiation between one cell type with a small population and another more abundant cell type: (1) We downsampled the cell type with the larger population 1000 times to calculate coexpression fold enrichment score; (2) we downsampled the combined population through sampling equal number of cells from each individual cell type and repeated 1000 times to calculate the coexpression fold enrichment score. To calculate the distribution of average Spearman's correlation coefficients of an NDD gene set for each condition by downsampling, the pairwise Spearman's rank correlation coefficients within an NDD gene set were averaged and repeated 1000 times.
Correlation with dnLoF-ASD and dnMis-Epi genes
For the calculation of correlation with dnLoF-ASD genes in NPCs, we used genes expressed in NPCs as background genes. For any non-dnLoF-ASD gene expressed in NPCs, the correlation with dnLoF-ASD genes for the gene was defined as the average Spearman's correlation coefficients between the gene and dnLoF-ASD genes. For any dnLoF-ASD gene expressed in NPCs, the correlation with dnLoF-ASD genes for the gene was defined as the average Spearman's correlation coefficients between the gene and the other dnLoF-ASD genes. Based on the correlation with dnLoF-ASD genes for any gene expressed in NPCs, we then obtained the distribution of correlations with dnLoF-ASD genes for different types of ASD genes. Differences in correlations between different ASD gene sets were estimated using the one-sided Wilcoxon rank-sum test. A similar analysis was performed to compute the correlation with dnLoF-ASD genes during the transition from vRG cells to IPCs at GW10 using genes expressed in NPCs as background genes. A similar analysis was performed to compute the correlation with dnMis-Epi genes in interneurons and the transition from vRG cells to IPCs at GW10 using genes expressed in interneurons and NPCs as background genes, respectively.
GO enrichment analysis of dnLoF-ASD and dnMis-Epi genes
To perform GO enrichment analysis, the ontology and human annotation files were downloaded from the GO database (http://www.geneontology.org). To compute the overlap between dnLoF-ASD genes and GO biological process terms during the transition from vRG cells to IPCs at GW10, we used genes expressed in NPCs as background genes. Genes that are annotated under the GO terms but not expressed in NPCs were removed. Only GO terms with the remaining gene number between 10 and 1000 after filtering were used for GO enrichment analysis. P-values of the overlap between dnLoF-ASD genes and GO terms were computed using the one-sided Fisher's exact test and corrected for multiple hypothesis testing using false discovery rate (FDR) (Benjamini and Hochberg 1995). For GO enrichment analysis of dnMis-Epi genes, the same process was repeated.
GO correlation analysis of dnLoF-ASD and dnMis-Epi genes during the cell-type transition
Based on the correlation with dnLoF-ASD genes during the vRG-to-IPC transition at GW10 for any background gene expressed in NPCs, we then obtained the distribution of correlations with dnLoF-ASD genes during the transition for genes annotated under a GO biological process term. Only GO terms with the remaining gene number between 10 and 1000 after filtering by the background genes were used. Then, we computed, by the one-sided Wilcoxon rank-sum test, the P-value for whether genes annotated under the GO term have higher correlations than the background genes. We used this P-value to measure how strongly the GO term positively correlates with dnLoF-ASD genes during the transition. We used the one-sided Wilcoxon rank-sum test to compute P-value for whether genes annotated under the GO term have lower correlations than the background genes. We used this P-value to measure how strongly the GO term negatively correlates with dnLoF-ASD genes during the transition. The P-values for all GO terms from GO positive or negative correlation analysis of dnLoF-ASD genes during the transition were adjusted using the Benjamini–Hochberg method. For GO correlation analysis of dnMis-Epi genes during the vRG-to-IPC transition, the same process was repeated.
Expression change of dnLoF-ASD and dnMis-Epi genes during cell-type transitions
To compute the log2(fold change) value for a gene during the transition from vRG cells to IPCs at GW10, gene expression TPM values of the gene in the vRG and IPC samples at GW10 were added by 1. Then, the average expression of the gene across samples in IPCs at GW10 was divided by the average expression of the gene across samples in vRG cells at GW10 and then log2 transformed. Based on the log2(fold change) value for any gene, we then obtained the distribution of log2(fold change) values for dnLoF-ASD or dnMis-Epi genes. Next, we used the one-sided Wilcoxon rank-sum test to compute the P-value to determine whether dnLoF-ASD or dnMis-Epi genes have higher log2(fold change) values than the background genes (genes expressed in NPCs) during the transition. A similar analysis was performed to compute the statistical significance of expression change for dnLoF-ASD and dnMis-Epi genes during the differentiation at GW10 from NPCs, vRG, and IPCs to excitatory neurons, and during the differentiation at GW16 from NPCs, vRG, oRG, and IPCs to excitatory neurons.
GO expression change analysis during the cell-type transition
Based on the log2(fold change) value for any gene during the transition from vRG cells to IPCs at GW10, we obtained the distribution of log2(fold change) values for genes annotated under a GO biological process term. We used only GO terms with between 10 and 1000 genes remaining after filtering by genes expressed in NPCs. We used the one-sided Wilcoxon rank-sum test to compute P-values for whether genes annotated under the GO term have higher (expression increase) or lower (expression decrease) log2(fold change) values than the background (NPC) genes. The P-values for all GO terms from GO expression change analysis during the transition were adjusted using the Benjamini–Hochberg method.
Software availability
Code used in this study is available at GitHub (https://github.com/kpang/CEA) and as Supplemental Code.
Competing interest statement
The authors declare no competing interests.
Supplementary Material
Acknowledgments
We thank Shu Zhang and Fuchou Tang for kindly sharing the detailed clustering result of cell subtypes, which can be downloaded now from the NCBI Gene Expression Omnibus (GEO; https://www.ncbi.nlm.nih.gov/geo/), accession number GSE104276. We thank Mingshan Xue, Dmitry Velmeshev, Hyun-Hwan Jeong, and Ying-Wooi Wan for valuable discussions. We thank V.L. Brandt for editing the manuscript. This work was supported by the National Institute of General Medical Sciences (R01-GM120033), National Science Foundation–Division of Mathematical Sciences (DMS-1263932), Cancer Prevention and Research Institute of Texas (RP170387), Houston Endowment, the Hamill Foundation, and Chao Family Foundation (Z.L.), Huffington Foundation, Howard Hughes Medical Institute (H.Y.Z.). L.W. was supported by a predoctoral fellowship from Autism Speaks (#9120).
Author contributions: K.P., L.W., H.Y.Z., and Z.L. conceived and designed the study. K.P. performed analyses. All the authors interpreted the results. K.P., L.W., H.Y.Z., and Z.L. wrote the manuscript with input from W.W., J.Z., C.C., and K.H.
Footnotes
[Supplemental material is available for this article.]
Article published online before print. Article, supplemental material, and publication date are at http://www.genome.org/cgi/doi/10.1101/gr.254987.119.
References
- Anttila V, Bulik-Sullivan B, Finucane HK, Walters RK, Bras J, Duncan L, Escott-Price V, Falcone GJ, Gormley P, Malik R, et al. 2018. Analysis of shared heritability in common disorders of the brain. Science 360: eaap8757 10.1126/science.aap8757 [DOI] [PMC free article] [PubMed] [Google Scholar]
- Arnsten AFT. 2006. Fundamentals of attention-deficit/hyperactivity disorder: circuits and pathways. J Clin Psychiatry 67 (Suppl 8): 7–12. 10.1111/j.1545-5300.2007.00199.x [DOI] [PubMed] [Google Scholar]
- Barcia G, Fleming MR, Deligniere A, Gazula V-R, Brown MR, Langouet M, Chen H, Kronengold J, Abhyankar A, Cilio R, et al. 2012. De novo gain-of-function KCNT1 channel mutations cause malignant migrating partial seizures of infancy. Nat Genet 44: 1255–1259. 10.1038/ng.2441 [DOI] [PMC free article] [PubMed] [Google Scholar]
- Basu SN, Kollu R, Banerjee-Basu S. 2009. AutDB: a gene reference resource for autism research. Nucleic Acids Res 37: D832–D836. 10.1093/nar/gkn835 [DOI] [PMC free article] [PubMed] [Google Scholar]
- Benjamini Y, Hochberg Y. 1995. Controlling the false discovery rate: a practical and powerful approach to multiple testing. J R Stat Soc 57: 289–300. 10.1111/j.2517-6161.1995.tb02031.x [DOI] [Google Scholar]
- Ben-Shalom R, Keeshen CM, Berrios KN, An JY, Sanders SJ, Bender KJ. 2017. Opposing effects on NaV1.2 function underlie differences between SCN2A variants observed in individuals with autism spectrum disorder or infantile seizures. Biol Psychiatry 82: 224–232. 10.1016/j.biopsych.2017.01.009 [DOI] [PMC free article] [PubMed] [Google Scholar]
- Bernier R, Golzio C, Xiong B, Stessman HA, Coe BP, Penn O, Witherspoon K, Gerdts J, Baker C, Vulto-Van Silfhout AT, et al. 2014. Disruptive CHD8 mutations define a subtype of autism early in development. Cell 158: 263–276. 10.1016/j.cell.2014.06.017 [DOI] [PMC free article] [PubMed] [Google Scholar]
- Berto S, Perdomo-Sabogal A, Gerighausen D, Qin J, Nowick K. 2016. A consensus network of gene regulatory factors in the human frontal lobe. Front Genet 7: 31 10.3389/fgene.2016.00031 [DOI] [PMC free article] [PubMed] [Google Scholar]
- Betancur C. 2011. Etiological heterogeneity in autism spectrum disorders: more than 100 genetic and genomic disorders and still counting. Brain Res 1380: 42–77. 10.1016/j.brainres.2010.11.078 [DOI] [PubMed] [Google Scholar]
- Chang J, Gilman SR, Chiang AH, Sanders SJ, Vitkup D. 2015. Genotype to phenotype relationships in autism spectrum disorders. Nat Neurosci 18: 191–198. 10.1038/nn.3907 [DOI] [PMC free article] [PubMed] [Google Scholar]
- Courchesne E, Pierce K, Schumann CM, Redcay E, Buckwalter JA, Kennedy DP, Morgan J. 2007. Mapping early brain development in autism. Neuron 56: 399–413. 10.1016/j.neuron.2007.10.016 [DOI] [PubMed] [Google Scholar]
- Courchesne E, Pramparo T, Gazestani VH, Lombardo MV, Pierce K, Lewis NE. 2019. The ASD Living Biology: from cell proliferation to clinical phenotype. Mol Psychiatry 24: 88–107. 10.1038/s41380-018-0056-y [DOI] [PMC free article] [PubMed] [Google Scholar]
- Crow M, Paul A, Ballouz S, Huang ZJ, Gillis J. 2016. Exploiting single-cell expression to characterize co-expression replicability. Genome Biol 17: 101 10.1186/s13059-016-0964-6 [DOI] [PMC free article] [PubMed] [Google Scholar]
- Deciphering Developmental Disorders Study. 2017. Prevalence and architecture of de novo mutations in developmental disorders. Nature 542: 433–438. 10.1038/nature21062 [DOI] [PMC free article] [PubMed] [Google Scholar]
- de Ligt J, Willemsen MH, van Bon BWM, Kleefstra T, Yntema HG, Kroes T, Vulto-van Silfhout AT, Koolen DA, de Vries P, Gilisen C, et al. 2012. Diagnostic exome sequencing in persons with severe intellectual disability. N Engl J Med 367: 1921–1929. 10.1056/NEJMoa1206524 [DOI] [PubMed] [Google Scholar]
- De Rubeis S, He X, Goldberg AP, Poultney CS, Samocha K, Ercument Cicek A, Kou Y, Liu L, Fromer M, Walker S, et al. 2014. Synaptic, transcriptional and chromatin genes disrupted in autism. Nature 515: 209–215. 10.1038/nature13772 [DOI] [PMC free article] [PubMed] [Google Scholar]
- Epi4K and EPGP Investigators. 2013. De novo mutations in epileptic encephalopathies. Nature 501: 217–221. 10.1038/nature12439 [DOI] [PMC free article] [PubMed] [Google Scholar]
- Ernst C. 2016. Proliferation and differentiation deficits are a major convergence point for neurodevelopmental disorders. Trends Neurosci 39: 290–299. 10.1016/j.tins.2016.03.001 [DOI] [PubMed] [Google Scholar]
- EuroEPINOMICS-RES Consortium, Epilepsy Phenome/Genome Project, Epi4K Consortium. 2017. De novo mutations in synaptic transmission genes including DNM1 cause epileptic encephalopathies. Am J Hum Genet 100: 179 10.1016/j.ajhg.2016.12.012 [DOI] [PMC free article] [PubMed] [Google Scholar]
- Fietz SA, Kelava I, Vogt J, Wilsch-Bräuninger M, Stenzel D, Fish JL, Corbeil D, Riehn A, Distler W, Nitsch R, et al. 2010. OSVZ progenitors of human and ferret neocortex are epithelial-like and expand by integrin signaling. Nat Neurosci 13: 690–699. 10.1038/nn.2553 [DOI] [PubMed] [Google Scholar]
- Gompers AL, Su-Feher L, Ellegood J, Copping NA, Riyadh MA, Stradleigh TW, Pride MC, Schaffler MD, Wade AA, Catta-Preta R, et al. 2017. Germline Chd8 haploinsufficiency alters brain development in mouse. Nat Neurosci 20: 1062–1073. 10.1038/nn.4592 [DOI] [PMC free article] [PubMed] [Google Scholar]
- Gulsuner S, Walsh T, Watts AC, Lee MK, Thornton AM, Casadei S, Rippey C, Shahin H, Nimgaonkar VL, Go RCP, et al. 2013. Spatial and temporal mapping of de novo mutations in schizophrenia to a fetal prefrontal cortical network. Cell 154: 518–529. 10.1016/j.cell.2013.06.049 [DOI] [PMC free article] [PubMed] [Google Scholar]
- Hamdan FF, Myers CT, Cossette P, Lemay P, Spiegelman D, Laporte AD, Nassif C, Diallo O, Monlong J, Cadieux-Dion M, et al. 2017. High rate of recurrent de novo mutations in developmental and epileptic encephalopathies. Am J Hum Genet 101: 664–685. 10.1016/j.ajhg.2017.09.008 [DOI] [PMC free article] [PubMed] [Google Scholar]
- Hansen DV, Lui JH, Parker PRL, Kriegstein AR. 2010. Neurogenic radial glia in the outer subventricular zone of human neocortex. Nature 464: 554–561. 10.1038/nature08845 [DOI] [PubMed] [Google Scholar]
- Haydar TF, Luebke JI, Medalla M, Guillamon-Vivancos T, Tyler WA. 2015. Neural precursor lineages specify distinct neocortical pyramidal neuron types. J Neurosci 35: 6142–6152. 10.1523/JNEUROSCI.0335-15.2015 [DOI] [PMC free article] [PubMed] [Google Scholar]
- Heyne HO, Singh T, Stamberger H, Abou Jamra R, Caglayan H, Craiu D, De Jonghe P, Guerrini R, Helbig KL, Koeleman BPC, et al. 2018. De novo variants in neurodevelopmental disorders with epilepsy. Nat Genet 50: 1048–1053. 10.1038/s41588-018-0143-7 [DOI] [PubMed] [Google Scholar]
- Hormozdiari F, Penn O, Borenstein E, Eichler EE. 2015. The discovery of integrated gene networks for autism and related disorders. Genome Res 25: 142–154. 10.1101/gr.178855.114 [DOI] [PMC free article] [PubMed] [Google Scholar]
- Iossifov I, O'Roak BJ, Sanders SJ, Ronemus M, Krumm N, Levy D, Stessman HA, Witherspoon KT, Vives L, Patterson KE, et al. 2014. The contribution of de novo coding mutations to autism spectrum disorder. Nature 515: 216–221. 10.1038/nature13908 [DOI] [PMC free article] [PubMed] [Google Scholar]
- Kang HJ, Kawasawa YI, Cheng F, Zhu Y, Xu X, Li M, Sousa AMM, Pletikos M, Meyer KA, Sedmak G, et al. 2011. Spatio-temporal transcriptome of the human brain. Nature 478: 483–489. 10.1038/nature10523 [DOI] [PMC free article] [PubMed] [Google Scholar]
- Kircher M, Witten DM, Jain P, O'Roak BJ, Cooper GM, Shendure J. 2014. A general framework for estimating the relative pathogenicity of human genetic variants. Nat Genet 46: 310–315. 10.1038/ng.2892 [DOI] [PMC free article] [PubMed] [Google Scholar]
- Koopmans F, van Nierop P, Andres-Alonso M, Byrnes A, Cijsouw T, Coba MP, Cornelisse LN, Farrell RJ, Goldschmidt HL, Howrigan DP, et al. 2019. SynGO: an evidence-based, expert-curated knowledge base for the synapse. Neuron 103: 217–234.e4. 10.1016/j.neuron.2019.05.002 [DOI] [PMC free article] [PubMed] [Google Scholar]
- Kriegstein A, Noctor S, Martínez-Cerdeño V. 2006. Patterns of neural stem and progenitor cell division may underlie evolutionary cortical expansion. Nat Rev Neurosci 7: 883–890. 10.1038/nrn2008 [DOI] [PubMed] [Google Scholar]
- Krishnan A, Zhang R, Yao V, Theesfeld CL, Wong AK, Tadych A, Volfovsky N, Packer A, Lash A, Troyanskaya OG. 2016. Genome-wide prediction and functional characterization of the genetic basis of autism spectrum disorder. Nat Neurosci 19: 1454–1462. 10.1038/nn.4353 [DOI] [PMC free article] [PubMed] [Google Scholar]
- Krogan N, Bae B, Jayaraman D, Mancias JD, Harper JW, Reiter JF, Vagnoni C, Gonzalez DM, Mochida GH, Yu TW, et al. 2016. Microcephaly proteins Wdr62 and Aspm define a mother centriole complex regulating centriole biogenesis, apical complex, and cell fate. Neuron 92: 813–828. 10.1016/j.neuron.2016.09.056 [DOI] [PMC free article] [PubMed] [Google Scholar]
- Krumm N, Turner TN, Baker C, Vives L, Mohajeri K, Witherspoon K, Raja A, Coe BP, Stessman HA, He ZX, et al. 2015. Excess of rare, inherited truncating mutations in autism. Nat Genet 47: 582–588. 10.1038/ng.3303 [DOI] [PMC free article] [PubMed] [Google Scholar]
- Lado FA, Rubboli G, Capovilla P, Avanzini G, Moshé SL. 2013. Pathophysiology of epileptic encephalopathies. Epilepsia 54: 6–13. 10.1111/epi.12417 [DOI] [PMC free article] [PubMed] [Google Scholar]
- Lee HK, Hsu AK, Sajdak J, Qin J, Pavlidis P. 2004. Coexpression analysis of human genes across many microarray data sets. Genome Res 14: 1085–1094. 10.1101/gr.1910904 [DOI] [PMC free article] [PubMed] [Google Scholar]
- Lek M, Karczewski KJ, Minikel EV, Samocha KE, Banks E, Fennell T, O'Donnell-Luria AH, Ware JS, Hill AJ, Cummings BB, et al. 2016. Analysis of protein-coding genetic variation in 60,706 humans. Nature 536: 285–291. 10.1038/nature19057 [DOI] [PMC free article] [PubMed] [Google Scholar]
- Lelieveld SH, Reijnders MRF, Pfundt R, Yntema HG, Kamsteeg EJ, De Vries P, De Vries BBA, Willemsen MH, Kleefstra T, Löhner K, et al. 2016. Meta-analysis of 2,104 trios provides support for 10 new genes for intellectual disability. Nat Neurosci 19: 1194–1196. 10.1038/nn.4352 [DOI] [PubMed] [Google Scholar]
- Lemke JR, Hendrickx R, Geider K, Laube B, Schwake M, Harvey RJ, James VM, Pepler A, Steiner I, Hörtnagel K, et al. 2014. GRIN2B mutations in West syndrome and intellectual disability with focal epilepsy. Ann Neurol 75: 147–154. 10.1002/ana.24073 [DOI] [PMC free article] [PubMed] [Google Scholar]
- Li C, Hong S, Xu Z, Zhang N, Ye Q, Qin CF, Liu X, Jiang Y, Shi L, Xu D. 2016a. Zika virus disrupts neural progenitor development and leads to microcephaly in mice. Cell Stem Cell 19: 120–126. 10.1016/j.stem.2016.04.017 [DOI] [PubMed] [Google Scholar]
- Li D, Yuan H, Ortiz-Gonzalez XR, Marsh ED, Tian L, McCormick EM, Kosobucki GJ, Chen W, Schulien AJ, Chiavacci R, et al. 2016b. GRIN2D recurrent de novo dominant mutation causes a severe epileptic encephalopathy treatable with NMDA receptor channel blockers. Am J Hum Genet 99: 802–816. 10.1016/j.ajhg.2016.07.013 [DOI] [PMC free article] [PubMed] [Google Scholar]
- Lin GN, Corominas R, Lemmens I, Yang X, Tavernier J, Hill DE, Vidal M, Sebat J, Iakoucheva LM. 2015. Spatiotemporal 16p11.2 protein network implicates cortical late mid-fetal brain development and KCTD13-Cul3-RhoA pathway in psychiatric diseases. Neuron 85: 742–754. 10.1016/j.neuron.2015.01.010 [DOI] [PMC free article] [PubMed] [Google Scholar]
- Lo-Castro A, Curatolo P. 2014. Epilepsy associated with autism and attention deficit hyperactivity disorder: Is there a genetic link? Brain Dev 36: 185–193. 10.1016/j.braindev.2013.04.013 [DOI] [PubMed] [Google Scholar]
- Love MI, Huber W, Anders S. 2014. Moderated estimation of fold change and dispersion for RNA-seq data with DESeq2. Genome Biol 15: 550 10.1186/s13059-014-0550-8 [DOI] [PMC free article] [PubMed] [Google Scholar]
- Lui JH, Hansen DV, Kriegstein AR. 2011. Development and evolution of the human neocortex. Cell 146: 18–36. 10.1016/j.cell.2011.06.030 [DOI] [PMC free article] [PubMed] [Google Scholar]
- Martínez-Cerdeño V, Noctor SC, Kriegstein AR. 2006. The role of intermediate progenitor cells in the evolutionary expansion of the cerebral cortex. Cereb Cortex 16 (Suppl 1): i152–i161. 10.1093/cercor/bhk017 [DOI] [PubMed] [Google Scholar]
- McCall MN, Illei PB, Halushka MK. 2016. Complex sources of variation in tissue expression data: analysis of the GTEx lung transcriptome. Am J Hum Genet 99: 624–635. 10.1016/j.ajhg.2016.07.007 [DOI] [PMC free article] [PubMed] [Google Scholar]
- Mihalas AB, Elsen GE, Bedogni F, Daza RAM, Ramos-Laguna KA, Arnold SJ, Hevner RF. 2016. Intermediate progenitor cohorts differentially generate cortical layers and require Tbr2 for timely acquisition of neuronal subtype identity. Cell Rep 16: 92–105. 10.1016/j.celrep.2016.05.072 [DOI] [PMC free article] [PubMed] [Google Scholar]
- Nava C, Dalle C, Rastetter A, Striano P, de Kovel CGF, Nabbout R, Cancès C, Ville D, Brilstra EH, Gobbi G, et al. 2014. De novo mutations in HCN1 cause early infantile epileptic encephalopathy. Nat Genet 46: 640–645. 10.1038/ng.2952 [DOI] [PubMed] [Google Scholar]
- Noctor SC, Martínez-Cerdeño V, Ivic L, Kriegstein AR. 2004. Cortical neurons arise in symmetric and asymmetric division zones and migrate through specific phases. Nat Neurosci 7: 136–144. 10.1038/nn1172 [DOI] [PubMed] [Google Scholar]
- Noebels J. 2015. Pathway-driven discovery of epilepsy genes. Nat Neurosci 18: 344–350. 10.1038/nn.3933 [DOI] [PMC free article] [PubMed] [Google Scholar]
- Nowakowski TJ, Pollen AA, Sandoval-Espinosa C, Kriegstein AR. 2016. Transformation of the radial glia scaffold demarcates two stages of human cerebral cortex development. Neuron 91: 1219–1227. 10.1016/j.neuron.2016.09.005 [DOI] [PMC free article] [PubMed] [Google Scholar]
- Orhan G, Bock M, Schepers D, Ilina EI, Reichel SN, Löffler H, Jezutkovic N, Weckhuysen S, Mandelstam S, Suls A, et al. 2014. Dominant-negative effects of KCNQ2 mutations are associated with epileptic encephalopathy. Ann Neurol 75: 382–394. 10.1002/ana.24080 [DOI] [PubMed] [Google Scholar]
- Pang K, Wan YW, Choi WT, Donehower LA, Sun J, Pant D, Liu Z. 2014. Combinatorial therapy discovery using mixed integer linear programming. Bioinformatics 30: 1456–1463. 10.1093/bioinformatics/btu046 [DOI] [PMC free article] [PubMed] [Google Scholar]
- Parikshak NN, Luo R, Zhang A, Won H, Lowe JK, Chandran V, Horvath S, Geschwind DH. 2013. Integrative functional genomic analyses implicate specific molecular pathways and circuits in autism. Cell 155: 1008–1021. 10.1016/j.cell.2013.10.031 [DOI] [PMC free article] [PubMed] [Google Scholar]
- Rauch A, Wieczorek D, Graf E, Wieland T, Endele S, Schwarzmayr T, Albrecht B, Bartholdi D, Beygo J, Di Donato N, et al. 2012. Range of genetic mutations associated with severe non-syndromic sporadic intellectual disability: an exome sequencing study. Lancet 380: 1674–1682. 10.1016/S0140-6736(12)61480-9 [DOI] [PubMed] [Google Scholar]
- Ronan JL, Wu W, Crabtree GR. 2013. From neural development to cognition: unexpected roles for chromatin. Nat Rev Genet 14: 347–359. 10.1038/nrg3413 [DOI] [PMC free article] [PubMed] [Google Scholar]
- Sanders SJ, He X, Willsey AJ, Ercan-Sencicek AG, Samocha KE, Cicek AE, Murtha MT, Bal VH, Bishop SL, Dong S, et al. 2015. Insights into autism spectrum disorder genomic architecture and biology from 71 risk loci. Neuron 87: 1215–1233. 10.1016/j.neuron.2015.09.016 [DOI] [PMC free article] [PubMed] [Google Scholar]
- Sestan N, State MW. 2018. Lost in translation: traversing the complex path from genomics to therapeutics in autism spectrum disorder. Neuron 100: 406–423. 10.1016/j.neuron.2018.10.015 [DOI] [PMC free article] [PubMed] [Google Scholar]
- Shannon P, Markiel A, Ozier O, Baliga NS, Wang JT, Ramage D, Amin N, Schwikowski B, Ideker T. 2003. Cytoscape: a software environment for integrated models of biomolecular interaction networks. Genome Res 13: 2498–2504. 10.1101/gr.1239303 [DOI] [PMC free article] [PubMed] [Google Scholar]
- Shenhav R, Mahajan MA, Murn J, Tatarakis A, Barry BJ, Golden JA, Baltus AE, Wang EP, Samuels HH, Murphy EA, et al. 2012. Microcephaly gene links trithorax and REST/NRSF to control neural stem cell proliferation and differentiation. Cell 151: 1097–1112. 10.1016/j.cell.2012.10.043 [DOI] [PMC free article] [PubMed] [Google Scholar]
- Shohat S, Ben-David E, Shifman S. 2017. Varying intolerance of gene pathways to mutational classes explain genetic convergence across neuropsychiatric disorders. Cell Rep 18: 2217–2227. 10.1016/j.celrep.2017.02.007 [DOI] [PubMed] [Google Scholar]
- Skinnider MA, Squair JW, Foster LJ. 2019. Evaluating measures of association for single-cell transcriptomics. Nat Methods 16: 381–386. 10.1038/s41592-019-0372-4 [DOI] [PubMed] [Google Scholar]
- Sundelin HEK, Larsson H, Lichtenstein P, Almqvist C, Hultman CM, Tomson T, Ludvigsson JF. 2016. Autism and epilepsy: a population-based nationwide cohort study. Neurology 87: 192–197. 10.1212/WNL.0000000000002836 [DOI] [PMC free article] [PubMed] [Google Scholar]
- Sztainberg Y, Zoghbi HY. 2016. Lessons learned from studying syndromic autism spectrum disorders. Nat Neurosci 19: 1408–1417. 10.1038/nn.4420 [DOI] [PubMed] [Google Scholar]
- Turner TN, Yi Q, Krumm N, Huddleston J, Hoekzema K, F Stessman HA, Doebley AL, Bernier RA, Nickerson DA, Eichler EE. 2017. denovo-db: a compendium of human de novo variants. Nucleic Acids Res 45: D804–D811. 10.1093/nar/gkw865 [DOI] [PMC free article] [PubMed] [Google Scholar]
- Veeramah KR, O'Brien JE, Meisler MH, Cheng X, Dib-Hajj SD, Waxman SG, Talwar D, Girirajan S, Eichler EE, Restifo LL, et al. 2012. De novo pathogenic SCN8A mutation identified by whole-genome sequencing of a family quartet affected by infantile epileptic encephalopathy and SUDEP. Am J Hum Genet 90: 502–510. 10.1016/j.ajhg.2012.01.006 [DOI] [PMC free article] [PubMed] [Google Scholar]
- Vezzani A, French J, Bartfai T, Baram TZ. 2011. The role of inflammation in epilepsy. Nat Rev Neurol 7: 31–40. 10.1038/nrneurol.2010.178 [DOI] [PMC free article] [PubMed] [Google Scholar]
- Vezzani A, Aronica E, Mazarati A, Pittman QJ. 2013. Epilepsy and brain inflammation. Exp Neurol 244: 11–21. 10.1016/j.expneurol.2011.09.033 [DOI] [PubMed] [Google Scholar]
- Willsey AJ, Sanders SJ, Li M, Dong S, Tebbenkamp AT, Muhle RA, Reilly SK, Lin L, Fertuzinhos S, Miller JA, et al. 2013. Coexpression networks implicate human midfetal deep cortical projection neurons in the pathogenesis of autism. Cell 155: 997–1007. 10.1016/j.cell.2013.10.020 [DOI] [PMC free article] [PubMed] [Google Scholar]
- Willsey AJ, Morris MT, Wang S, Willsey HR, Sun N, Teerikorpi N, Baum TB, Cagney G, Bender KJ, Desai TA, et al. 2018. The psychiatric cell map initiative: a convergent systems biological approach to illuminating key molecular pathways in neuropsychiatric disorders. Cell 174: 505–520. 10.1016/j.cell.2018.06.016 [DOI] [PMC free article] [PubMed] [Google Scholar]
- Xiong JY, Liu XY, Li JL, Vallon MW. 2007. Architecture of macromolecular network of soft functional materials: from structure to function. J Phys Chem B 111: 5558–5563. 10.1021/jp070600l [DOI] [PubMed] [Google Scholar]
- Yuan H, Hansen KB, Zhang J, Mark Pierson T, Markello TC, Fajardo KVF, Holloman CM, Golas G, Adams DR, Boerkoel CF, et al. 2014. Functional analysis of a de novo GRIN2A missense mutation associated with early-onset epileptic encephalopathy. Nat Commun 5: 3251 10.1038/ncomms4251 [DOI] [PMC free article] [PubMed] [Google Scholar]
- Yuen RK, Merico D, Bookman M, Howe JL, Thiruvahindrapuram B, Patel RV, Whitney J, Deflaux N, Bingham J, Wang Z, et al. 2017. Whole genome sequencing resource identifies 18 new candidate genes for autism spectrum disorder. Nat Neurosci 20: 602–611. 10.1038/nn.4524 [DOI] [PMC free article] [PubMed] [Google Scholar]
- Zhong S, Zhang S, Fan X, Wu Q, Yan L, Dong J, Zhang H, Li L, Sun L, Pan N, et al. 2018. A single-cell RNA-seq survey of the developmental landscape of the human prefrontal cortex. Nature 555: 524–528. 10.1038/nature25980 [DOI] [PubMed] [Google Scholar]
Associated Data
This section collects any data citations, data availability statements, or supplementary materials included in this article.