Abstract
Human liver microsomes (HLM) are a commonly used tool to study drug metabolism in vitro. Typical experiments conducted using suspensions of HLM can be challenging to separate from the incubation solution without lengthy ultracentrifugation steps. Magnetizable beads coated with silica (MGBS) were found to bind strongly to HLM, which could then be isolated and purified using a magnet. Binding of HLM to the MGBS (HLM-MGBS) was demonstrated to be mediated by strong interactions between microsomal phospholipids and MGBS, as artificially prepared phosphatidylcholine (PC) liposomes could be more efficiently captured by the MGBS. HLM-MGBS complexes retained functional cytochrome P450 and uridine-diphosphate-glucuronosyltransferase (UGT) activity as indicated by CYP2C8-mediated amodiaquine de-ethylation, CYP3A4-mediated midazolam 1’hydroxylation, UGT1A1-mediated glucuronidation of estradiol, UGT1A9-mediated glucuronidation of propofol, and UGT2B7-mediated glucuronidation of zidovudine. When comparing suspension HLM alone with HLM-MGBS complexes containing equivalent amounts of HLM, the intrinsic clearance (CLint) of CYP450 substrates was comparable; however, CLint of UGT1A1, UGT1A9, and UGT2B7 was increased in the HLM-MGBS system between 1.5- and 6-fold. HLM-MGBS used in an incubation could also be readily replaced with fresh HLM-MGBS to maintain the presence of active enzymes. Thus, HLM-MGBS demonstrate increased in vitro metabolic efficiency and manipulability, providing a new platform for determination of accurate metabolic parameters.
SIGNIFICANCE STATEMENT
The following work describes the strong binding of HLM to magnetizable beads. In addition, the preservation of enzyme activity on the bound HLM provides a novel means to conduct preclinical metabolism studies.
Introduction
In drug development, prediction of in vivo drug clearance and drug-drug interaction (DDI) using the data obtained from in vitro metabolism assays facilitates the design of safe and informative clinical studies. Human liver microsomes (HLM) are commonly used as an in vitro tool to study the activity of important hepatic drug metabolizing enzymes such as cytochrome P450s and UGTs (Gunaratna, 2000; Ward, 2005; Argikar et al., 2016). The rapid growth in the number of commercially available HLM products has resulted in lower costs and increased quality; however, there have been relatively few procedural advances in the HLM suspension study protocols since their initial discovery (Claude, 1946; Soars et al., 2003; Rowland et al., 2007).
Typical in vitro HLM incubations involve the addition of an HLM stock solution to a suitable buffer followed by the addition of test substance and a cofactor (if required) to initiate the enzymatic reaction. The rate of depletion of the test substance and/or metabolite formation from the enzymatic reaction(s) can be determined using samples collected during the incubation. Key considerations in these studies include the use of optimal HLM protein concentrations to maximize enzyme activity and minimize nonspecific binding and carefully controlling the duration of incubation to avoid confounding effects of auto-inactivation of sensitive enzyme activities. Furthermore, additional reagents can be used to optimize enzyme activity by enhancing substrate accessibility to the active site (e.g., alamethicin) or to remove inhibitory contaminants (e.g., albumin) (Fisher et al., 2000; Soars et al., 2003). Further processing of HLM suspensions to remove reagents and contaminants requires time-demanding ultracentrifugation procedures. A more rapid and convenient method of separating HLM from the incubation solutions would be considered a substantial advance, as this could facilitate improved utilization of HLM, including but not limited to longer incubations with test substances.
Subcellular fractions, such as microsomes, mitochondria, or nuclei, are composed of phospholipids and proteins that have been found to bind to metalloids, such as silica (Kettiger et al., 2016; Klein et al., 2016). Binding of biologic components to silica has been attributed to strong ionic interactions between positively charged peptides and the negatively charged silanol groups of silica (Meissner et al., 2015). Strong binding of cellular components to silica has successfully been used for purification purposes; for example, magnetizable bead–based separation and purification of nucleic acids has been used extensively to purify mRNA to facilitate downstream gene expression procedures (Bruce and Sen, 2005). Furthermore, larger materials, such as proteins or entire cells, can be isolated with magnetizable beads when used in conjunction with bead-bound antibodies (Haukanes and Kvam, 1993; Shi et al., 2015a,b; Schneemilch and Quirke, 2018). Our work investigates the feasibility of binding metabolically active HLM to MGBS as a potential method of easily manipulating HLM in solutions.
Materials
HLM (lot 38291, mixed gender, 150 donors) were acquired from Corning Inc. (Woburn, MA). Alamethicin, amodiaquine, estradiol, estradiol-3-(β-d-glucuronide), fatty acid–free human serum albumin, magnesium chloride, NADPH, potassium phosphate dibasic, potassium phosphate monobasic, propofol, propofol glucuronide, saccharolactone, Trizma base, uridine diphosphoglucuronic acid (UDPGA), AZT, and AZT glucuronide were purchased from Sigma-Aldrich, Inc. (St. Louis, MO). PC from egg yolk was purchased from EMD Millipore (Burlington, MA). 3′-Azido-3′-deoxythymidine β-d-glucuronide and 3′-azido-3′-deoxythymidine-methyl-d3 β-d-glucuronide were obtained from Toronto Research Chemicals Inc. Magnetizable beads (silica- and dextran-coated) from G-Biosciences (St. Louis, MO) were acquired from Thermo Fisher Scientific (Waltham, MA). Polystyrene carboxylate beads manufactured by GE Healthcare were purchased from Thermo Fisher Scientific.
Methods
Bead Counting
Bead count was determined from microscopic analysis on a Nikon Ti-E microscope using bright-field microscopy, a 10× objective, and disposable Neubeuer hemocytometers. The stock bead suspension was diluted 1000× in potassium phosphate buffer (50 mM, pH 7.4) and imaged after a period of 5–10 minutes to allow the beads to settle on the bottom of the slide chamber. The region of interest for each picture was set to the size of one square representing 1 mm3 of volume on the hemocytometer. The beads were counted using software from Nikon (NIS elements; Nikon Inc.).
HLM-MGBS Preparation.
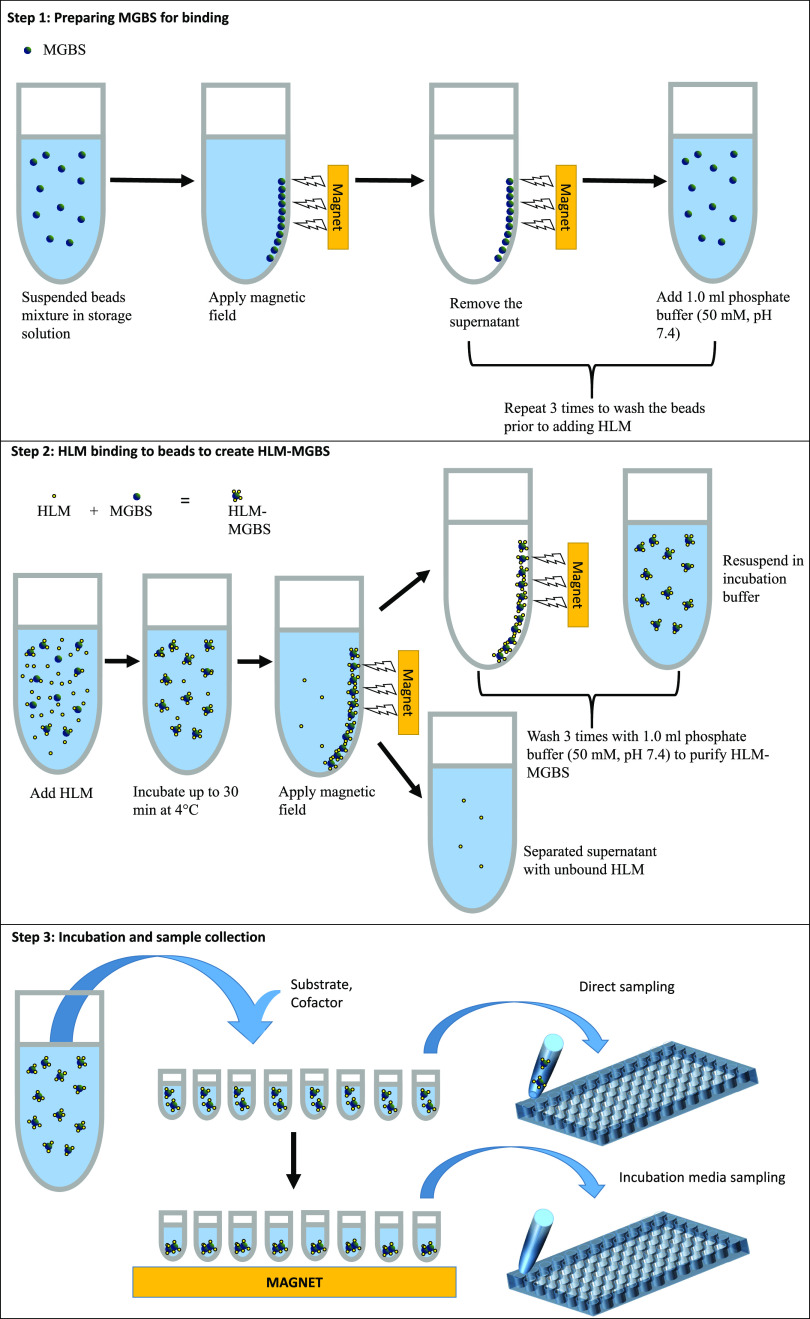
HLM-MGBS were prepared using MGBS (G-Biosciences Inc.). To remove stock bead storage solution, stock beads (at concentrations up to 530 × 109 beads per milliliter) in a 1.5-ml microcentrifuge tube were subjected to a strong magnetic field (DYNAL magnetic stand; Invitrogen Inc.). When nearly all beads were attached to the magnetic side of the tube, the supernatant was replaced with 1 ml of phosphate buffer (50 mM, pH 7.4). This procedure was repeated a total of three times. On the last repetition, the supernatant was replaced with phosphate buffer (50 mM, pH 7.4) or Tris-HCl buffer (100 mM, pH 7.8). HLM stock solution (20 mg/ml) was added to the bead mixture to reach the desired concentration. The tube was mixed gently at 4°C for up to 30 minutes to allow the HLM to bind to the beads. HLM-MGBS were purified by reapplying the magnetic field to remove supernatant containing unbound HLM (which are further quantitated using a suitable method such as Bradford protein assay). The MGBS were washed three more times in incubation buffer prior to the conduct of studies. The HLM content bound to MGBS was determined by the difference in the amount of HLM in the supernatant prior to and after MGBS treatment. The steps to prepare the beads are illustrated in Fig. 1.
Fig. 1.
General procedure for preparing and using HLM-MGBS.
Bead Imaging
Beads dispensed into individual wells on a 24-well 1.5 coverslip plate (Mattek Inc., Ashland, MA) were imaged using a Nikon CFI Plan Apochromat VC 60× oil objective with phase contrast. Labeling of HLM on MGBS was conducted using a glibenclamide-fluorophore drug conjugate targeted to HLM [ER-Tracker RED (BODIPY TR Glibenclamide); Thermo Fisher Scientific Inc.]. Z-stacked confocal images of the HLM-MGBS (81 images in total) were captured with an emission wavelength of 697.5 nm and a Crestoptics X-Light confocal attachment on a Nikon TiE microscope. Image analysis was conducted using software from Nikon (NIS Elements; Nikon Inc.).
Quantification of HLM and HSA
Human serum albumin and HLM were quantified by measuring the colorimetric reaction between Coomasie Blue and protein (Bradford, 1976). Colorimetric changes were assessed on a Multiskan FC spectrophotometric microplate reader (Thermo Fisher Scientific Inc.) at an absorption wavelength of 595 nm. Bovine albumin standards were used for quantitation.
Phosphatidylcholine Liposome Preparation and Quantitation
PC liposomes were prepared by drying 0.1 mg/ml of egg yolk PC in ethanol under a stream of nitrogen for 4 hours. Distilled water (4 ml) was added to the resulting micelles. The suspension was vortexed and passed through a 100-nm filter (15 passes) on a LiposoFast liposomal preparation apparatus. The resulting suspension of 100-nm-diameter liposomes or 20 mg/ml HLM was then quantified by using a phospholipid detection kit that measures the choline moiety of the phospholipid after cholinesterase-mediated cleavage from the long carbon chain of the fatty acid (Biovision, Milpitas, CA).
Comparison of PC, HSA, and HLM Binding to Beads
HLM are composed of a mixture of proteins and phospholipids. To evaluate which of these two components most effectively binds to the magnetizable beads, a comparison of magnetic bead binding between protein (HSA as a surrogate for HLM proteins), HLM, and phospholipids (PC, as surrogate for HLM phospholipids) was undertaken. A concentration of 0.5 mg/ml HLM was prepared in phosphate buffer (50 mM, pH 7.4). The concentration of PC used was set to be equivalent to the concentration of phospholipids in 0.5 mg/ml HLM. The concentration of HSA used was 0.5 mg/ml to approximate the same concentration of protein in HLM. Incubations were started by washing the MGBS (13.1 × 10⁹ beads) three times with phosphate buffer. The supernatant was removed from the beads and replaced with 1 ml of HLM, PC, or HSA solutions. Equivalent incubations without beads were also prepared as controls. Binding to the beads was allowed to proceed for 30 minutes at a temperature of 4°C. After the binding period, the solutions were subjected to a magnetic field for 5 minutes. The supernatant was assayed for phospholipid and protein content as described above. All studies were conducted in triplicate.
Assessment of HLM Binding to Beads Preloaded with PC
MGBS (5.3 × 10⁹ beads) were washed three times in phosphate buffer (50 mM, pH 7.4). The MGBS were immersed in the same phosphate buffer containing PC at concentrations of 0, 100, 200, 400, 800, and 1600 nmol/ml. The solution of liposomes and MGBS were mixed at 4°C for 30 minutes. The test tube was then subjected to a magnetic field, and the unbound liposomes were removed. The liposome-MGBSs were washed once with phosphate buffer (50 mM, pH 7.4) and resuspended in the same buffer. HLM (20 mg/ml) were added to the mixture to make a final concentration of 0.2 mg/ml HLM for a final volume of 1 ml. The composition was mixed at 4°C for 30 minutes. The test tubes were subjected to a magnetic field, and the content of HLM protein in the supernatant was measured. The amount of HLM bound to the MGBS was determined to be the difference between the measured HLM concentration in media with and without liposome-MGBS. Control experiments were conducted on the same content of MGBS without PC preloading.
Assessment of MGBS Binding Capacity of HLM and the Wash Effect on Dissociation of HLM from Beads
To assess MGBS binding capacity of HLM, MGBS in quantities of 2.2, 5.5, 11, and 21 × 109 beads were washed 3× and resuspended in phosphate buffer (50 mM, pH 7.4) to final volume 1 ml. Aliquots of each MGBS mixture (95 µl) were dispensed into a 96-well, v-bottom plate. HLM stock solutions (5 µl, up to 20 mg/ml) were added to each well to reach final concentrations of 0.2, 0.5, 0.8, or 1 mg/ml. The plate was sealed with a silicone mat and then incubated at 4°C with constant rotation for a period of 30 minutes. The plate was then centrifuged for 30 seconds at 1000 rpm and then placed onto a 96-position ring magnet to separate HLM-MGBS from the buffer. HLM remaining in the buffer was quantified as described above. To assess multiple washes on HLM retention onto MGBS, HLM-MGBS (530 × 109 beads) with an equivalent HLM concentration of 1 mg/ml were prepared as described above. However, after the 30-minute incubation step, HLM-MGBS were washed five times with 1 ml of phosphate buffer (50 mM, pH 7.4). HLM content was measured in a 1 mg/ml suspension of HLM and compared with the HLM content in the supernatant of the HLM-MGBS suspension immediately after the incubation step and in the supernatant after each wash step.
CYP2C8 and CYP3A4 Metabolic Assays
HLM-MGBS were prepared as mentioned above to a final concentration of 1 mg/ml. Incubation mixtures consisted of potassium phosphate buffer (100 mM, pH 7.4) and 0.02 mg/ml HLM. The mixture was then incubated at 37°C for 5 minutes. Midazolam or amodiaquine (0.005–20 µM) were added to the incubated samples, and reactions were initiated with 2 mM NADPH. Reactions were stopped by adding 0.1 µM labetalol in acetonitrile/formic acid solution (1000:1, v/v). Metabolite formation was assessed by LC-MS/MS. 1′Hydroxymidazolam and desethylamodiaquine were quantified on a Waters Acquity Ultra Performance Liquid Chromatography instrument with an ACQUITY Ultra Performance Liquid Chromatography Ethylene bridged hybrid C18, 1.7 µm, 2.1 × 50 mm, (40°C) column and a SciEx Triple Quad 6500+ using Analyst software (version 1.7). Solvent A: 95% H2O + 5% acetonitrile + 0.1% formic acid; solvent B: 95% acetonitrile + 5% H2O + 0.1% formic acid. Multiple reaction monitoring mode employed mass-to-charge transitions of 328→282 for desethylamodiaquine, 342→324 for 1′hydroxymidazolam, and 329→294.3 for labetalol (internal standard).
Glucuronidation Activity Assays for UGT1A1, UGT1A9, and UGT2B7
To evaluate the effect of MGBS treatment on UGT activity, the kinetic parameters of UGT1A1, UGT1A9, and UGT2B7 in HLM were determined in the presence and absence of MGBS. MGBS were prepared as mentioned above. Incubation mixtures consisted of HLM, UDPGA (5.0 mM), alamethicin (0.25 µg/ml), saccharolactone (5.1 mM), MgCl2 (8.0 mM), and Tris-Cl (100 mM) at pH 7.8 and the probe substrates estradiol (1.5–120 µM), propofol (4–1500 µM), or AZT (50–7500 µM). Reaction mixtures containing HLM, alamethicin, saccharolactone, and MgCl2 were preincubated at 37°C for 15 minutes, followed by the addition of substrate and 5 minutes of incubation at 37°C; the reaction was then initiated by addition of prewarmed UDPGA and incubated at 37°C. The reactions were quenched by addition of an equal volume of ice-cold acetonitrile containing formic acid (0.1%) and internal standard [AZT (d3) glucuronide, 0.25 µM]. The reaction rates were determined by LC-MS/MS quantification of the glucuronide products formed. All metabolites were eluted through an Agilent Zorbax SB-C18, 50 × 2.1 mm, 5 µm column and quantified using SciEx QTRAP 4000. Metabolite concentrations were determined using Analyst software (version 1.6). The multiple reaction monitoring mode employed mass-to-charge transitions of 447.1→271.1 for estradiol glucuronide, 353.1→177.1 for propofol glucuronide, and 442.1→125 for AZT glucuronide.
Relayed Metabolism of Midazolam
HLM-MGBS were prepared as mentioned above in triplicate and stored in 2 ml of 50 mM phosphate buffer, pH 7.4. The reaction was started by adding 100 µl of HLM-MGBS to a 50-ml conical polypropylene tube containing 19.9 ml of a solution of 50 mM phosphate buffer (pH 7.4), 2 mM NADPH, and midazolam (1 µM). Samples (50 µl) were taken from the incubation up to 160 minutes after the start of the reaction in 20-minute intervals. After the collection of each sample, HLM-MGBS were separated from the buffer with a magnet, and the supernatant was transferred to a new tube with the addition of a fresh aliquot of HLM-MGBS (100 µl). Control experiments with non–MGBS-treated HLM were performed in parallel and were treated identically as the incubations with HLM-MGBS, except without the addition of HLM-MGBS. The content of midazolam and 1′OH midazolam were quantified by LC-MS/MS. The content of 1′OH midazolam formed was not corrected for the addition of fresh HLM-MGBS, as the volume of beads added or samples taken only amounted to approximately 5% of the total volume of the original incubation solution.
Metabolism Data Fitting
The kinetic parameters were derived using GraphPad Prism, version 8 (GraphPad Software LLC). The parameters Km and Vmax were obtained through fitting the data using eq. 1, 2, or 3, depending on goodness of fit based on the Akaike criterion. Equation 1 describes typical Michaelis-Menten kinetics, eq. 2 describes, Michaelis-Menten kinetics in the presence of substrate inhibition, and eq. 3 describes, allosteric sigmoidal kinetics.
 |
(1) |
 |
(2) |
 |
(3) |
Statistics
Enzyme kinetic parameters were derived from three separate data sets with HLM or HLM-MGBS. Statistical significance difference between parameters derived from the two systems was determined using an unpaired Student’s t test.
Results
Quantitation of MGBS
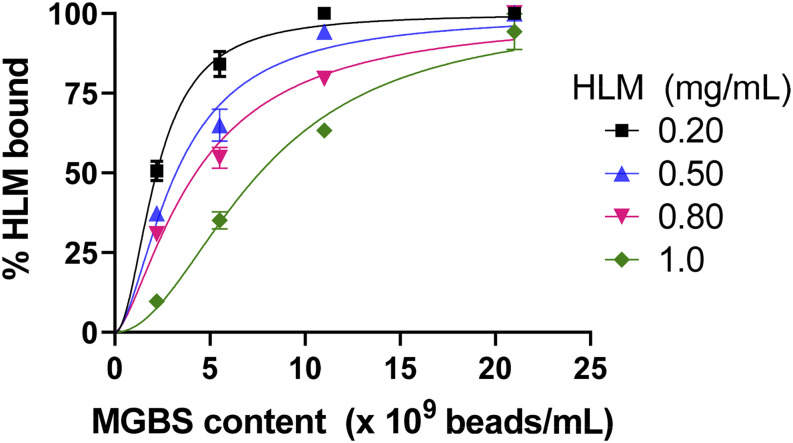
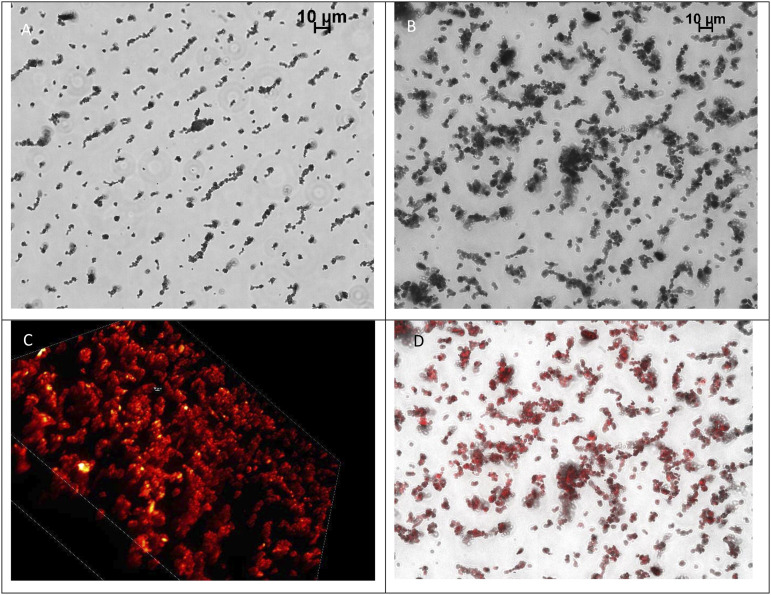
The mean radius of the beads was determined to be 2.6 µm, which was in agreement with the manufacturer’s stated size of 2.5–5.0 µm. The relationship between the number of beads and the percentage of HLM bound at various concentrations of HLM is shown in Fig. 2. Both HLM and bead content affected the percentage of HLM bound to the beads. The data could be sufficiently described using a one-site binding model with the top constraint set to 100. Over 90% of HLM (1 mg/ml) could be bound using 21 × 109 beads (200 µl of stock bead volume). Marked agglomeration of the beads was observed under microscopic examination, and the appearance of the mixture of beads in phosphate buffer (50 mM, pH 7.4) changed from a uniform and flat appearance to a muddy appearance (Fig. 3A vs. Fig. 3B). HLM bound to the beads could be visualized by treating the HLM with glibenclamide labeled with a fluorescent probe (Fig. 3, C and D).
Fig. 2.
Relationship between binding of HLM to magnetic silica beads. Binding was conducted over a period of 30 minutes, with constant mixing at a temperature of 4°C. Quantitation of HLM bound was conducted by measuring protein content remaining in the media after the incubation period. Each point represents the mean ± S.D. from N = 3 separate experiments.
Fig. 3.
Visualization of silica beads treated with and without HLM: (A) Bright-field image of beads alone; (B) HLM-MGBS after binding to fluorophore-glibenclamide drug conjugate; (C) Z-stacked three-dimensional image of HLM-MGBS treated with fluorophore-glibenclamide drug conjugate; (D) Bright-field image of HLM-MGBS merged with an extended-depth focused confocal fluorescence image produced from labeling HLM with fluorophore-glibenclamide drug conjugate. Scale bars, 10 μm.
Microsomal Binding to MGBS
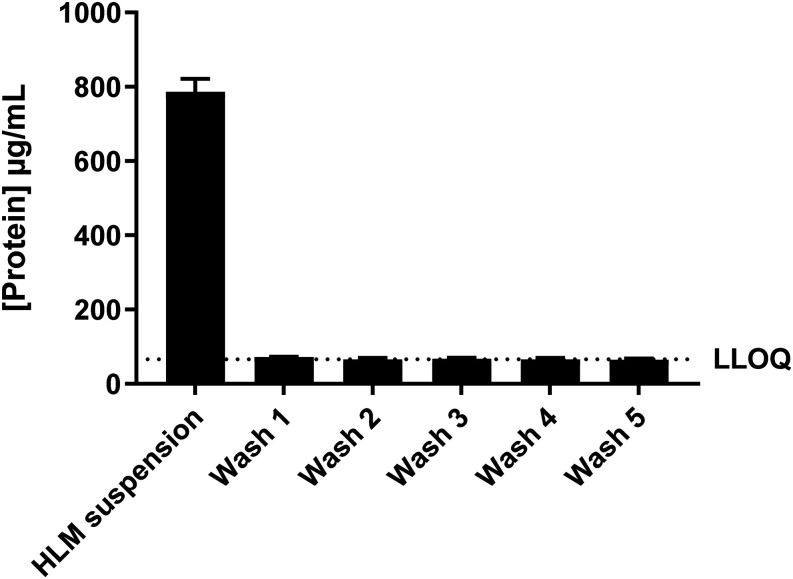
To assess whether HLM are capable of resisting multiple wash steps after binding to MGBS, protein concentration in the supernatant of the HLM-MGBS suspension was measured after MGBS treatment. Supernatant protein concentration of a 1-mg/ml suspension of HLM (1 ml) was reduced by 90% after the MGBS treatment (53 × 109 beads). Adsorbed protein was resistant to dissociation from the beads for at least five washes (maximum number of washes evaluated) using PBS (50 mM, pH 7.4) as indicated by the absence of quantifiable protein in the buffer fraction after each wash step (Fig. 4).
Fig. 4.
Protein content in the media before and after incubation with 53 × 109 beads per milliliter. The nominal concentration of HLM added to beads was 1 mg/ml. Protein content in the wash solutions was below the lower limit of quantitation (LLOQ, lower dotted line).
Assessment of Phospholipid or Protein Binding to MGBS
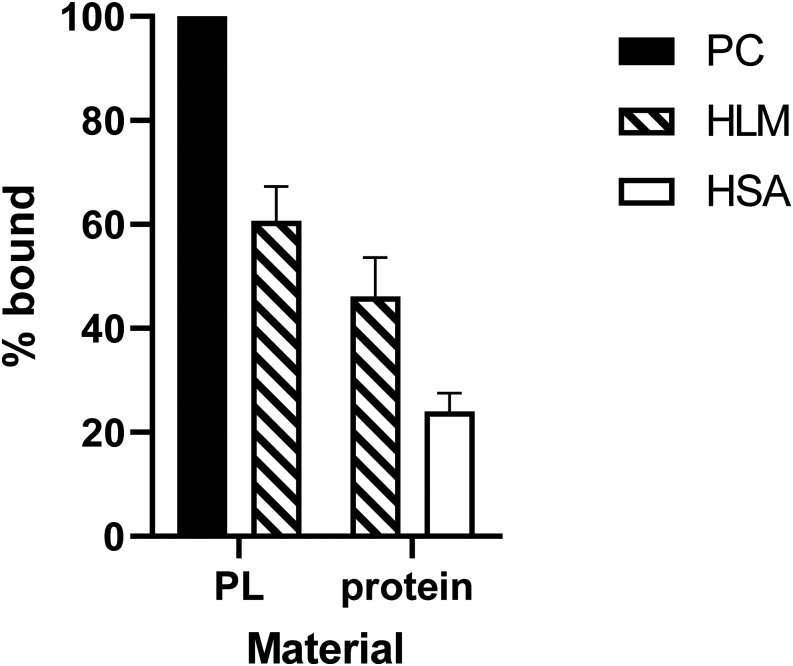
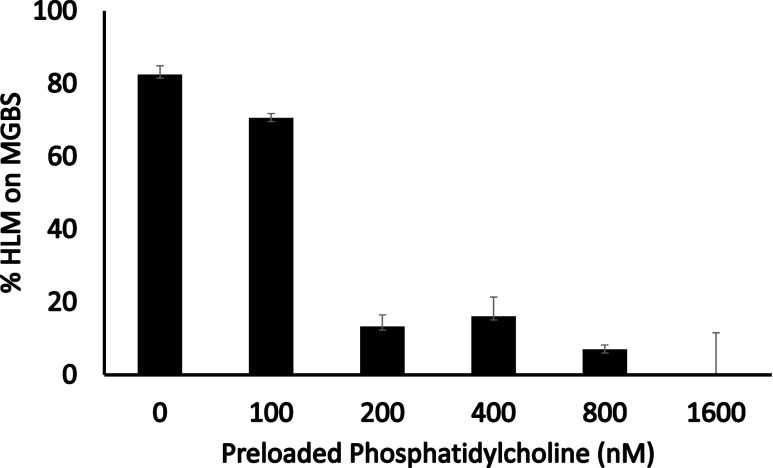
A comparison of the binding of PC, HSA, and HLM to MGBS was conducted to better understand how HLM bind to MGBS. PC at concentrations equivalent to 0.5 mg/ml HLM (41 nmol/ml) was completely bound to MGBS, whereas only 24% of HSA (0.5 mg/ml) was bound to MGBS. This is in contrast to approximately 50–60% of HLM bound to MGBS as measured by either HLM phospholipid or protein content (Fig. 5). Preloading PC onto MGBS strongly inhibited binding of HLM to MGBS (Fig. 6).
Fig. 5.
Binding of PC liposomes, HLM (0.5 mg/ml), and HSA (0.5 mg/ml) to silica magnetizable beads. A total of 11 × 109 beads per milliliter were used across treatments. The content of PC used was set to equal the amount of phospholipids (PL) measured in 0.5 mg/ml HLM. Values represent the means (±S.D.) from N = 3 separate experiments. The amount of PL measureable in the buffer was below the limit of quantitation in PC samples treated with beads. As such, the percentage of phospholipids bound to beads was set to a value of 100.
Fig. 6.
Effect of preloading MGBS with PC on binding of HLM to MGBS. A total of 5.3 × 10⁹ beads per milliliter were used across treatments. Each bar represents the mean ± S.D. from triplicate measurements.
Enzyme Kinetics of HLM-MGBS Versus HLM Suspension
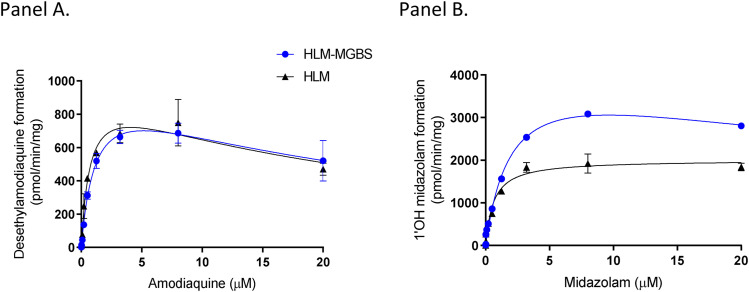
HLM-MGBS were assessed for their ability to catalyze some typical metabolic reactions. Two major CYP450 reactions, CYP2C8-mediated amodiaquine de-ethylation and CYP3A-mediated midazolam 1′hydroxylation, as well as three major UGT reactions, UGT1A1—estrodial 3-β-glucuronidation, UGT1A9—propofol glucuronidation, and UGT2B7—zidovudine glucuronidation, were assessed. CYP450 activity using HLM-MGBS showed similar enzyme kinetic profiles in comparison with HLM suspension incubations (Fig. 7). Measured Km values were approximately two times higher for CYP2C8 amodiaquine de-ethylation and 3-fold higher for midazolam 1′hydroxylation than observed using HLM suspensions; however, Vmax values were approximately the same for CYP2C8 and approximately 2-fold higher for CYP3A4. Overall, the difference in CLint between HLM-MGBS and HLM suspensions was within 2-fold for CYP2C8 and CYP3A (Table 1).
Fig. 7.
Amodiaquine de-ethylation and midazolam 1′-hydroxylation in HLM vs. HLM-MGBS. The HLM concentration used was 0.25 mg/ml. (A) Hyperbolic curve for CYP2C8-mediated amodiaquine de-ethylation. (B) Hyperbolic curves for CYP3A4-mediated midazolam hydroxylation. Values represent the means ± S.D. from N = 3 replicates for each substrate concentration evaluated.
TABLE 1.
Kinetic parameters (mean ± S.D.) describing metabolism of amodiaquine and midazolam in HLM suspensions and HLM-MGBS
| Parameter | Amodiaquine (CYP2C8) | Midazolam (CYP3A) | ||
|---|---|---|---|---|
| HLMSI | HLM-MGBSSI | HLMMM | HLM-MGBSSI | |
| Km (µM) | 0.732 ± 0.11 | 1.21 ± 0.08ns | 0.612 ± 0.086 | 2.04 ± 0.23sig |
| Vmax (pmol/min per milligram) | 982 ± 89 | 1030 ± 87ns | 2002 ± 66 | 4350 ± 249sig |
| CLint (µl/min per milligram) | 1341 | 851 | 2828 | 2132 |
MM, Michaelis-Menten modeling used; ns, not significantly different from parameter generated using HLM; SI, substrate inhibition modeling used; sig, significantly different from parameter generated using HLM (P < 0.05).
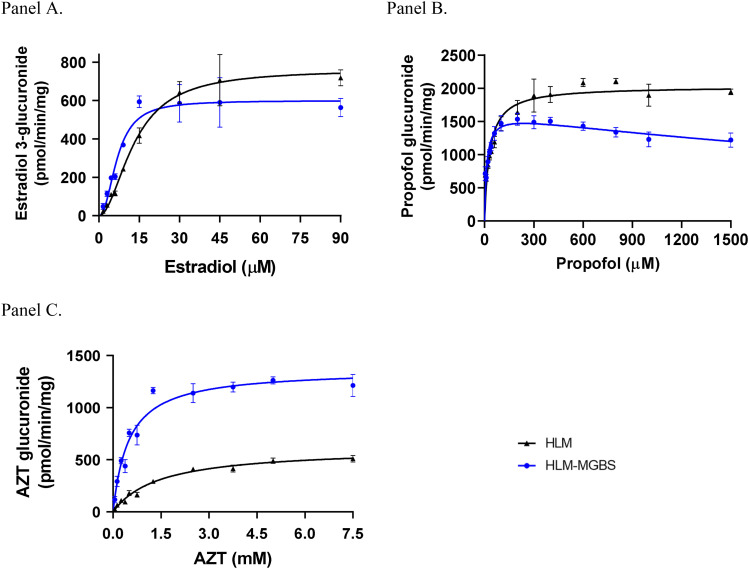
The difference between kinetic profiles of UGTs in HLM-MGBS versus HLM suspensions was more varied than was observed for cytochrome P450s (Fig. 8). For UGT1A1, the S50 value of the estradiol 3-glucuronide formation was 2-fold lower in HLM-MGBS in comparison with HLM suspensions, whereas the Vmax is comparable in both systems; thus, the overall Vmax/Km or CLint is 1.5-fold higher in HLM-MGBS than in HLM suspensions. For UGT1A9, substrate inhibition effects were more noticeable using HLM-MGBS. In addition, the Km value was approximately 3-fold lower using HLM beads in comparison with HLM suspensions, whereas Vmax remained approximately the same. Overall, CLint was approximately 2-fold higher using HLM-MGBS in comparison with HLM suspensions. For UGT2B7, a markedly lower Km was observed that was approximately 3-fold lower for HLM-MGBS versus HLM suspensions. In addition, the Vmax values were approximately 2-fold higher using HLM-MGBS versus HLM suspensions. Overall, CLint was approximately 6-fold higher using HLM beads versus HLM suspensions (Table 2).
Fig. 8.
Estradiol, propofol, and AZT glucuronidation in HLM vs. HLM-MGBS. (A) Sigmoidal curve of UGT1A1-catalyzed estradiol 3-glucuronidation. (B) Hyperbolic curve of UGT1A9-mediated propofol glucuronidation. (C) Hyperbolic curves of UGT2B7-mediated AZT glucuronidation. Data points represent the means ± S.D. from three replications for each substrate concentration evaluated.
TABLE 2.
Kinetic parameters (mean ± S.D.) of UGT1A1, UGT1A9, and UGT2B7 in HLM suspensions and HLM-MGBS
| Parameter | Estradiol (UGT1A1) | Parameter | Propofol (UGT1A9) | AZT (UGT2B7) | |||
|---|---|---|---|---|---|---|---|
| HLMAS | HLM-MGBSAS | HLMSI | HLM-MGBSSI | HLMMM | HLM-MGBSMM | ||
| S50 (µM) | 13 ± 1 | 6.8 ± 0.6sig | Km (µM) | 30 ± 4 | 13 ± 2sig | 1400 ± 0.1 | 490 ± 0.06sig |
| Vmax (pmol/min per milligram) | 761 ± 34 | 600 ± 25sig | Vmax (pmol/min per milligram) | 2029 ± 49 | 1635 ± 66sig | 614 ± 21 | 1366 ± 42sig |
| CLint (µl/min per milligram) | 59 | 88 | CLint (µl/min per milligram) | 68 | 126 | 0.44 | 2.8 |
AS, allosteric sigmoidal modeling used; MM, Michaelis-Menten modeling used; ns, not significantly different from parameter generated using HLM; SI, substrate inhibition modeling used; sig, significantly different from parameter generated using HLM (P < 0.05).
Relaying HLM-MGBS
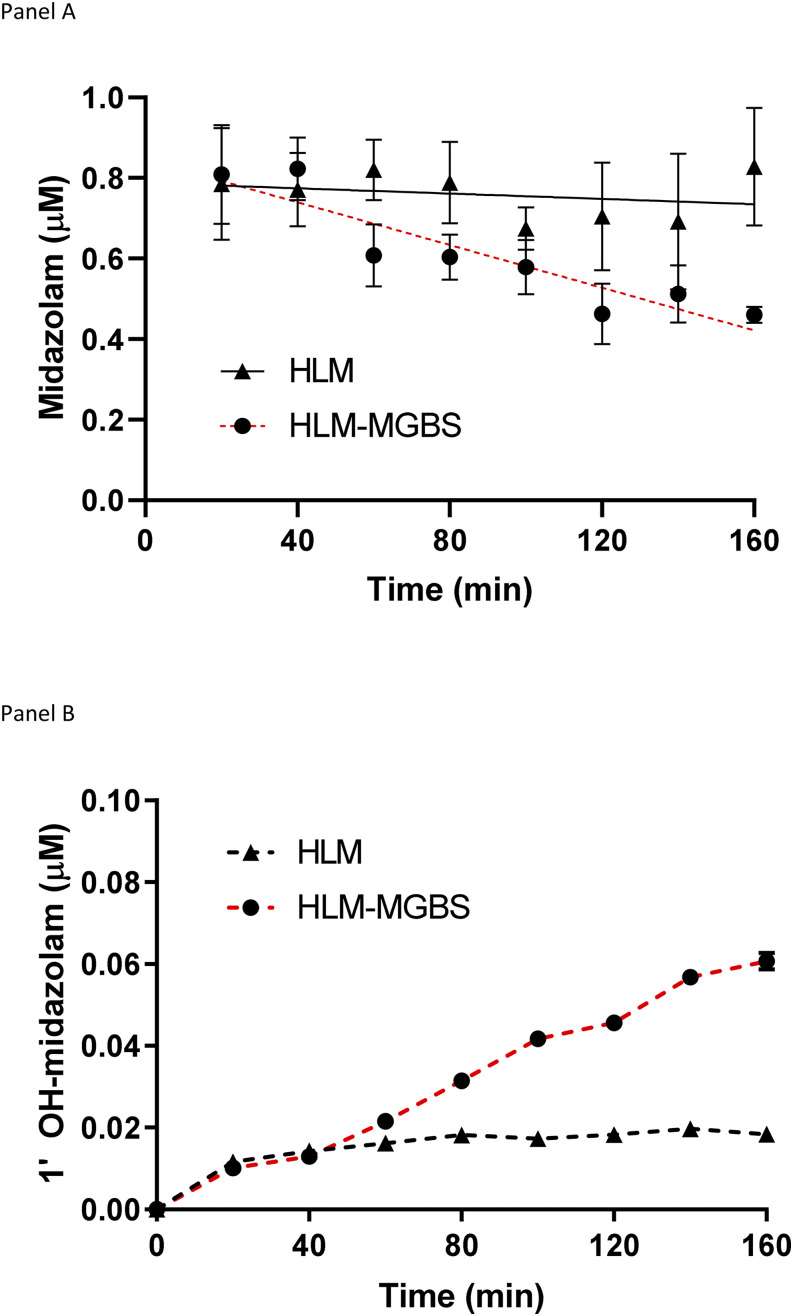
Metabolism of midazolam while relaying the incubation mixture with new HLM-MGBS every 20 minutes is shown in Fig. 9. A low concentrations of HLM (0.005 mg/ml) was used in this study to greatly decrease the rate of midazolam metabolism. By exchanging used HLM-MGBS with fresh HLM-MGBS during the same incubation, continued metabolism of midazolam could be observed as either perceptible turnover of parent midazolam from the incubation or formation of its primary metabolite 1′OH midazolam. Using HLM suspensions, rapid formation of 1′OH midazolam formation could be observed for up to 20 minutes, followed by a markedly slower amount of 1′OH midazolam formation up to the last time point (160 minutes). No perceptible depletion of parent midazolam was observed using HLM suspensions.
Fig. 9.
HLM-MGBS relay strategy to deplete midazolam (A) and form 1′OH midazolam (B). When HLM-MGBS were used, each time point represents one exchange of used HLM-MGBS with new HLM beads in a new incubation container. With HLM suspensions, each time point represents one exchange of the entire incubation into a new incubation container. The HLM protein content in both reactions was adjusted to 0.005 mg/ml.
Discussion
Magnetizable beads have been widely used for protein, nucleic acid, or cell purification in commercial applications (Lea et al., 1988; Haukanes and Kvam, 1993). However, nonspecific binding to the bead surface is typically considered undesirable, as highlighted by the need to include blocking agents in immunocapture assays or optimization of bead characteristics to increase binding specificity (Chalmers et al., 2010; Foddai et al., 2010). Nanoparticles have been shown to bind to biologic materials through multiple factors, such as particle surface charge, chemistry, and roughness, and can include protein or lipid interactions (Mu et al., 2014). A recent proteomic analysis of HLM has shown that the total protein mass of HLM is made up of 600 different proteins, with the top 10 most abundant HLM proteins accounting for ∼20% of total HLM protein (Achour et al., 2017). As HLM have been shown to comprise proteins with differing tertiary and quaternary structures, it is possible that one or more unique proteins could markedly contribute to HLM binding to MGBS. Alternatively, binding of HLM to MGBS surface could be mediated by interactions between the MGBS surface and HLM phospholipids, of which PC is the most abundant component (Liu et al., 2017).
In this study, PC was shown to bind more effectively to MGBS in comparison with HSA (Fig. 5). Although HSA may not be a representative protein in HLM, one study suggests that structural differences between proteins should not affect binding of the proteins to silica nanoparticles, indicating that the interaction between silica and proteins (including those in HLM) is likely nonspecific (Hata et al., 2014). These studies, together with data illustrated in Fig. 5, strongly suggest that the phospholipid component is predominantly mediating binding of HLM to MGBS.
As shown in Fig. 2, the percentage of HLM bound to MGBS is dependent on both bead content and HLM concentration and that the binding of HLM to MGBS could be described by a one-site binding equation. The strength of the binding of HLM to MGBS was surprising (Fig. 4) considering that HLM do not adsorb particularly well to the surface of laboratory glass containers. However, interactions between silica beads and phospholipids have been well documented (Hata et al., 2014; Hoffmann et al., 2014; Kettiger et al., 2016) and implicated in the membrane-disrupting properties of drug-delivering silica nanoparticles, which manifest clinically as hemolytic toxicity (Pavan et al., 2013; Hata et al., 2014; Hoffmann et al., 2014; Kettiger et al., 2016). Unlike proteins, phospholipids are negatively charged at neutral pH, and as such, electrostatic interactions are less likely to contribute to their binding. Instead, binding of phospholipids to silica surfaces may be associated with weaker van der Waals forces (Kettiger et al., 2016). Despite the anticipated electrorepulsive interactions of the negatively charged phosphate head of the phospholipid and silanol groups of the beads, marked adsorption of silica nanoparticles to phospholipid membranes has been shown to occur at neutral pH, although higher binding is observed in solutions with lower pH in which protonation can render the phospholipid less polar (Pera et al., 2014). It is also possible that binding of HLM to silica beads is at least partially mediated by synergistic interactions between membrane-associated proteins and phospholipids (Melby et al., 2018).
Additional studies using polymeric magnetizable beads with different surface chemistry were also found to exhibit strong binding to HLM; however, it is notable that beads coated with a layer of dextran showed comparably weak binding to HLM (data not shown). Polymeric beads can also bind to liposomes, bicelles, and cardiolipin (Stewart et al., 1995; Saleem et al., 2015).
As shown in Fig. 7, HLM-MGBS demonstrated CYP450 drug metabolizing activity that was comparable to the activity observed using HLM suspensions. The CLint of CYP450 substrates in incubations with HLM-MGBS was 0.63- to 0.75-fold lower for CYP2C8 and CYP3A4, respectively, in comparison with values from suspension HLM. The lower CLint observed in HLM-MGBS was associated with a general increase in the Km of the reaction for both CYP2C8 and CYP3A4, accompanied by a similar Vmax for CYP2C8 and a greater than 2-fold increase in Vmax for CYP3A4. For CYP2C8, remarkable similarity in enzyme kinetic profile of HLM-MGBS versus HLM suspensions suggests that MGBS did not have any noticeable effect on CYP2C8 activity, as indicated by a lack of significance in the differences in kinetic parameters between the two systems (Fig. 7A). For CYP3A4, a statistically significant increase in the Vmax value was also associated with a potential decrease in activity at the highest concentration that is suggestive of substrate level inhibition. An accompanying statistically significant increase in the Km of the reaction resulted in a slight decrease in the CLint of midazolam (Fig. 7B). Factors that could potentially affect enzyme activity of HLM when bound to MGBS are nonspecific binding of substrate to beads, altered positioning of the HLM around bead aggregates that may obscure some percentage of HLM exposure to substrate, or indirect effects on enzyme activity due to the alteration of membrane properties. Nonspecific binding of midazolam and 1′OH midazolam to MGBS was not observed from bioanalysis of the supernatant component after a 30-minute incubation of beads (5.3 × 10⁹ beads), strongly suggesting that nonspecific binding does not change enzyme kinetics of CYP3A. Atomic models of CYP1A2, CYP2A6, CYP2C9, CYP2D6, CYP2E1, and CYP3A4 suggest that the catalytic site of these isoforms is at least partially immersed in the phospholipid bilayer of the endoplasmic reticulum; thus, it is conceivable that alterations of the bilayer could also affect positioning of the cytochrome P450 active site such that activity could be altered (Berka et al., 2013). It is known that CYP450 activity can be affected by membrane composition and that membrane components of the endoplasmic reticulum can form ordered (rigid) or disordered (fluid) microdomains that certain cytochrome P450s may prefer to localize to (Brignac-Huber et al., 2013). It is conceivable that binding of phospholipids, saturated lipids, or unsaturated lipids to the surface of the beads could result in a change in the composition of the microsomal membrane in such a way as to enhance the activity of certain enzymes. Ingelman-Sundberg et al. (1996) hypothesized that the presence of a higher proportion of negatively charged components of the phospholipid membrane increased CYP3A4 Vmax, but not Km. The increase in Vmax is similar to that which was observed for midazolam metabolism with HLM-MGBS versus HLM; however, a significant increase in the Km of CYP3A activity with HLM-MGBS suggests that other factors could be affecting CYP3A enzyme kinetics. Das and Sligar (2009) observed corroborating evidence demonstrating that the composition of negative phospholipids in CYP450-containing nanodiscs could alter the redox potential of CYP450 flavins, resulting in enhanced enzyme activity.
Interestingly, as shown in Fig. 8, the CLint of estradiol (UGT1A1), propofol (UGT1A9), and AZT (UGT2B7) via glucuronidation was higher in HLM-MGBS versus HLM suspensions, which was largely driven by a marked decrease in the observed Km for each reaction. In the case of AZT glucuronidation, CLint that was approximately 6-fold higher was associated with a 2-fold increase in Vmax value and a 3-fold decrease in the Km value. These data are surprising in their contrast to the more moderate effects of the beads on CYP450 activity. A possible explanation for these differences in enzyme activity would be the impact of the multiple washing steps on the content of free fatty acids associated with HLM-MGBS. Free fatty acids such as arachidonic, oleic, and linoleic acids can exists as contaminants remaining from HLM preparations. These fatty acids have been shown to be competitive inhibitors of UGT1A9 and UGT2B7 activity (Rowland et al., 2007, 2008). To mitigate the inhibitory effects of these fatty acids, fatty acid–binding serum albumin is typically added to HLM suspensions at concentrations that balance the positive effects of fatty acid binding with the undesirable effects of substrate binding (Rowland et al., 2007). Inclusion of small concentrations of fatty acid–free albumin to in vitro incubations has been shown to increase the activity of certain enzymes found in HLM, including UGT1A9 and UGT2B7 (Manevski et al., 2011, 2013). More specifically, addition of fatty acid–free albumin led to an overall decrease in the binding affinity of 4-methylumbelliferone for UGT1A9. Other UGTs, including UGT2B7, were also similarly affected by fatty acid–free albumin (Rowland et al., 2007). However, this effect of albumin was not observed with UGT1A1 (Rowland et al., 2008). This is a notable observation, as decreasing Km values for UGT1A9 and UGT2B7, but not UGT1A1, were also observed with HLM-MGBS versus HLM suspensions. This suggests that for UGT activities, the binding of HLM to MGBS appears to have a similar effect as adding fatty acid–free albumin to the incubation. Interestingly, for UGT1A9 and UGT2B7, Vmax values were significantly different in HLM-MGBS versus HLM. For UGT1A9, Vmax was slightly lower with HLM-MGBS versus HLM. For UGT2B7, Vmax was markedly higher with HLM-MGBS versus HLM. The changes in Vmax values using HLM-MGBS were not observed in HLM incubations using albumin (Rowland et al., 2007), suggesting that MGBS may be contributing additional effects on UGT activity, such as the alteration of membrane composition described above for the CYP isoforms evaluated. If HLM-bead washing results in the removal of inhibitory free fatty acids, incubations in the absence of inhibitory free fatty acids could be conducted in the absence of serum albumin. Alternatively, it may also be possible to introduce serum albumin into the wash steps to augment removal of free fatty acids from the HLM.
This study also demonstrates that enzymatically functional membrane-bound proteins could be immobilized onto MGBS and that magnetism can be leveraged to extend the length of an incubation using a relay approach. Based on data illustrated in Fig. 9, the calculated CLint clearance from midazolam depletion data were determined to be 842 µl/min per milligram HLM protein. Using the well stirred model, a blood flow value of 21 ml/min per kilogram, a liver weight value of 1800 g, a body weight value of 70 kg, and a midazolam plasma free fraction value of 0.02, the hepatic blood clearance of midazolam equates to 9.47 ml/min per kilogram, which is in line with the blood clearance of midazolam (8.59 ml/min per kilogram) reported in the literature (Chan et al., 2019). It is important to note, however, that the concentration of midazolam used in this study (1 µM) is considered too close to the Km to accurately predict CLint using the substrate depletion approach (Houston and Carlile, 1997). Indeed, by using Vmax/Km from the values shown in Table 2, the predicted hepatic clearance of midazolam is higher (14.2 ml/min per kilogram).
Although the results described herein highlight the potential for HLM-MGBS to be used as a functional metabolic system to study in vitro drug metabolism, we consider this an initial evaluation of a newly identified methodology. Further characterization is currently ongoing in our laboratory, and more extensive testing is required to fully understand how the data could be extrapolated to predict clinical outcome. Additionally, how the HLM-MGBS method compares with data generated using established methods such as HLM or hepatocytes, especially with respect to in vitro/in vivo correlation, requires more extensive characterization. Notably, MGBS methodology can be applied to other microsomal sources, e.g., from animal, recombinant, or alternative organs preparations, as preliminary data indicate that these preparations can bind equally well to MGBS. In our laboratory, we are currently assessing the potential for HLM-MGBS to be used as a tool to study metabolism of low-clearance compounds using a relay-based approach and reference low-clearance cytochrome P450 substrates such as alprazolam, diazepam, and theophylline. Similarly, studies are also underway to elucidate the effects of nonspecific binding of drugs to either MGBS or HLM-MGBS as a possible means to more easily assess microsomal binding.
Future planned evaluations will also include optimizing bead surface chemistry or size of bead to maximize binding, or optimum ferromagnetic materials to optimize magnetic separation speed. In addition, the physicochemical principles underlying the binding of biologic material to bead surface material are applicable to any phospholipid-based system, such as fractions from other cellular organelles or even complete cells. As such, functional assays with immobilized biologic material on beads may not be restricted to biotransformation reactions but could also eventually include drug transport or receptor binding studies.
Abbreviations
- AZT
zidovudine
- CLint
intrinsic clearance
- DDI
drug-drug interaction
- HLM
human liver microsome
- MGBS
magnetizable beads coated with silica
- HLM-MGBS
HLM bound to beads
- PC
phosphatidylcholine
- UDPGA
uridine diphosphoglucuronic acid
- UGT
uridine-diphosphate-glucuronosyltransferase
Authorship Contributions
Participated in research design: Horspool, Wang, Scaringella, Chan.
Conducted experiments: Horspool, Wang, Scaringella, Chan.
Performed data analysis: Horspool, Wang, Scaringella, Chan.
Wrote or contributed to the writing of manuscript: Wang, Taub, Chan.
Footnotes
A.M.H. was a summer intern at Boehringer Ingelheim Pharmaceuticals. T.S.C., T.W., Y.-S.S., and M.E.T. are full-time employees of Boehringer Ingelheim Pharmaceuticals.
References
- Achour B, Al Feteisi H, Lanucara F, Rostami-Hodjegan A, Barber J. (2017) Global proteomic analysis of human liver microsomes: rapid characterization and quantification of hepatic drug-metabolizing enzymes. Drug Metab Dispos 45:666–675. [DOI] [PubMed] [Google Scholar]
- Argikar UA, Potter PM, Hutzler JM, Marathe PH. (2016) Challenges and opportunities with non-CYP enzymes aldehyde oxidase, carboxylesterase, and UDP-glucuronosyltransferase: focus on reaction phenotyping and prediction of human clearance. AAPS J 18:1391–1405. [DOI] [PMC free article] [PubMed] [Google Scholar]
- Berka K, Paloncýová M, Anzenbacher P, Otyepka M. (2013) Behavior of human cytochromes P450 on lipid membranes. J Phys Chem B 117:11556–11564. [DOI] [PubMed] [Google Scholar]
- Bradford MM. (1976) A rapid and sensitive method for the quantitation of microgram quantities of protein utilizing the principle of protein-dye binding. Anal Biochem 72:248–254. [DOI] [PubMed] [Google Scholar]
- Brignac-Huber LM, Reed JR, Eyer MK, Backes WL. (2013) Relationship between CYP1A2 localization and lipid microdomain formation as a function of lipid composition. Drug Metab Dispos 41:1896–1905. [DOI] [PMC free article] [PubMed] [Google Scholar]
- Bruce IJ, Sen T. (2005) Surface modification of magnetic nanoparticles with alkoxysilanes and their application in magnetic bioseparations. Langmuir 21:7029–7035. [DOI] [PubMed] [Google Scholar]
- Chalmers JJ, Xiong Y, Jin X, Shao M, Tong X, Farag S, Zborowski M. (2010) Quantification of non-specific binding of magnetic micro- and nanoparticles using cell tracking velocimetry: implication for magnetic cell separation and detection. Biotechnol Bioeng 105:1078–1093. [DOI] [PMC free article] [PubMed] [Google Scholar]
- Chan TS, Yu H, Moore A, Khetani SR, Tweedie D. (2019) Meeting the challenge of predicting hepatic clearance of compounds slowly metabolized by cytochrome P450 using a novel hepatocyte model, HepatoPac. Drug Metab Dispos 47:58–66. [DOI] [PubMed] [Google Scholar]
- Claude A. (1946) Fractionation of mammalian liver cells by differential centrifugation: ii. Experimental procedures and results. J Exp Med 84:61–89. [PubMed] [Google Scholar]
- Das A, Sligar SG. (2009) Modulation of the cytochrome P450 reductase redox potential by the phospholipid bilayer. Biochemistry 48:12104–12112. [DOI] [PMC free article] [PubMed] [Google Scholar]
- Fisher MB, Campanale K, Ackermann BL, VandenBranden M, Wrighton SA. (2000) In vitro glucuronidation using human liver microsomes and the pore-forming peptide alamethicin. Drug Metab Dispos 28:560–566. [PubMed] [Google Scholar]
- Foddai A, Elliott CT, Grant IR. (2010) Maximizing capture efficiency and specificity of magnetic separation for Mycobacterium avium subsp. paratuberculosis cells. Appl Environ Microbiol 76:7550–7558. [DOI] [PMC free article] [PubMed] [Google Scholar]
- Gunaratna C. (2000) Drug metabolism and pharmacokinetics in drug discovery: a primer for bioanalytical chemists, Part I. Curr Sep 19:17–23. [Google Scholar]
- Hata K, Higashisaka K, Nagano K, Mukai Y, Kamada H, Tsunoda S, Yoshioka Y, Tsutsumi Y. (2014) Evaluation of silica nanoparticle binding to major human blood proteins. Nanoscale Res Lett 9:2493. [DOI] [PMC free article] [PubMed] [Google Scholar]
- Haukanes BI, Kvam C. (1993) Application of magnetic beads in bioassays. Biotechnology (N Y) 11:60–63. [DOI] [PubMed] [Google Scholar]
- Hoffmann I, Michel R, Sharp M, Holderer O, Appavou MS, Polzer F, Farago B, Gradzielski M. (2014) Softening of phospholipid membranes by the adhesion of silica nanoparticles--as seen by neutron spin-echo (NSE). Nanoscale 6:6945–6952. [DOI] [PubMed] [Google Scholar]
- Houston JB, Carlile DJ. (1997) Prediction of hepatic clearance from microsomes, hepatocytes, and liver slices. Drug Metab Rev 29:891–922. [DOI] [PubMed] [Google Scholar]
- Ingelman-Sundberg M, Hagbjörk AL, Ueng YF, Yamazaki H, Guengerich FP. (1996) High rates of substrate hydroxylation by human cytochrome P450 3A4 in reconstituted membranous vesicles: influence of membrane charge. Biochem Biophys Res Commun 221:318–322. [DOI] [PubMed] [Google Scholar]
- Kettiger H, Québatte G, Perrone B, Huwyler J. (2016) Interactions between silica nanoparticles and phospholipid membranes. Biochim Biophys Acta 1858:2163–2170. [DOI] [PubMed] [Google Scholar]
- Klein G, Mathé C, Biola-Clier M, Devineau S, Drouineau E, Hatem E, Marichal L, Alonso B, Gaillard JC, Lagniel G, et al. (2016) RNA-binding proteins are a major target of silica nanoparticles in cell extracts. Nanotoxicology 10:1555–1564. [DOI] [PubMed] [Google Scholar]
- Lea T, Vartdal F, Nustad K, Funderud S, Berge A, Ellingsen T, Schmid R, Stenstad P, Ugelstad J. (1988) Monosized, magnetic polymer particles: their use in separation of cells and subcellular components, and in the study of lymphocyte function in vitro. J Mol Recognit 1:9–18. [DOI] [PubMed] [Google Scholar]
- Liu KC, Hughes JMX, Hay S, Scrutton NS. (2017) Liver microsomal lipid enhances the activity and redox coupling of colocalized cytochrome P450 reductase-cytochrome P450 3A4 in nanodiscs. FEBS J 284:2302–2319. [DOI] [PMC free article] [PubMed] [Google Scholar]
- Manevski N, Moreolo PS, Yli-Kauhaluoma J, Finel M. (2011) Bovine serum albumin decreases Km values of human UDP-glucuronosyltransferases 1A9 and 2B7 and increases Vmax values of UGT1A9. Drug Metab Dispos 39:2117–2129. [DOI] [PubMed] [Google Scholar]
- Manevski N, Troberg J, Svaluto-Moreolo P, Dziedzic K, Yli-Kauhaluoma J, Finel M. (2013) Albumin stimulates the activity of the human UDP-glucuronosyltransferases 1A7, 1A8, 1A10, 2A1 and 2B15, but the effects are enzyme and substrate dependent. PLoS One 8:e54767. [DOI] [PMC free article] [PubMed] [Google Scholar]
- Meissner J, Prause A, Bharti B, Findenegg GH. (2015) Characterization of protein adsorption onto silica nanoparticles: influence of pH and ionic strength. Colloid Polym Sci 293:3381–3391. [DOI] [PMC free article] [PubMed] [Google Scholar]
- Melby ES, Allen C, Foreman-Ortiz IU, Caudill ER, Kuech TR, Vartanian AM, Zhang X, Murphy CJ, Hernandez R, Pedersen JA. (2018) Peripheral membrane proteins facilitate nanoparticle binding at lipid bilayer interfaces. Langmuir 34:10793–10805. [DOI] [PubMed] [Google Scholar]
- Mu Q, Jiang G, Chen L, Zhou H, Fourches D, Tropsha A, Yan B. (2014) Chemical basis of interactions between engineered nanoparticles and biological systems. Chem Rev 114:7740–7781. [DOI] [PMC free article] [PubMed] [Google Scholar]
- Pavan C, Tomatis M, Ghiazza M, Rabolli V, Bolis V, Lison D, Fubini B. (2013) In search of the chemical basis of the hemolytic potential of silicas. Chem Res Toxicol 26:1188–1198. [DOI] [PubMed] [Google Scholar]
- Pera H, Nolte TM, Leermakers FA, Kleijn JM. (2014) Coverage and disruption of phospholipid membranes by oxide nanoparticles. Langmuir 30:14581–14590. [DOI] [PubMed] [Google Scholar]
- Rowland A, Gaganis P, Elliot DJ, Mackenzie PI, Knights KM, Miners JO. (2007) Binding of inhibitory fatty acids is responsible for the enhancement of UDP-glucuronosyltransferase 2B7 activity by albumin: implications for in vitro-in vivo extrapolation. J Pharmacol Exp Ther 321:137–147. [DOI] [PubMed] [Google Scholar]
- Rowland A, Knights KM, Mackenzie PI, Miners JO. (2008) The “albumin effect” and drug glucuronidation: bovine serum albumin and fatty acid-free human serum albumin enhance the glucuronidation of UDP-glucuronosyltransferase (UGT) 1A9 substrates but not UGT1A1 and UGT1A6 activities. Drug Metab Dispos 36:1056–1062. [DOI] [PubMed] [Google Scholar]
- Saleem Q, Zhang Z, Petretic A, Gradinaru CC, Macdonald PM. (2015) Single lipid bilayer deposition on polymer surfaces using bicelles. Biomacromolecules 16:1032–1039. [DOI] [PubMed] [Google Scholar]
- Schneemilch M, Quirke N. (2018) Free energy of adhesion of lipid bilayers on silica surfaces. J Chem Phys 148:194704. [DOI] [PubMed] [Google Scholar]
- Shi B, Shin YK, Hassanali AA, Singer SJ. (2015a) DNA binding to the silica surface. J Phys Chem B 119:11030–11040. [DOI] [PubMed] [Google Scholar]
- Shi L, Wu F, Wen Y, Zhao F, Xiang J, Ma L. (2015b) A novel method to detect Listeria monocytogenes via superparamagnetic lateral flow immunoassay. Anal Bioanal Chem 407:529–535. [DOI] [PubMed] [Google Scholar]
- Soars MG, Ring BJ, Wrighton SA. (2003) The effect of incubation conditions on the enzyme kinetics of udp-glucuronosyltransferases. Drug Metab Dispos 31:762–767. [DOI] [PubMed] [Google Scholar]
- Stewart MW, Gordon PA, Etches WS, Marusyk H, Poppema S, Bigam C, Sykes B. (1995) Binding of cardiolipin to polystyrene beads: evidence for a lamellar phase orientation. Br J Haematol 90:900–905. [DOI] [PubMed] [Google Scholar]
- Ward KW. (2005) Recent advances in pharmacokinetic extrapolation from preclinical data to humans. Expert Opin Drug Metab Toxicol 1:583–594. [DOI] [PubMed] [Google Scholar]


