

Abstract
Objective
To evaluate FDG-PET as an antemortem diagnostic tool for Alzheimer-related TAR DNA-binding protein of 43 kDa (TDP-43) proteinopathy.
Methods
We conducted a cross-sectional neuroimaging–histologic analysis of patients with antemortem FDG-PET and postmortem brain tissue from the Mayo Clinic Alzheimer's Disease Research Center and Study of Aging with Alzheimer spectrum pathology. TDP-43-positive status was assigned when TDP-43-immunoreactive inclusions were identified in the amygdala. Statistical parametric mapping (SPM) analyses compared TDP-43-positive (TDP-43[+]) with TDP-43-negative cases (TDP-43[−]), correcting for field strength, sex, Braak neurofibrillary tangle, and neuritic plaque stages. Cross-validated logistic regression analyses were used to determine whether regional FDG-PET values predict TDP-43 status. We also assessed the ratio of inferior temporal to medial temporal (IMT) metabolism as this was proposed as a biomarker of hippocampal sclerosis.
Results
Of 73 cases, 27 (37%) were TDP-43(+), of which 6 (8%) had hippocampal sclerosis. SPM analysis showed TDP-43(+) cases having greater hypometabolism of medial temporal, frontal superior medial, and frontal supraorbital (FSO) regions (punc < 0.001). Logistic regression analysis showed only FSO and IMT to be associated with TDP-43(+) status, identifying up to 81% of TDP-43(+) cases (p < 0.001). An IMT/FSO ratio was superior to the IMT in discriminating TDP-43(+) cases: 78% vs 48%, respectively.
Conclusions
Alzheimer-related TDP-43 proteinopathy is associated with hypometabolism in the medial temporal and frontal regions. Combining FDG-PET measures from these regions may be useful for antemortem prediction of Alzheimer-related TDP-43 proteinopathy.
Classification of evidence
This study provides Class II evidence that hypometabolism in the medial temporal and frontal regions on FDG-PET is associated with Alzheimer-related TDP-43 proteinopathy.
The prevalence of trans-active response DNA-binding protein of 43 kDa (TDP-43) deposition in the brains of patients with Alzheimer disease (AD) spectrum pathology can reach 74%.1–4 Moreover, strong clinical and neuropathologic evidence implicates TDP-43 in the features of the dementia syndrome that has been attributed to AD5,6 such as more advanced memory impairment and overall cognitive decline.5,7,8 Greater rate and degree of hippocampal atrophy5,6,9 as well as higher prevalence of hippocampal sclerosis (HS) in TDP-43-positive (TDP-43[+]) cases10–13 further indicate that this protein is associated with neurodegeneration.
Taking into account the association with clinical and pathologic characteristics in AD, TDP-43 becomes a potential candidate for targeted therapy and should be accounted for during clinical trial enrollment and outcome evaluation. However, at present the only way to confirm TDP-43 deposition is at autopsy. It has been suggested that [18F]-fluorodeoxyglucose PET (FDG-PET) could be useful to predict the presence of HS during life, with a ratio of inferior temporal to medial temporal (IMT) hypometabolism providing good separation of patients with and without HS in a cohort of amnestic dementia cases.14 Given the association between TDP-43 and HS,5,13,15–17 FDG-PET may also be useful to help predict the presence of TDP-43.
The primary aims of this study were to determine whether the pattern of hypometabolism detected by FDG-PET imaging differs in TDP-43(+) compared to TDP-43-negative (TDP-43[−]) cases in patients with AD spectrum pathology and to determine the utility of FDG-PET as a diagnostic biomarker of TDP-43.
Methods
Classification of evidence
This retrospective cross-sectional neuroimaging–histologic study provides Class II evidence that hypometabolism in the medial temporal and frontal regions on FDG-PET is associated with Alzheimer-related TDP-43 proteinopathy. TDP-43(+) cases had greater hypometabolism of medial temporal (MT), frontal superior medial (FSM), and frontal supraorbital (FSO) regions (punc < 0.001). FDG-PET-derived data allowed separation of TDP-43(+) cases with sensitivity of 81% and specificity of 74% (p < 0.001) (figure 1).
Figure 1. Flowchart for identification of study participants and evaluation of diagnostic utility of [18F]-fluorodeoxyglucose PET (FDG-PET) data.

Flowchart shows the search strategy used to identify study participants. Trans-active response DNA-binding protein of 43 kDa (TDP-43) status for each participant was determined using gold standard by immunohistochemistry of the brain tissue resulting in 27 TDP-43-positive cases. Ratio of inferior temporal to medial temporal standard uptake value ratio (SUVR) values ratio and to frontal supraorbital SUVR values (MIT/FSO) was used to generate a value for each participant. Area under the receiver operating characteristic curve was used to determine a cut point on a log-odds scale with optimal combination of sensitivity and specificity of the test.
Study design and participants
We conducted a cross-sectional neuroimaging–histologic study using an autopsy cohort of participants who had TDP-43 status determination as reported below. All participants were enrolled in the Mayo Clinic Alzheimer's Disease Research Center, the Mayo Clinic Alzheimer's Disease Patient Registry, or the Mayo Clinic Study of Aging and were prospectively followed to the time of their death. The patients died between May 12, 1999, and December 31, 2015. From this cohort, we identified all participants who met the following inclusion criteria: at least one antemortem research FDG-PET and structural MRI performed and had received an AD spectrum pathologic diagnosis in accordance with the National Institute on Aging–Alzheimer Association (NIA-AA) diagnostic criteria18 (i.e., participants had to have β-amyloid [Aβ] deposition in the form of diffuse or neuritic plaques present in the brain) regardless of their cognitive status or clinical diagnosis. From our autopsy-defined cohort, we identified 73 patients who met our inclusion criteria. Two patients who had an FDG-PET were excluded from the study as neither had Aβ deposition at autopsy (figure 1). The clinical diagnosis and cognitive status of all 73 cases in this study had been assigned based on evaluations by a behavioral neurologist and neuropsychologist on the last visit prior to death. Twelve cases from this cohort (16%), of which 3 were TDP-43(+), were previously reported in the study by Botha et al.14
Standard protocol approvals, registrations, and patient consents
This study has been approved by the Mayo Clinic institutional review board, and all patients or their proxies signed a written informed consent form before taking part in any research activities in accordance with the Declaration of Helsinki.
Pathologic analysis
All 73 cases had undergone pathologic examination according to the recommendations of the NIA-AA.18 Diffuse or neuritic Aβ plaques had to be detected in order for the patient to be included in the study. The hemisphere used for pathologic analysis was recorded, resulting in 57 cases where the left hemisphere was used and 16 cases where the right hemisphere was used. Each individual had been assigned a Braak neurofibrillary tangle (NFT) stage 0–VI19,20 and a National Alzheimer's Coordinating Center (NACC) neuritic plaque stage 0–3 (NACCNEUR),21 which is comparable to the Consortium to Establish a Registry for Alzheimer's Disease staging.22 Presence of Lewy bodies in the brainstem, limbic system or amygdala, or neocortex was documented and staged according to NACC (NACCLEWY).21
Cases were designated as TDP-43(+) if TDP-43 immunoreactive neuronal cytoplasmic inclusions, dystrophic neurites, or neuronal intranuclear inclusions were identified in the amygdala, which has been shown to be the earliest region involved.23–26 All TDP-43(+) cases were evaluated further in order to categorize each case into 1 of the 6 TDP-43 stages based on published criteria: stage 1, TDP-43 deposition is limited to the amygdala; stage 2, TDP-43 deposition extends into entorhinal cortex or subiculum; stage 3, TDP-43 deposition extends into hippocampus dentate granule cell layer or occipitotemporal cortex; stage 4, TDP-43 extends into the insula, ventral striatum, basal forebrain, or inferior temporal cortex; stage 5, TDP-43 extends into substantia nigra, inferior olive, or midbrain tectum; stage 6, TDP-43 deposition extends into middle frontal cortex or basal ganglia.23,24 All the TDP-43(−) cases were assigned TDP-43 stage 0.
HS27 was diagnosed in cases where there was neuronal loss in the CA1 and the subiculum of the hippocampus out of proportion to the degree of AD pathology in those regions.10,28
Neuroimaging analysis
All participants had undergone FDG-PET using a GE PET/CT scanner. All FDG-PET scans used in this study were performed under NIH or foundation funded research protocols. Participants were injected with 18F-FDG of approximately 459 MBq (range 367–576 MBq) and after a 30-minute uptake period an 8-minute 18F-FDG scan was performed. Emission data were reconstructed into a 256 × 256 matrix with a 30-cm field of view (pixel size = 1.0 mm, slice thickness = 1.96 mm). We did not perform a partial volume correction (PVC) on the FDG-PET data since we were interested in the performance of FDG-PET as a biomarker, not as a specific measure of neuronal dysfunction. Non-PVC data were deemed more appropriate for this study given that the FDG signal of interest usually decreases in the affected regions due to reduced metabolism whereas PVC either enhances signal intensity or leaves it unchanged. Therefore, PVC could potentially diminish the power of detection of the group differences and lead to type II error in statistical hypothesis testing. All participants had also undergone structural MRI using a standardized protocol, as described previously.29 The MRIs were performed at median of 7 days (interquartile range, 1–30 days) from the FDG-PET. All MRIs were performed using GE scanners, with 62 performed at 3T and 11 at 1.5T.
The FDG-PET images were each registered to the participant's MRI using SPM12 (fil.ion.ucl.ac.uk/spm/software/spm12/) 6 degrees of freedom registration. Normalization measures were computed between each MRI and the Mayo Clinic Adult Lifespan Template (MCALT) (nitrc.org/projects/mcalt/) using advanced normalization tools.30 With these measures, the MCALT atlases were propagated to native MRI space. All voxels in the magnetization-prepared rapid gradient echo space FDG-PET images were divided by the median uptake in the pons using the MCALT atlas to create standard uptake value ratio (SUVR) images. These SUVR images were normalized to the MCALT and smoothed at 6 mm full-width at half maximum (FWHM). The magnetic resonance images were segmented using SPM12 with MCALT priors, and the gray matter maps were normalized to MCALT (with modulation) and smoothed at 8 mm FWHM.
Voxel-level comparisons of FDG-PET SUVR images for TDP-43(+) and TDP-43(−) cases were performed using SPM12. Results were corrected for field strength, sex, Braak NFT stage, and neuritic plaque stage, and were assessed uncorrected for multiple comparisons at p < 0.001. Identical voxel-level comparisons of MRI volume were also performed to allow us to determine whether the FDG-PET findings mirrored the MRI findings.
The MRI space MCALT atlas was also used to output region of interest (ROI)–level data. Based on the patterns observed in our SPM analysis of FDG-PET, and the previous study that developed a ratio to predict HS status, 4 ROIs were identified: inferior temporal gyrus (IT); MT lobe, which combined amygdala and hippocampus14; FSM; and FSO regions. The IT region was chosen due to relative sparing compared to MT and was used to create the ratio of IT to MT (IMT ratio). Median FDG uptake was calculated from gray matter voxels in each ROI and divided by median uptake in pons to create SUVRs. Gray matter volume was also calculated for each region. We calculated SUVR and volume for each ROI for the hemisphere used for pathologic analysis in each individual. Total intracranial volume was also measured in order to allow a correction for head size in the MRI analyses.
Statistical analysis
All statistical analysis was done in JMP Pro 14 software (jmp.com/en_us/software/predictive-analytics-software.html) or R version 3.4.231 using the RMS package.32 The Wilcoxon rank sum test was used to compare continuous variables and the χ2 test was used for categorical variables such as sex. Fisher exact test was used for TDP-43 stage given the small numbers.
The IMT ratio was calculated for each study participant and tested for its ability to predict the following conditions: TDP-43(+) status, TDP-43 stage ≥2, or HS.14 Logistic regression model included age, sex, years from the disease onset to FDG-PET scan, years from FDG-PET scan to death, Braak NFT stage, NACCNEUR stage, NACCLEWY stage, IMT ratio, FSM and FSO SUVR values, and HS status, where applicable, as covariates was used to predict TDP-43(+). IMT and FSO SUVR values were the only variables to be strongly associated with TDP-43(+) status (p = 0.0187 and p = 0.0161, respectively).
Two linear regression models with FSO SUVR values as an outcome were performed to assess for associations between FSO hypometabolism and other non-TDP-43 pathologies. In the first linear regression model, the following covariates were included and were treated as categorical with the exception of age at death: sex (male vs female), high Braak NFT stage coded as binary (Braak NFT stages IV–VI [1] vs Braak NFT stages I–III [0]), neuritic Aβ plaques (present/absent), Lewy body pathology (present/absent), HS (present/absent), TDP-43 status (positive/negative). In the second linear regression model, the same covariates as above were included with the differences that Braak NFT stage, neuritic Aβ plaque stage (NACCNEUR), and Lewy body pathology (NACCLEWY stage) were treated as continuous variables.
FSO SUVR values were plotted against IMT SUVR values and based on the plot the modified ratio of IMT/FSO was proposed and tested for its ability to predict TDP-43(+) status. We then compared 4 logistic regression model formulations: IMT only, FSO only, IMT and FSO together, and the IMT/FSO ratio to predict TDP-43 positivity, TDP-43 stage ≥2, and the presence of HS. SUVR values from each patient were implemented in each of these model formulations. Area under the ROC curve, as well as the cut point that maximizes sensitivity plus specificity, are reported for all models. These analyses were performed using the entire cohort and using the cohort with HS cases excluded in order to account for confounding effect of HS.
A logistic regression was also performed including MRI-based IMT, FSO, and FSM volumes, correcting for age, sex, Braak NFT stage, NACCNEUR stage, NACCLEWY stage, total intracranial volume, and HS. IMT was the only MRI variable that was associated with TDP-43 status and hence we again used logistic regression models to assess the predictive power of IMT. We report the area under the ROC curve, the cut point that maximized sensitivity plus specificity, and the corresponding sensitivity and specificity for predicting TDP-43(+) status, TDP-43 stage ≥2, and the presence of HS using the IMT.
In each formulation of the reduced classification models, penalized maximum likelihood estimation was used to shrink and stabilize coefficients and to decrease overfitting in our sample. Each penalty was chosen by fitting the model to a sequence of penalties, selecting the penalty that maximized Tsai corrected Akaike information criterion.33
Data availability
Anonymized data are available from the corresponding author upon request from any qualified investigator for purposes of replicating procedures and results.
Results
Study cohort
Out of 73 cases that were included in this study, 27 (37%) were identified as TDP-43(+). When comparing TDP-43(+) to TDP-43(−) cases, female sex was more common among TDP-43(+) cases (14/27 [52%] vs 11/46 [24%], p = 0.0152). Patients who were TDP-43(+) also had more years of education (p = 0.0410). APOE ε4 carrier status, disease duration, age at death, and years to death from the last FDG-PET scan did not differ between the groups (p > 0.05) (table 1).
Table 1.
Demographic and clinical characteristics of study participants

There was a significant difference in distribution of clinical diagnoses between the groups (p = 0.0026). In TDP-43(+) cases, only 1/27 (4%) was identified as cognitively unimpaired, 19/27 (70%) patients had been diagnosed with probable AD dementia, and 3/27 (11%) patients had been given a clinical diagnosis of dementia with Lewy bodies, compared to 13/46 (28%), 13/46 (28%), and 11/46 (24%) in TDP-43(−) cases, respectively (table 1).
Based on pathology analysis, TDP-43(+) cases had a higher NFT burden, with 24/27 (89%) cases with Braak stage IV or greater compared to 25/46 (54%) of TDP-43(−) cases (p = 0.0233). Out of all 73 cases, 6 cases (8%) of HS were identified, all of which were TDP-43(+). NACCNEUR and NACCLEWY stages did not differ between the groups (p > 0.05) (table 2).
Table 2.
Pathologic characteristics of autopsy cohort

Voxel-level findings
On MRI, the TDP-43(+) cases had greater volume loss of the left amygdala and hippocampus and right hippocampus compared to the TDP-43(−) cases (uncorrected p < 0.001) (figure 2). The findings in the left amygdala and hippocampus also survived correction for multiple comparisons using the false discovery rate at p < 0.05. On FDG-PET, the TDP-43(+) cases showed areas of greater hypometabolism in the left amygdala and hippocampus, which coincide with areas of atrophy detected by MRI. However, FDG-PET also detected areas of greater hypometabolism in the left frontal superior medial and frontal supraorbital regions in the TDP-43(+) cases compared to TDP-43(−) cases (p < 0.001, uncorrected) (figure 2). The FDG-PET voxel-level findings did not survive correction for multiple comparisons.
Figure 2. Three-dimensional brain renderings show results of MRI and [18F]-fluorodeoxyglucose PET (FDG-PET) analyses in trans-active response DNA-binding protein of 43 kDa (TDP-43)–positive patients.

Compared to TDP-43(−) patients, TDP-43(+) patients had a greater degree of atrophy in medial temporal lobe detected by MRI. Compared to TDP-43(−) patients, TDP-43(+) patients had a greater degree of hypometabolism in medial temporal, frontal superior medial, and supraorbital regions detected by FDG-PET. Results are shown at p(unc) < 0.001 corrected for field strength, age at death, sex, and Braak neurofibrillary tangle and neuritic plaque stages.
The IMT ratio as a TDP-43-positive status predictor
Because HS is frequently associated with TDP-43 deposition,5,12,13 including in our series of cases, we determined whether the IMT ratio proposed to predict HS could also be used to predict TDP-43 status. First, we tested if the ratio worked for prediction of HS per se. Indeed, the ratio values differed between HS-positive and HS-negative cases (p = 0.001).14 After building a receiver operating characteristic (ROC) curve and applying penalized maximum likelihood estimation to shrink and stabilize coefficients in order to decrease overfitting in our sample, the best cut point was determined to be equal to −2.15, which resulted in a sensitivity of 83% and a specificity of 82%. When applied across the entire cohort of 73 cases, IMT was able to predict TDP-43(+) status at a computer-generated cut point of −0.17, with a significant reduction in sensitivity: 48%. This finding raised the concern that HS cases might be driving the statistical power of the test. Hence, we excluded HS cases and repeated the analysis, which showed no difference in IMT between TDP-43(+) and TDP-43(−) cases (p = 0.11). To further understand why IMT, which is sensitive and specific for HS prediction, performed poorly for TDP-43, we tested whether it performed better when predicting TDP-43 that had involved the subiculum of the hippocampus, which is equivalent to TDP-43 stage 2 and above. Indeed, the ratio yielded statistically significant results confirming that IMT is useful when TDP-43 is present in the hippocampus, but less so at TDP-43 stage 1 when TDP-43 deposition is limited to amygdala. Area under the ROC curve, probability value, cut point, sensitivity and specificity of each analysis are summarized in table 3.
Table 3.
[18F]-fluorodeoxyglucose standard uptake value ratio: summaries of cross-validated logistic regression models, one model per row, using different formulations to predict 3 outcomes of interest

Contribution of frontal lobe hypometabolism to TDP-43(+) status prediction
The SUVR values of FSM and FSO regions were tested for significant difference between TDP-43(+) and TDP-43(−) status. Whereas FSM values did not differ, FSO values were smaller in TDP-43(+) cases compared to TDP-43(−) cases (p = 0.0084) and could even serve as a sole predictor of TDP-43(+) status (table 3). Hence, only FSO was considered for further analyses. Linear regression models where all pathologic variables were treated as categorical revealed that only older age at death (p = 0.0319) and TDP-43(+) status (p = 0.0045) were associated with FSO hypometabolism; when Braak NFT stage, neuritic Aβ plaque stage, and Lewy body pathology stage were treated as continuous variables, only TDP-43(+) status was associated with FSO region hypometabolism (p = 0.0063).
Multivariate logistic regression analysis correcting for Braak NFT, Lewy body, and neuritic plaque stages showed that both IMT and FSO values remained strongly associated with positive TDP-43 status (p < 0.0001). Using the coefficients from the logistic regression analysis, the following formula was proposed: TDP-43(+) = 8.73 × (IMT) − 10.32 × FSO + 2.861, referred to as IMT + FSO in table 3 for simplification. Values derived from the proposed formula differed between TDP-43(+) and TDP-43(−) cases (p < 0.001) regardless of TDP-43 stage or presence of HS. The formula was predictive of TDP-43(+) status as well as HS and TDP-43 stage ≥2 (table 3).
When looking at a scatterplot (figure 3), it was noticeable that it is difficult to effectively discriminate between TDP-43(+) and TDP-43(−) cases using the x-axis or the y-axis alone. Therefore, a relationship between IMT and FSO, not derived from logistic regression analysis, was assessed based on visual observation of the scatterplot. We proposed the following ratio to evaluate for its ability to predict TDP-43(+) status: TDP-43(+) = IMT/FSO. After applying penalized maximum likelihood estimation, we found that this ratio performed comparably to IMT + FSO at TDP-43 status, TDP-43 stage ≥2, and HS prediction. Area under the ROC curve, cut point, probability value, sensitivity, and specificity of each analysis are summarized in table 3.
Figure 3. Scatterplot shows the relationship between inferior temporal standard uptake value ratio (SUVR)/medial temporal SUVR and frontal supraorbital SUVR values for the cohort.
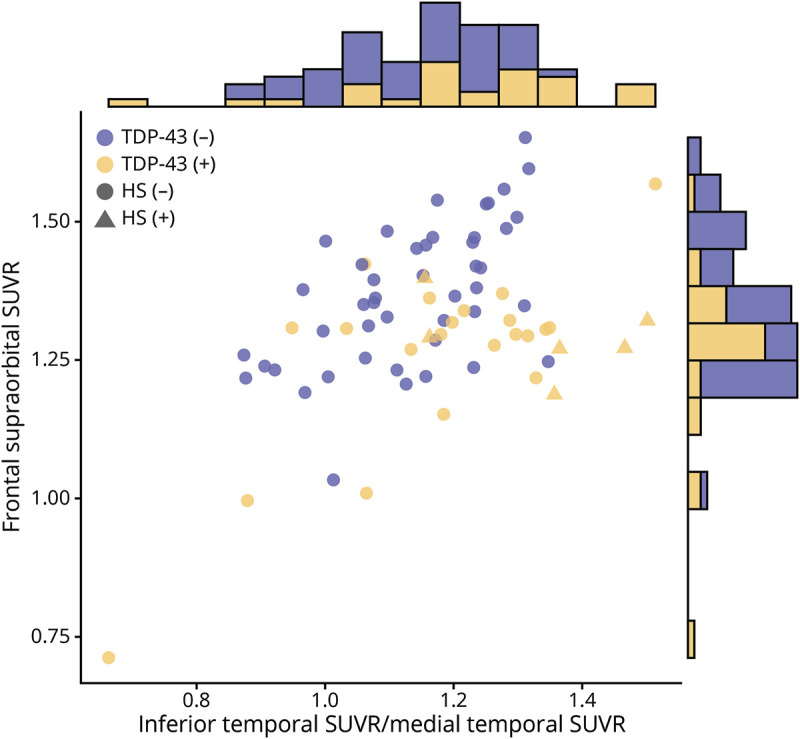
Blue dots represent trans-active response DNA-binding protein of 43 kDa TDP-43(−) cases; yellow triangles (hippocampal sclerosis [HS]–positive) or dots (HS-negative) represent TDP-43(+) cases. Marginal histograms contrasting TDP-43(−) and TDP-43(+) cases for each variable individually are included. While there appears to be some separation of the patients based on TDP-43 status along the diagonal, there is a substantial overlap in both marginal histograms, making an optimal cut point difficult to establish using only one variable.
Structural MRI analyses
The IMT was the only variable strongly associated with TDP-43(+) status (p = 0.0081) in the MRI multivariate logistic regression and hence it is the only variable we considered for further analyses. Using MRI, our prediction of TDP-43(+) status was sensitive but far less specific compared to data from FDG-PET; however, we were able to predict the presence of HS with the same sensitivity and slightly increased specificity (table 4).
Table 4.
Gray matter volume: summaries of cross-validated logistic regression model for ratio of inferior temporal region to medial temporal region (IMT) to predict 3 outcomes of interest

Discussion
The absence of a TDP-43-specific biomarker is a major barrier in antemortem diagnosis of Alzheimer-related TDP-43 proteinopathy. In this study, we showed that FDG-PET imaging detected additional affected areas in the frontal lobe in TDP-43(+) cases compared to MRI. Moreover, using the above mentioned regions of hypometabolism, we were able to generate and test 2 ratios that showed good sensitivity and specificity in predicting TDP-43 in our cohort regardless of the TDP-43 stage. Therefore, accounting for the lack of a better alternative, FDG-PET imaging might be the diagnostic test of choice when it comes to Alzheimer-related TDP-43 proteinopathy detection, considering its superiority to MRI findings in terms of better combination of sensitivity and specificity.
As expected, MRI showed greater medial temporal atrophy in TDP-43(+) cases compared to TDP-43(−) ones, concurring with our previous studies.5 This is not surprising, considering the fact that deposition of TDP-43 starts in amygdala and spreads to hippocampus, with cortical regions being affected at advanced stages only.24 FDG-PET imaging showed decreased metabolism in medial temporal regions, as well as frontal superior medial and supraorbital regions. We used IMT reported before as a HS predictor14 to evaluate if it could predict TDP-43(+) cases. It performed well in prediction of HS and TDP-43 that had reached the hippocampus (TDP-43 stage≥2), but was not able to identify cases where TDP-43 was limited to amygdala. Hence, medial temporal hypometabolism, even though characteristic for TDP-43-positive cases, is not synonymous with TDP-43(+) status and cannot be used to predict early stage TDP-43 deposition.
Multivariate logistic regression modeling including FSO, FSM, and IMT as covariates showed only FSO and IMT as being strongly associated with TDP-43(+) status. Based on logistic regression model, we used IMT and FSO values to determine a cut point that can be used to distinguish TDP-43(+) cases regardless of the TDP-43 stage from TDP-43(−) ones and we acquired sensitive and specific results. Incorporation of FSO SUVRs into the denominator of IMT improved the sensitivity and specificity and the composite ratio outperformed the IMT. Therefore, hypometabolism in the FSO region is of importance when it comes to determination of TDP-43 status and should be considered as a possible predictor in combination with medial temporal hypometabolism.
We propose the modified ratio of IMT/FSO as candidate predictor of TDP-43 status due to its comparable if not superior to IMT + FSO results in terms of sensitivity and specificity, simplicity, and likely improved generalizability. We did not have a validation cohort to directly contrast out of sample performance. However, since we relied on a widely available atlas, the modified ratio can be applied easily to other cohorts in future studies.
It is rational to question how hypometabolism in the frontal supraorbital region can be predictive of early stages of TDP-43 deposition limited to amygdala when TDP-43 reaches frontal neocortex only at stage 6. It is unlikely that reduced FDG uptake in FSO is due to TDP-43 deposition in that region; however, it is plausible that TDP-43 presence in the amygdala can indirectly but specifically affect metabolism in the FSO region through disruption of neuronal circuitry or other pathways. Amygdala makes up part of the limbic system and, therefore, is widely connected throughout the brain, including the frontal regions. In fact, anatomical tracing studies in animals and humans have shown the existence of a brain network between the ventrolateral sector of the amygdala and the lateral orbitofrontal cortex, lesions associated with altered social perception.34,35 Moreover, resting-state fMRI data demonstrated amygdala–frontal coupling with orbitofrontal cortex being one of the involved regions. Precisely, the strength of coupling between amygdala and orbitofrontal cortex was predictive of successful emotional regulation, pointing to significance and functionality of this connection.36
Areas of hypometabolism detected in our study are consistent with prior work that looked at atrophy and hypometabolism patterns in AD: frontal regions, relatively spared in terms of atrophy, displayed hypometabolic patterns together with severely atrophic limbic structures within medial temporal lobe.37 An FDG-PET study looking at TDP-43-associated HS cases showed greater involvement of medial temporal and orbitofrontal regions compared to HS-negative AD.14 Given the strong evidence of functional connectivity between amygdala and frontal regions and imaging and clinical findings in case of lesions, deposition of TDP-43 might be responsible for hypometabolism in FSO identified in our cohort.
The present study has a number of limitations. First, we have an imbalance between TDP-43(+) and TDP-43(−) cases and an unequal distribution of TDP-43 stages among the TDP-43(+) cases. Increasing the sample size and balancing all the variables may provide more statistical power to our findings and also help detect other regions or correlations that we were not able to identify. Second, fluorodeoxyglucose is not a direct marker of TDP-43 or neurodegeneration; developing a specific biomarker for TDP-43, such as a PET ligand, is important. There is also a time lag between the FDG-PET and death; given that, pathologic findings might be more advanced compared to what they might have been at the time of the actual scan. However, when we accounted for the time lag in our statistical analyses, the effect was not significant. The pathologic analysis was done on either right or left hemisphere; however, we cannot exclude that if both hemispheres had been examined, more TDP-43(+) cases would have been identified, as well as the presence of HS, different Braak NFT, neuritic plaque, and Lewy body stages, which in turn could affect our findings, albeit likely minimally. We used the SUVR values for ROIs only from one hemisphere to match our pathologic data, which is a strength of the study. Our SPM analysis showed asymmetrical findings with predominantly left-sided areas of hypometabolism. Considering that the pathologic data for 57/73 (78%) cases came from the left hemisphere, it is possible that the SPM results reflect the fact that most of our data came from the left hemisphere. Finally, even though we found a difference in metabolic patterns between the groups in our cohort and our predictive models, cross-validated and strictly penalized, still showed promising results in regards to TDP-43(+) status determination, it is beneficial to determine whether our results are reproducible within a different cohort and possibly a different center to account for selection bias or confounding.
Despite the unavailability of an effective treatment for AD spectrum disorders, prediction of TDP-43 status carries a significant diagnostic and clinical value. As mentioned before, TDP-43 might present as an advantageous therapy target and also an important factor to consider when it comes to clinical trials that are targeted to other proteins or molecules of interest. At the same time, based on reported associations of TDP-43 deposition with particular clinical features such as marked memory impairment and overall cognitive decline, being able to predict TDP-43(+) status at earlier stages can provide valuable information on probable prognosis and course of the disease for the patients and their families. Our study has shown good sensitivity and specificity in predicting early stage TDP-43 with FDG-PET, which is widely available and safely used in humans. Whereas development of a specific ligand is needed, it will take time before one can be clinically applied; therefore, our findings are an important step in predicting TDP-43 status, and they can be clinically implemented.
Glossary
- Aβ
β-amyloid
- AD
Alzheimer disease
- FDG-PET
[18F]-fluorodeoxyglucose PET
- FSM
frontal superior medial
- FSO
frontal supraorbital
- FWHM
full-width at half maximum
- HS
hippocampal sclerosis
- IMT
inferior temporal to medial temporal ratio
- IT
inferior temporal gyrus
- MCALT
Mayo Clinic Adult Lifespan Template
- MT
medial temporal
- NACC
National Alzheimer's Coordinating Center
- NACCLEWY
Lewy bodies staged according to National Alzheimer's Coordinating Center
- NACCNEUR
neuritic plaques staged according to National Alzheimer's Coordinating Center
- NFT
neurofibrillary tangle
- NIA-AA
National Institute on Aging–Alzheimer Association
- PVC
partial volume correction
- ROC
receiver operating characteristic
- ROI
region of interest
- SUVR
standard uptake value ratio
- TDP-43
trans-active response DNA-binding protein of 43 kDa
Appendix. Authors
Footnotes
Class of Evidence: NPub.org/coe
Study funding
Study funded by NIH grants R01 AG37491-10, P50 AG16574, and U01 AG006786.
Disclosure
M. Buciuc, H. Botha, M.E. Murray, C.G. Schwarz, and M.L. Senjem report no relevant disclosures. D.T. Jones receives research/grant support from the Minnesota Partnership for Biotechnology and Medical Genomics (P006598701). D.S. Knopman serves on a Data Safety Monitoring Board for the DIAN study; and is an investigator in clinical trials sponsored by Biogen, Lilly Pharmaceuticals, and the University of Southern California. B.F. Boeve reports no relevant disclosures. R.C. Petersen has served on the National Advisory Council on Aging and on the scientific advisory boards of Pfizer, GE Healthcare, Elan Pharmaceuticals, and Janssen Alzheimer Immunotherapy; has received publishing royalties from Oxford University Press; and has been a consultant for Roche Incorporated, Merck, Genentech, Biogen, and Eli Lily. C.R. Jack, Jr. is a consultant for Lily and serves on an independent data monitoring board for Roche, but receives no personal compensation from any commercial entity. L. Petrucelli has a patent issued (US patent 9,448,232). J.E. Parisi and D.W. Dickson report no relevant disclosures. V. Lowe is a consultant for Bayer Schering Pharma, Piramal Life Sciences, and Merck Research and receives research support from GE Healthcare, Siemens Molecular Imaging, and AVID Radiopharmaceuticals. J.L. Whitwell and K.A. Josephs reports no relevant disclosures. Go to Neurology.org/N for full disclosures.
References
- 1.Josephs KA, Whitwell JL, Tosakulwong N, et al. TAR DNA‐binding protein 43 and pathological subtype of Alzheimer's disease impact clinical features. Ann Neurol 2015;78:697–709. [DOI] [PMC free article] [PubMed] [Google Scholar]
- 2.James BD, Wilson RS, Boyle PA, Trojanowski JQ, Bennett DA, Schneider JA. TDP-43 stage, mixed pathologies, and clinical Alzheimer's-type dementia. Brain 2016;139:2983–2993. [DOI] [PMC free article] [PubMed] [Google Scholar]
- 3.McAleese KE, Walker L, Erskine D, Thomas AJ, McKeith IG, Attems J. TDP‐43 pathology in Alzheimer's disease, dementia with Lewy bodies and ageing. Brain Pathol 2017;27:472–479. [DOI] [PMC free article] [PubMed] [Google Scholar]
- 4.Davidson YS, Raby S, Foulds PG, et al. TDP-43 pathological changes in early onset familial and sporadic Alzheimer's disease, late onset Alzheimer's disease and Down's syndrome: association with age, hippocampal sclerosis and clinical phenotype. Acta Neuropathol 2011;122:703–713. [DOI] [PubMed] [Google Scholar]
- 5.Josephs KA, Whitwell JL, Knopman DS, et al. Abnormal TDP-43 immunoreactivity in AD modifies clinicopathologic and radiologic phenotype. Neurology 2008;70:1850–1857. [DOI] [PMC free article] [PubMed] [Google Scholar]
- 6.Josephs KA, Whitwell JL, Weigand SD, et al. TDP-43 is a key player in the clinical features associated with Alzheimer's disease. Acta Neuropathol 2014;127:811–824. [DOI] [PMC free article] [PubMed] [Google Scholar]
- 7.Boyle PA, Yang J, Yu L, et al. Varied effects of age-related neuropathologies on the trajectory of late life cognitive decline. Brain 2017;140:804–812. [DOI] [PMC free article] [PubMed] [Google Scholar]
- 8.Wilson RS, Yu L, Trojanowski JQ, et al. TDP-43 pathology, cognitive decline, and dementia in old age. JAMA Neurol 2013;70:1418–1424. [DOI] [PMC free article] [PubMed] [Google Scholar]
- 9.Josephs KA, Dickson DW, Tosakulwong N, et al. Rates of hippocampal atrophy and presence of post-mortem TDP-43 in patients with Alzheimer's disease: a longitudinal retrospective study. Lancet Neurol 2017;16:917–924. [DOI] [PMC free article] [PubMed] [Google Scholar]
- 10.Amador‐Ortiz C, Dickson DW. Neuropathology of hippocampal sclerosis. Handb Clin Neurol 2008;89:569–572. [DOI] [PubMed] [Google Scholar]
- 11.Amador‐Ortiz C, Lin WL, Ahmed Z, et al. TDP‐43 immunoreactivity in hippocampal sclerosis and Alzheimer's disease. Ann Neurol 2007;61:435–445. [DOI] [PMC free article] [PubMed] [Google Scholar]
- 12.Nag S, Yu L, Capuano AW, et al. Hippocampal sclerosis and TDP‐43 pathology in aging and Alzheimer disease. Ann Neurol 2015;77:942–952. [DOI] [PMC free article] [PubMed] [Google Scholar]
- 13.Nelson PT, Schmitt FA, Lin Y, et al. Hippocampal sclerosis in advanced age: clinical and pathological features. Brain 2011;134:1506–1518. [DOI] [PMC free article] [PubMed] [Google Scholar]
- 14.Botha H, Mantyh WG, Murray ME, et al. FDG-PET in tau-negative amnestic dementia resembles that of autopsy-proven hippocampal sclerosis. Brain 2018;141:1201–1217. [DOI] [PMC free article] [PubMed] [Google Scholar]
- 15.Yang H-S, Yu L, White CC, et al. Evaluation of TDP-43 proteinopathy and hippocampal sclerosis in relation to APOE ε4 haplotype status: a community-based cohort study. Lancet Neurol 2018;17:773–781. [DOI] [PMC free article] [PubMed] [Google Scholar]
- 16.Wennberg AM, Tosakulwong N, Lesnick TG, et al. Association of apolipoprotein E ε4 with transactive response DNA-binding protein 43. JAMA Neurol 2018;75:1347–1354. [DOI] [PMC free article] [PubMed] [Google Scholar]
- 17.Nelson PT, Smith CD, Abner EL, et al. Hippocampal sclerosis of aging, a prevalent and high-morbidity brain disease. Acta Neuropathol 2013;126:161–177. [DOI] [PMC free article] [PubMed] [Google Scholar]
- 18.Hyman BT, Phelps CH, Beach TG, et al. National Institute on Aging–Alzheimer's Association guidelines for the neuropathologic assessment of Alzheimer's disease. Alzheimer's Dement 2012;8:1–13. [DOI] [PMC free article] [PubMed] [Google Scholar]
- 19.Braak H, Braak E. Neuropathological stageing of Alzheimer-related changes. Acta Neuropathol 1991;82:239–259. [DOI] [PubMed] [Google Scholar]
- 20.Braak H, Alafuzoff I, Arzberger T, Kretzschmar H, Del Tredici K. Staging of Alzheimer disease-associated neurofibrillary pathology using paraffin sections and immunocytochemistry. Acta Neuropathol 2006;112:389–404. [DOI] [PMC free article] [PubMed] [Google Scholar]
- 21.Beekly DL, Ramos EM, Lee WW, et al. The National Alzheimer's Coordinating Center (NACC) database: the uniform data set. Alzheimer Dis Assoc Disord 2007;21:249–258. [DOI] [PubMed] [Google Scholar]
- 22.Mirra SS, Heyman A, McKeel D, et al. The Consortium to Establish a Registry for Alzheimer's Disease (CERAD): part II: standardization of the neuropathologic assessment of Alzheimer's disease. Neurology 1991;41:479. [DOI] [PubMed] [Google Scholar]
- 23.Josephs KA, Murray ME, Whitwell JL, et al. Staging TDP-43 pathology in Alzheimer's disease. Acta Neuropathol 2014;127:441–450. [DOI] [PMC free article] [PubMed] [Google Scholar]
- 24.Josephs KA, Murray ME, Whitwell JL, et al. Updated TDP-43 in Alzheimer's disease staging scheme. Acta Neuropathol 2016;131:571–585. [DOI] [PMC free article] [PubMed] [Google Scholar]
- 25.Hu WT, Josephs KA, Knopman DS, et al. Temporal lobar predominance of TDP-43 neuronal cytoplasmic inclusions in Alzheimer disease. Acta Neuropathol 2008;116:215. [DOI] [PMC free article] [PubMed] [Google Scholar]
- 26.Hasegawa M, Arai T, Akiyama H, et al. TDP-43 is deposited in the Guam parkinsonism–dementia complex brains. Brain 2007;130:1386–1394. [DOI] [PubMed] [Google Scholar]
- 27.Dickson DW, Davies P, Bevona C, et al. Hippocampal sclerosis: a common pathological feature of dementia in very old (≥ 80 years of age) humans. Acta Neuropathol 1994;88:212–221. [DOI] [PubMed] [Google Scholar]
- 28.Rauramaa T, Pikkarainen M, Englund E, et al. Consensus recommendations on pathologic changes in the hippocampus: a postmortem multicenter inter-rater study. J Neuropathol Exp Neurol 2013;72:452–461. [DOI] [PubMed] [Google Scholar]
- 29.Jack CR Jr, Lowe VJ, Senjem ML, et al. 11C PiB and structural MRI provide complementary information in imaging of Alzheimer's disease and amnestic mild cognitive impairment. Brain 2008;131:665–680. [DOI] [PMC free article] [PubMed] [Google Scholar]
- 30.Avants BB, Epstein CL, Grossman M, Gee JC. Symmetric diffeomorphic image registration with cross-correlation: evaluating automated labeling of elderly and neurodegenerative brain. Med Image Anal 2008;12:26–41. [DOI] [PMC free article] [PubMed] [Google Scholar]
- 31.R Foundation for Statistical Computing.R: A Language and Environment for Statistical Computing. Vienna:R Foundation for Statistical Computing;2012. Available at: R-project.org. Accessed October 22, 2019. [Google Scholar]
- 32.Harrell FE Jr. rms: Regression modeling strategies. R Package Version 5.1-1. Vienna: R Foundation for Statistical Computing;2014. [Google Scholar]
- 33.Harrell FE Jr. Regression modeling strategies: with applications to linear models, logistic and ordinal regression, and survival analysis. Berlin: Springer; 2015. [Google Scholar]
- 34.Bickart KC, Dickerson BC, Barrett LF. The amygdala as a hub in brain networks that support social life. Neuropsychologia 2014;63:235–248. [DOI] [PMC free article] [PubMed] [Google Scholar]
- 35.McDonald A. Organization of amygdaloid projections to the prefrontal cortex and associated striatum in the rat. Neuroscience 1991;44:1–14. [DOI] [PubMed] [Google Scholar]
- 36.Banks SJ, Eddy KT, Angstadt M, Nathan PJ, Phan KL. Amygdala–frontal connectivity during emotion regulation. Soc Cogn Aff Neurosci 2007;2:303–312. [DOI] [PMC free article] [PubMed] [Google Scholar]
- 37.Grothe MJ, Teipel SJ; Initiative AsDN. Spatial patterns of atrophy, hypometabolism, and amyloid deposition in Alzheimer's disease correspond to dissociable functional brain networks. Hum Brain Mapp 2016;37:35–53. [DOI] [PMC free article] [PubMed] [Google Scholar]
Associated Data
This section collects any data citations, data availability statements, or supplementary materials included in this article.
Data Availability Statement
Anonymized data are available from the corresponding author upon request from any qualified investigator for purposes of replicating procedures and results.