Abstract
Objective
To identify preferred neurofilament assays and clinically validate serum neurofilament light (NfL) and phosphorylated neurofilament heavy (pNfH) as prognostic and potential pharmacodynamic biomarkers relevant to amyotrophic lateral sclerosis (ALS) therapy development.
Methods
In this prospective, multicenter, longitudinal observational study of patients with ALS (n = 229), primary lateral sclerosis (n = 20), and progressive muscular atrophy (n = 11), biological specimens were collected, processed, and stored according to strict standard operating procedures (SOPs). Neurofilament assays were performed in a blinded manner by independent contract research organizations.
Results
For serum NfL and pNfH measured using the Simoa assay, there were no missing data (i.e., technical replicates below the lower limit of detection were not encountered). For the Iron Horse and Euroimmun pNfH assays, such missingness was encountered in ∼4% and ∼10% of serum samples, respectively. Mean coefficients of variation for NfL in serum and CSF were both ∼3%. Mean coefficients of variation for pNfH in serum and CSF were ∼4%–5% and ∼2%–3%, respectively, in all assays. Baseline serum NfL concentration, but not pNfH, predicted the future Revised ALS Functional Rating Scale (ALSFRS-R) slope and survival. Incorporation of baseline serum NfL into mixed effects models of ALSFRS-R slopes yields an estimated sample size saving of ∼8%. Depending on the method used to estimate effect size, use of serum NfL (and perhaps pNfH) as pharmacodynamic biomarkers, instead of the ALSFRS-R slope, yields significantly larger sample size savings.
Conclusions
Serum NfL may be considered a clinically validated prognostic biomarker for ALS. Serum NfL (and perhaps pNfH), quantified using the Simoa assay, has potential utility as a pharmacodynamic biomarker of treatment effect.
Therapy development for amyotrophic lateral sclerosis (ALS) is challenging for many reasons, with the design and interpretation of phase II studies especially so.1 These mid-development studies typically employ traditional clinical measures such as survival or the rate of decline on the Revised ALS Functional Rating Scale (ALSFRS-R) as the principal measures of therapeutic effect, but are typically underpowered, making it difficult to decide which experimental therapeutics to advance from phase II to phase III.2 Biomarkers with prognostic and potential pharmacodynamic utility have great potential to help overcome these challenges.2,3 Controlling for prognostic biomarkers, for example, might reduce phenotypic heterogeneity, thereby improving statistical power for a fixed sample size. Similarly, pharmacodynamic biomarkers may help to verify target engagement or demonstrate the presence of the intended biological effect. Neurofilaments—both neurofilament light (NfL) and phosphorylated neurofilament heavy (pNfH), in blood and CSF—have been proposed as potential ALS biomarkers with diagnostic value,4–8 utility in predicting prognosis,5–7,9–14 and as possible pharmacodynamic biomarkers.15,16 The potential diagnostic utility aside, which is not the focus of this article, the precise role of neurofilaments as prognostic or pharmacodynamic biomarkers in ALS trials is not yet fully defined. Several questions remain unresolved. Which pNfH assay, among the many available, should be selected? Do NfL and pNfH convey the same information, or should both be measured? Moreover, understanding the prognostic value of neurofilaments has been hampered by the use of estimated rather than measured rates of disease progression through longitudinal follow-up and inconsistent consideration of the value added by neurofilaments to clinical predictors of prognosis (such as age, sex, bulbar onset). Similarly, studies of the longitudinal trajectories of neurofilaments have reached inconsistent conclusions about their relationship to clinical measures of disease progression, driven in part by relatively small participant numbers.
Here we present NfL and pNfH data (obtained from serum and CSF) from a large cohort of patients with ALS and related disorders who have undergone careful longitudinal clinical phenotyping along with serial collection of biological samples. Serum and CSF neurofilaments have been quantified using a variety of assays, performed by contract research organizations (CROs) blinded to participant identity and status. Combined with carefully collected phenotypic data, we have endeavored to address unanswered questions related to the prognostic and potential pharmacodynamic utility of neurofilament levels.
Methods
Study population
Patients with ALS and related disorders were enrolled at multiple centers through the Phenotype-Genotype-Biomarker study of the Clinical Research in ALS and Related Disorders for Therapeutic Development (CReATe) Consortium. Rigorously standardized clinical assessments and biological sample collections were performed every 3–6 months. Samples included in this experiment were from study visits that took place between April 2015 and November 2017.
Standard protocol approvals, registrations, and patient consents
The Phenotype-Genotype-Biomarker study is registered at clinicaltrials.gov (NCT02327845). The University of Miami institutional review board (IRB) (the central IRB for CReATe) approved the study; all participants provided written informed consent.
Sample collection, processing, and storage
Biological specimens were collected, processed, and stored according to strict standard operating procedures (SOP).17 Briefly, blood was collected in serum-separating BD vacutainers and allowed to clot upright at room temperature for 1–2 hours. Following centrifugation (1,750 g for 10 minutes at 4°C), serum was aliquoted into cryogenic sterile freestanding conical microtubes (Nalgene or Bio Plas Inc.) and stored at −80°C. CSF was collected in polypropylene tubes, centrifuged (1,750 g for 10 minutes at 4°C), aliquoted into polypropylene cryogenic sterile freestanding conical microtubes, frozen within ∼30 minutes of collection, and stored at −80°C.
Neurofilament quantification
Serum and CSF neurofilament concentrations were quantified by Quanterix using their Simoa NfL18,19 and pNfH assays20; each plate contained calibrators (0–500 pg/mL for NfL and 0–2,000 pg/mL for pNfH) and quality controls. Samples were diluted to fall within the range of the standard curve. Serum and CSF pNfH were also quantified by Iron Horse Diagnostics, using their in-house assay (which uses monoclonal capture and polyclonal detection antibodies)11 and the Euroimmun CE marked ELISA21 (which reverses the capture and detection antibodies). All samples were measured in duplicate at the same dilution, and all assays were performed blind to clinical measures.
Statistical analysis
Symptom onset was defined as the first occurrence of limb weakness, dysarthria, dysphagia, or dyspnea. ∆FRS was calculated by subtracting baseline ALSFRS-R from 48 (maximum ALSFRS-R score), divided by time (months) from symptom onset to baseline.22 Survival duration was defined as time from symptom onset to permanent assisted ventilation (PAV) (≥22 h/d noninvasive ventilation), tracheostomy, or death.
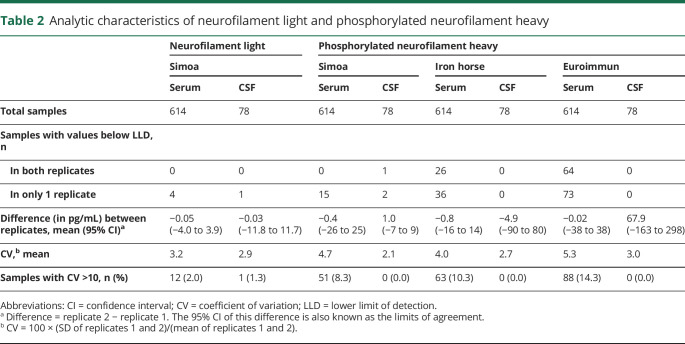
Each sample was assayed twice to generate 2 replicates on each platform. We then computed (1) the number of samples for which neurofilament levels were below the lower limit of detection (LLD), (2) the mean difference and 95% confidence interval (CI) of the differences between replicates (i.e., limits of agreement23), and (3) the coefficients of variation (CVs) between replicates. The association between serum and CSF concentrations was assessed using Spearman rank correlation. These analytic characteristics were qualitatively compared between assay platforms and guided our selection of one of the pNfH assays for further investigation.
To evaluate the prognostic utility of serum NfL and pNfH, we fitted a linear model to estimate the change in ALSFRS-R for each participant over time, using only the subset of participants with at least 3 ALSFRS-R scores. The associations between ALSFRS-R slope estimates and prespecified clinical and baseline neurofilament predictor variables were investigated using multivariable regression. To assess the joint contribution of NfL and pNfH, a likelihood ratio test was used to compare the full model (including clinical and neurofilament variables) to a reduced model (including only clinical variables). The prognostic value of serum neurofilaments was also evaluated by Kaplan-Meier (univariate) and Cox regression (multivariate) methods, using PAV- and tracheostomy-free survival as the outcome.
We then estimated trajectories of changes in neurofilament levels over time using linear regression fitted separately to data from each participant. This model, which was limited to participants with at least 3 available neurofilament values, included neurofilament as the outcome variable and time as predictor variable. Because neurofilament values were heavily skewed, natural logarithm transformation was used to help achieve normality. We also estimated the effect of age in our cohort, using the same linear regression analysis described elsewhere.24 Briefly, a linear model with log neurofilament as the dependent variable, and age as independent variable was fit to the baseline dataset. The estimated regression coefficient for age was then back transformed to the original scale, so that it reflects multiplicative effects (i.e., an estimate of 1.05 means an increase of ∼5% in neurofilament).
To assess the effect of considering baseline serum NfL on the sample size for a placebo-controlled clinical trial with ALSFRS-R slope as its primary outcome, we conducted a simulation similar to that described by Kuffner et al.25 Briefly, we compared 2 mixed effects models, typically used for assessing treatment effects on ALSFRS-R slopes in clinical trials: model 1 included ALSFRS-R scores as the outcome variable, and time, time × group (treatment vs controls), log(baseline NfL), and time × log(baseline NfL) as fixed effects as well as random subject effects to account for correlations from repeated measures in the same participants; model 2 is the same as model 1, but without variables involving NfL. One thousand simulations were performed. For each simulation, treatment group assignment was simulated at random, which assigned half of the patients with ≥3 ALSFRS-R scores (n = 53) to the treatment group and the remaining to the control group. With S1 and S2 representing the estimated standard errors of time × group effects in model 1 and model 2, respectively, the percent reduction in sample size is proportional to the reduction in variance given by  .
.
We also explored the utility of using serum NfL and pNfH as biomarkers to detect pharmacodynamic effect in a phase 2 clinical trial. Sample size estimations for such a trial required us to define a difference (or change) in serum neurofilament that might be regarded as clinically meaningful and which a future trial would need to be powered to detect. First, we considered the difference in serum neurofilament between fast and slow progressing patients (ALSFRS-R rate of decline >1 and <0.5 point/month, respectively), reasoning that this difference in neurofilament could be considered meaningful since it corresponds to a clinically important difference in rates of disease progression. We also considered an alternative approach, in which we defined a meaningful change based on a slope that is more negative (i.e., steeper decline) than the lower bound of the 95% CI of neurofilament trajectories in untreated patients. All analyses were performed using SAS (version 9.4) and R software (r-project.org/).
Data availability
Deidentified data are available from Dryad (doi.org/10.5061/dryad.ttdz08ktb).
Results
Study population
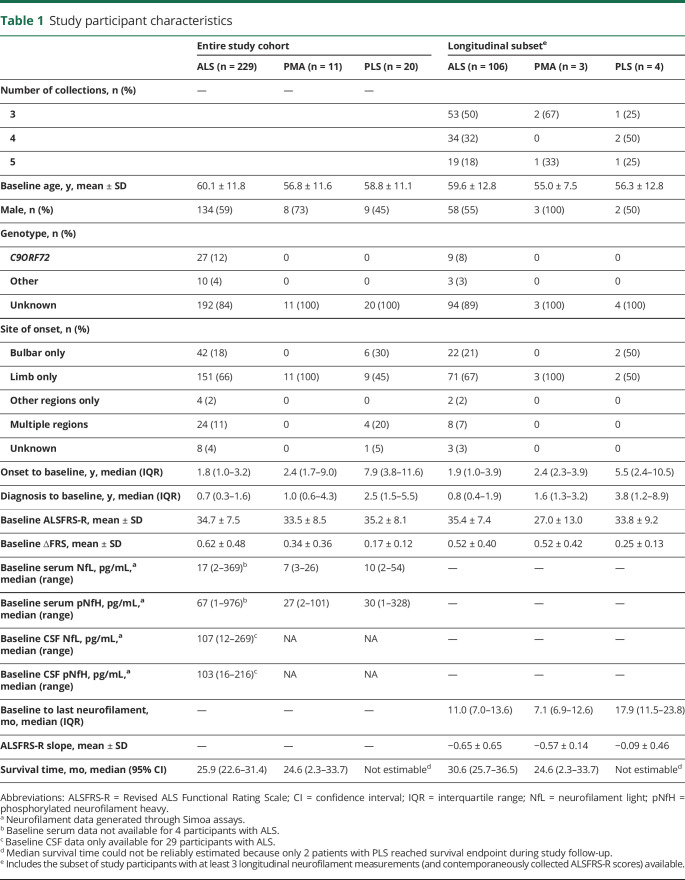
A total of 260 patients (229 ALS, 11 progressive muscular atrophy [PMA], and 20 primary lateral sclerosis [PLS]), with a total of 617 person visits, were included in this study (table 1). For evaluation of the pharmacodynamic potential of neurofilament measurements, analysis was restricted to the subset of 106 ALS, 3 PMA, and 4 PLS with at least 3 longitudinal biofluid collections (table 1).
Table 1.
Study participant characteristics
Analytic characteristics of neurofilament assays in serum and CSF
In CSF, both replicates were very infrequently below assay LLDs (i.e., undetectable); this was true for both NfL and pNfH and in all assays. For serum, undetectable values were infrequent using the Simoa NfL and pNfH assays, but were encountered in ∼4% and ∼10%, respectively, of samples assayed using the Iron Horse and Euroimmun pNfH platforms (table 2). Agreement between technical replicates was high for all assays except for CSF analysis using the Euroimmun assay (table 2). The mean CVs for NfL were ∼3% in serum and CSF, and for pNfH were ∼4%–5% and ∼2%–3% for all assays in serum and CSF, respectively. We selected the Simoa platform for subsequent analyses, given that it had the fewest undetectable values, and good replicate agreement (low CV) in both serum and CSF.
Table 2.
Analytic characteristics of neurofilament light and phosphorylated neurofilament heavy
Baseline neurofilament concentrations
Initial serum concentrations of NfL were higher in the ALS group compared to those with PMA and PLS (p < 0.001; table 1). In the ALS group, higher serum NfL was associated with older age, higher ∆FRS, female sex, the presence of a C9ORF72 repeat expansion, and bulbar symptom onset (all p < 0.001), but not with baseline ALSFRS-R. Higher CSF NfL levels were similarly associated with older age, higher ∆FRS, and female sex, although not reaching statistical significance (possibly due to smaller sample size). Higher baseline serum pNfH among patients with ALS was associated with older age (p = 0.046), higher ∆FRS (p < 0.001), female sex (p = 0.002), and bulbar onset disease (p = 0.035), but not C9ORF72 repeat expansion status or baseline ALSFRS-R. Higher CSF pNfH levels were also associated with a higher ∆FRS, although not reaching statistical significance.
Correlation between serum and CSF neurofilament concentrations
Although CSF could more directly reflect CNS pathophysiology, serum is more easily accessible. Therefore, we examined for each assay how well the value of serum measurements could serve as a proxy for CSF measurements. For pNfH, the serum–CSF correlations were comparable among the 3 assays, albeit with weak correlations (r = 0.16–0.22); the serum–CSF correlation was much stronger for NfL, however (r = 0.62, Simoa platform only).
Potential prognostic utility of baseline neurofilament concentrations
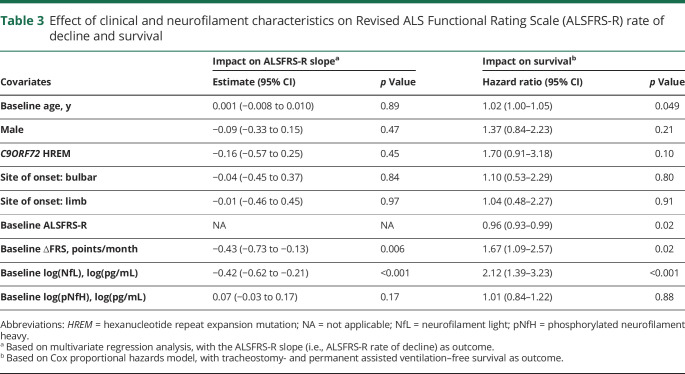
The average (±SD) rate of decline of the ALSFRS-R was 0.65 (±0.65) points per month. Multivariate regression analysis, with the ALSFRS-R slope as the outcome, considering potential clinical predictors of prognosis (age, sex, C9ORF72 status, site of disease onset, baseline ALSFRS-R and ∆FRS), as well as baseline serum NfL and pNfH, identified only ∆FRS as a meaningful clinical predictor. For every 1-point increase in the ∆FRS (preslope), the ALSFRS-R rate of decline is worsened by an additional 0.43 points/month (p = 0.006) (table 3). The addition of baseline serum NfL to the model shows that this biomarker adds prognostic value that is not already explained by known clinical predictors. For every 1-point increase in log serum NfL level, the ALSFRS-R rate of decline is worsened by an additional 0.42 points/month (p < 0.001). By contrast, baseline serum pNfH provided little additional prognostic value beyond the effects of clinical predictors (p = 0.17). When both NfL and pNfH were jointly considered, the results showed that, together, these biomarkers added significantly more prognostic values independent of clinical predictors (p = 0.002, likelihood ratio test); this result, however, was primarily driven by the effect of NfL.
Table 3.
Effect of clinical and neurofilament characteristics on Revised ALS Functional Rating Scale (ALSFRS-R) rate of decline and survival
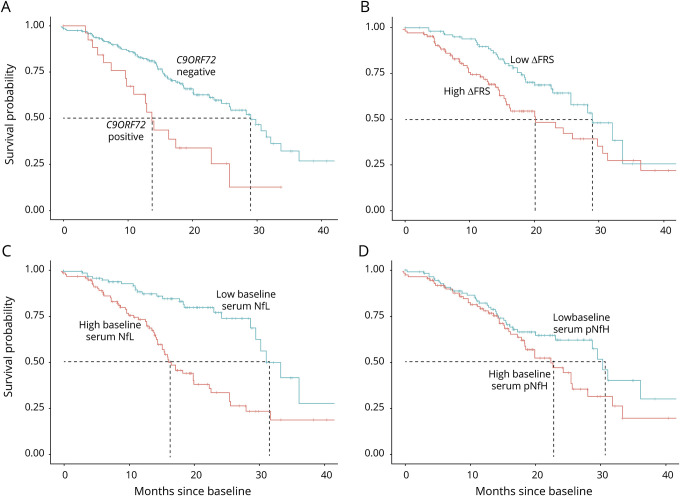
In univariate survival analyses, the presence of C9ORF72 repeat expansion, higher ∆FRS at baseline, and higher baseline serum NfL levels were each associated with worse prognosis (shorter survival), but baseline serum pNfH levels were not (figure 1). In a multivariate Cox proportional hazards model that considered age, sex, C9ORF72 status, site of disease onset, baseline ALSFRS-R, ∆FRS, and baseline serum levels of NfL and pNfH, only age, baseline ALSFRS-R, ∆FRS, and serum NfL were significant predictors of survival (table 3).
Figure 1. Kaplan-Meier survival curves.
Kaplan-Meier survival curves show the prognostic value of (A) C9ORF72 repeat expansion, (B) ∆FRS (dichotomized at the median, 0.62 points/month), (C) baseline serum neurofilament light (NfL) (dichotomized at the median, 17 pg/mL), and (D) baseline serum phosphorylated neurofilament heavy (pNfH) (dichotomized at the median, 67 pg/mL). The presence of a C9ORF72 repeat expansion, higher ∆FRS, higher baseline serum NfL, and higher baseline serum pNfH are shown in red.
Potential pharmacodynamic utility of longitudinal neurofilament concentrations
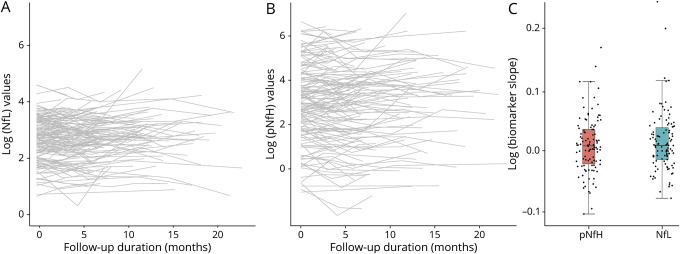
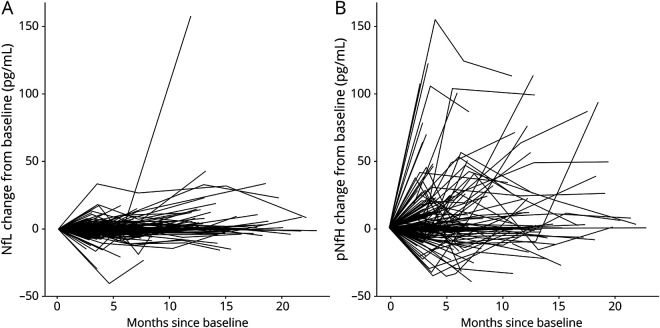
To ready the use of serum NfL and pNfH as potential pharmacodynamic biomarkers of treatment effect in future trials, we estimated their longitudinal trajectories (and variability of slopes). For serum NfL, the average slope was 0.011 log units/month (95% CI, −0.054 to 0.076). Consistent with prior studies,24 we also observed a positive association between NfL and age, with 1.3% increase in NfL for each additional year (95% CI, 0.4%–2.3%). For serum pNfH, the average slope was 0.006 log units/month (95% CI, −0.063 to 0.084) (figure 2). We also quantified the magnitude change in biomarker concentration on the raw scale compared to baseline (figure 3). For serum NfL, the 90th and 95th percentiles of the maximum absolute changes in concentration from baseline are 15 and 22 pg/mL, respectively. For serum pNfH, the 90th and 95th percentiles of the maximum absolute changes in concentration from baseline are 146 and 196 pg/mL, respectively.
Figure 2. Longitudinal trajectories of serum neurofilaments.
(A) Spaghetti plot of log-transformed neurofilament light (NfL) level, (B) spaghetti plot of log-transformed phosphorylated neurofilament heavy (pNfH) level, and (C) boxplot of the distribution of NfL and pNfH slopes. Slope estimates were obtained from a linear model with log-transformed neurofilament level as the outcome and time as the independent variable.
Figure 3. Change in serum neurofilaments over time, as compared to baseline level.
(A) Change from baseline in serum neurofilament light (NfL) (pg/mL) and (B) change from baseline in serum phosphorylated neurofilament heavy (pNfH) (pg/mL).
Utility of neurofilament biomarkers in reducing sample size for future clinical trials
Since baseline NfL level is predictive of ALSFRS-R trajectories, we hypothesized that the number of patients needed for a trial would be reduced when baseline NfL levels, as a prognostic biomarker, are considered. This may be done by including serum NfL as a covariate in the linear mixed models typically used to examine ALSFRS-R slopes. Using a simulation study similar to that described by Kuffner et al.,25 we found that the sample size for an ALS trial would be reduced by about 8.2% with the addition of baseline NfL measurements.
Furthermore, we estimated the sample size required for a future phase 2 trial with serum NfL (or serum pNfH) as a pharmacodynamic biomarker. We considered 2 different outcome measures and what a clinically meaningful treatment difference may be for each. First, assuming that an experimental therapeutic would need to change the slope of serum NfL from our observed average in the untreated state (0.011 log units/month) to less than the lower bound of the 95% CI (−0.054 log units/month) and thereby an estimated treatment difference of 0.065 log units/month, with an estimated SD of 0.048 log units/month, a total sample size of 26 (13 treatment, 13 placebo) would provide 90% power to detect such a treatment difference, using a 2-sample t test with 5% significance level. Similarly, assuming that an experimental therapeutic would need to change the slope of serum pNfH from our observed average in the untreated state (0.006 log units/month) to less than the lower bound of the 95% CI (−0.063 log units/month) and thereby an estimated treatment difference of 0.069 log units/month, with an estimated SD of 0.046 log units/month, a total sample size of 22 (11 treatment, 11 placebo) would provide 90% power to detect such a treatment difference, using a 2-sample t test with 5% significance level.
Alternatively, one may wish to achieve a clinically meaningful difference in NfL (or pNfH) levels (rather than trajectories). Based on an estimated treatment difference of 0.67 log(pg/mL)—which was our observed difference in baseline log(NfL) levels between fast progressors (ALSFRS-R decline of >1 point/month) and slow progressors (ALSFRS-R decline of <0.5 points/month), which were 3.10 and 2.43 log(pg/mL), respectively—and a SD of ∼0.81 log(pg/mL), a total sample size of 64 (32 treatment, 32 placebo) would provide 90% power to detect such a treatment difference, using a 2-sample t test with 5% significance level. By contrast, the much smaller difference of 0.22 log(pg/mL) between serum pNfH levels among fast and slow progressors (3.82 log[pg/mL] and 3.60 log[pg/mL], respectively), combined with a SD of ∼1.43 log(pg/mL), yields a total sample size of 1,778 (889 treatment, 889 placebo) in order to provide 90% power to detect such a treatment difference, using a 2-sample t test with 5% significance level.
For comparison, we also similarly estimated the required sample size for a clinically meaningful 20%–30% reduction in ALSFRS-R slope, a common outcome measure employed in ALS clinical trials.26 Based on our observed average ALSFRS-R slope of −0.648 points/month and an estimated SD of 0.65 points/month, a total of 1,054 or 470 patients would be needed, respectively, to provide power for detecting a 20% or 30% reduction in ALSFRS-R slopes.
Discussion
While much has been written about the prognostic and potential pharmacodynamic utility of neurofilaments in ALS,6,11,12,21,27 most studies have been single-center, measured either NfL or pNfH (but not both), used only a single assay to quantify neurofilament levels, evaluated either blood or CSF (but not both), explored either survival or functional decline (but not both), and rarely quantified functional decline using prospectively collected ALSFRS-R data. Here, we have undertaken a multicenter study with head-to-head comparison of 3 different pNfH assays (performed by 2 different CROs) in serum and CSF, as well as an evaluation of the prognostic and potential pharmacodynamic utility of serum NfL and pNfH, using multivariate analytic techniques that explore the potential value neurofilaments add to readily available clinical information. Functional decline was quantified using prospectively collected ALSFRS-R data, as would be done in a clinical trial. We have also illustrated how serum neurofilament data might be used to aid the design and implementation of future phase II clinical trials.
For pNfH, the Simoa assay had the best sensitivity (fewest values below the assay LLD) and reproducibility (lowest CV between technical replicates in both serum and CSF). Using the Simoa assay, we also found a much stronger correlation between serum and CSF for NfL than for pNfH. The correlations between serum and CSF in this study are substantially lower than in prior published reports.11,21,28 One possible explanation for this discrepancy is that we restricted our analyses to baseline data. As discussed by Bland and Altman,23 when multiple measurements taken from the same participants are used to compute correlation coefficients, the result can appear artificially high because variability between measurements on the same participant is not properly accounted for and the independence assumption of correlation is violated.
We also found that serum NfL is prognostic of future ALSFRS-R decline and survival duration, providing information that is not captured by readily available clinical predictors. While absolute values can vary between patients, serum NfL levels remain largely stable in each patient over time. This may portend clinical utility as pharmacodynamic biomarkers if there are detectable changes in levels following exposure to an experimental therapeutic. This expectation is supported by recent studies of nusinersen for spinal muscular atrophy,29,30 though definitive proof in adult motor neuron diseases would necessarily require an effective therapeutic to test. Moreover, we have illustrated the ways in which use of serum NfL in a phase 2 trial might permit a reduction in sample size. Incorporation of serum NfL as a covariate in a trial that uses the ALSFRS-R rate of decline as the primary outcome measure would yield a modest benefit (∼8% reduction in sample size), but use of NfL as a pharmacodynamic biomarker might offer meaningful sample size savings compared to more traditional phase 2 studies in which changes in the ALSFRS-R are used as the primary outcome measure. The potential utility of serum pNfH is more nuanced. We have found that it does not add prognostic value to readily available clinical parameters and serum NfL. On the other hand, the stability of serum pNfH suggests potential value as a pharmacodynamic biomarker but, depending on the approach used to quantify the clinical meaningfulness of a reduction in pNfH, this may or may not yield sample size savings in a phase 2 clinical trial setting.
The main limitation of this study is that the population may not be adequately representative of patients with ALS who would ordinarily be enrolled in a clinical trial. Patients included in the current study were skewed towards those with more slowly progressive disease (evidenced by an ALSFRS-R slope of −0.65 points/month). Achieving better representation of a trial-like population is the goal of an ongoing study. We note, however, that the longitudinal stability of neurofilaments is not a consequence of this characteristic of the patient cohort, but rather a function of the relatively long latency from symptom onset to study enrollment and baseline assessment, which in turn reflects the well-described diagnostic delay that is characteristic of ALS.31 A fuller picture of the temporal course of the rise in neurofilament levels has emerged from studies of people at genetic risk for ALS, which have shown that NfL and pNfH rise in both the presymptomatic and early symptomatic periods,32,33 with an expected plateau by the time of enrollment in a clinical trial or cohort study such as the one described herein.
A second limitation of the current study is that we have insufficient data to reliably comment on the value of CSF NfL and pNfH as either prognostic or pharmacodynamic biomarkers. Notwithstanding these considerations, this was a large multicenter study with prospective, systematic follow-up and strict SOPs for sample collection, processing, and storage. All assays were performed by independent CROs blinded to clinical data, with comparative data generated across assay platforms, CROs, and neurofilament types.
These results support 2 conclusions. First, serum NfL, but not serum pNfH, may be considered a clinically validated prognostic biomarker. Second, serum NfL and perhaps pNfH may have value as potential pharmacodynamic biomarkers, and both should be incorporated into ongoing and future phase 2 trials; the actual pharmacodynamic utility of these biomarkers will only become apparent once we have effective treatments for ALS.
Acknowledgment
The authors thank Joaquin del Cueto (Project Manager for Research Support, University of Miami); Dr. Lucie Bruijn (ALS Association Chief Scientist); Drs. Amelie Gubitz and Robin Conwit (National Institute of Neurological Disorders and Stroke Program Directors); Dr. Tiina Urv (NCATS Program Officer); Dr. Manish Raisinghani (CEO, Target ALS Foundation); the Rare Diseases Clinical Research Network (RDCRN) Data Management and Coordinating Center (DMCC) at University of South Florida (PI: Dr. Jeffrey Krischer; regulatory specialists: Julie Martin and Kaleena Dezsi; and project managers: Callyn Kirk, Devon Rizzo, and Kristina Bowles); Drs. Zaven Kaprielian (Amgen), Danielle Graham and Toby Ferguson (Biogen), Joe Lewcock (Denali), Felix Yeh (Genentech), Sophie Batteur Parmentier (Merck), Bryan Hill (Mitsubishi Tanabe Pharma), Dave Frendewey (Regeneron), Aarti Sharma (Regeneron), James Dodge (Sanofi), Laure Rosen (Takeda), Ian Reynolds and Neta Zach (Teva), Kelly Dakin (FBRI), Nadine Tatton (AFTD), Amanda Haidet-Phillips (MDA), Robert Bowser (Barrow Neurological Institute), and Leonard Petrucelli (Mayo Clinic Jacksonville) for discussions around selecting biomarker candidates and contract research organizations; the staff of the John P. Hussman Institute for Human Genomics Biorepository Facility at the University of Miami School of Medicine; and the patients who participated in the CReATe Phenotype-Genotype-Biomarker study for their contribution to advancing therapeutic development for ALS and related disorders.
Glossary
- ALS
amyotrophic lateral sclerosis
- ALSFRS-R
Revised ALS Functional Rating Scale
- CI
confidence interval
- CReATe
Clinical Research in ALS and Related Disorders for Therapeutic Development
- CRO
contract research organization
- CV
coefficient of variation
- IRB
institutional review board
- LLD
lower limit of detection
- NfL
neurofilament light
- PAV
permanent assisted ventilation
- PLS
primary lateral sclerosis
- PMA
progressive muscular atrophy
- pNfH
phosphorylated neurofilament heavy
Appendix 1. Authors


Appendix 2. Coinvestigators

Footnotes
CME Course: NPub.org/cmelist
Study funding
The CReATe Consortium (U54 NS090291) is part of the Rare Diseases Clinical Research Network (RDCRN), an initiative of the Office of Rare Diseases Research (ORDR), National Center for Advancing Translational Sciences (NCATS). CReATe is funded through collaboration between NCATS and the National Institute of Neurologic Disorders and Stroke. CReATe is also supported by a Clinical Trial Readiness Grant from NIH (U01NS107027). Supplementary support for the CReATe Biorepository was provided by the ALS Association (Grant ID 16-TACL-242). Target ALS provided support to Quanterix and Iron Horse to cover assay costs as well as a grant to Joanne Wuu. This work was also supported by CTSA grants (UL1TR002366 and UL1TR000001) from NCATS awarded to the University of Kansas.
Disclosure
M. Benatar reports grants from NIH, the ALS Association, the Muscular Dystrophy Association, the Centers for Disease Control and Prevention, the Department of Defense, and Target ALS during the conduct of the study; personal fees from Mitsubishi Tanabe Pharma, AveXis, and Genentech, outside the submitted work; has a provisional patent titled “Determining onset of amyotrophic lateral sclerosis”; and serves as a site investigator on clinical trials funded by Biogen and Orphazyme. L. Zhang reports no relevant disclosures. L. Wang reports grants from the NIH during the conduct of the study. V. Granit reports no relevant disclosures. J. Statland reports grants from NIH, MDA, and the FSH Society during the conduct of the study and personal fees from Fulcrum, Acceleron, Strongbridge, Sarepta, and AveXis, outside the submitted work. R. Barohn reports grants from the NIH during the conduct of the study; grants from FDA/OOPD, the ALS Association, the Muscular Dystrophy Association, Sanofi/Genzyme, Biomarin Pharmaceuticals, IONIS Pharmaceuticals, Teva Pharmaceuticals, Cytokinetics Pharmaceuticals, Eli Lilly and Company, PTC Therapeutics, Orphazyme, Neuraltus Pharmaceuticals, Alexion Pharmaceuticals, Sarepta Therapeutics, and The Marigold Foundation outside the submitted work; personal fees from NuFactor, Momenta, and Plan 365; and other support from Novartis Pharmaceuticals, Option Care, Platform Q Health Education, and Ra Pharma; and patents on the MG-ADL and QMG with royalties paid. A. Swenson reports grants from the University of Iowa during the conduct of the study and other support from Amylyx Pharmaceuticals, FlexPharm, and Cytokinetics outside the submitted work. J. Ravits reports personal fees from MT Pharma and AveXis, outside the submitted work; and serves as a site investigator on a clinical trial funded by Biogen. C. Jackson reports grants from the NIH, Cytokinetics, and Mitsubishi Tanabe Pharma America during the conduct of the study and personal fees from Mallinckrodt, Brainstorm, Mitsubishi Tanabe Pharma America, ITF Pharma, and Anelixis outside the submitted work. T.M. Burns reports no relevant disclosures. J. Trivedi reports grants from NIH, Sanofi-Genzyme, and CSL Behring during the conduct of the study as well as personal fees from CSL Behring outside the submitted work. E.P. Pioro reports grants from NIH and Centers for Disease Control and Prevention during the conduct of the study; grant support from the ALS Association and CDC/NIH outside the submitted work; as well as personal fees from Avanir Pharmaceuticals, Inc., Biohaven Pharmaceuticals, Inc., Cytokinetics, Inc., ITF Pharma, Inc., MT Pharma America, Inc., and Otsuka America, Inc. J. Caress reports grants from NIH, Amylyx Pharmaceuticals Inc., Orion Corporation, Cytokinetics Inc., Flex-Pharma, and Neurology Clinical Research Initiative TCZALS-001, outside the submitted work. J. Katz, Jacob L. McCauley, R. Rademakers, and A. Malaspina report no relevant disclosures. L.W. Ostrow reports grants from The Target ALS Foundation and the ALS Association during the conduct of the study. J. Wuu reports grants and funding from NIH, the ALS Association, the Centers for Disease Control and Prevention, the Department of Defense, and Target ALS during the conduct of the study. Go to Neurology.org/N for full disclosures.
References
- 1.Benatar M. ALS therapy development: challenges and opportunities. J Neuromuscul Dis 2016;3:S10. [Google Scholar]
- 2.van den Berg LH, Sorenson E, Gronseth G, et al. Revised Airlie House consensus guidelines for design and implementation of ALS clinical trials. Neurology 2019;92:e1610–e1623. [DOI] [PMC free article] [PubMed] [Google Scholar]
- 3.Benatar M, Boylan K, Jeromin A, et al. ALS biomarkers for therapy development: state of the field and future directions. Muscle Nerve 2016;53:169–182. [DOI] [PMC free article] [PubMed] [Google Scholar]
- 4.Verde F, Steinacker P, Weishaupt JH, et al. Neurofilament light chain in serum for the diagnosis of amyotrophic lateral sclerosis. J Neurol Neurosurg Psychiatry 2019;90:157–164. [DOI] [PubMed] [Google Scholar]
- 5.Rossi D, Volanti P, Brambilla L, Colletti T, Spataro R, La Bella V. CSF neurofilament proteins as diagnostic and prognostic biomarkers for amyotrophic lateral sclerosis. J Neurol 2018;265:510–521. [DOI] [PubMed] [Google Scholar]
- 6.Gaiani A, Martinelli I, Bello L, et al. Diagnostic and prognostic biomarkers in amyotrophic lateral sclerosis: neurofilament light chain levels in definite subtypes of disease. JAMA Neurol 2017;74:525–532. [DOI] [PMC free article] [PubMed] [Google Scholar]
- 7.Steinacker P, Huss A, Mayer B, et al. Diagnostic and prognostic significance of neurofilament light chain NF-L, but not progranulin and S100B, in the course of amyotrophic lateral sclerosis: data from the German MND-net. Amyotroph Lateral Scler Frontotemporal Degener 2017;18:112–119. [DOI] [PubMed] [Google Scholar]
- 8.Oeckl P, Jardel C, Salachas F, et al. Multicenter validation of CSF neurofilaments as diagnostic biomarkers for ALS. Amyotroph Lateral Scler Frontotemporal Degener 2016;17:404–413. [DOI] [PubMed] [Google Scholar]
- 9.Boylan KB, Glass JD, Crook JE, et al. Phosphorylated neurofilament heavy subunit (pNF-H) in peripheral blood and CSF as a potential prognostic biomarker in amyotrophic lateral sclerosis. J Neurol Neurosurg Psychiatry 2013;84:467–472. [DOI] [PubMed] [Google Scholar]
- 10.Gendron TF, Group CONS, Daughrity LM, et al. Phosphorylated neurofilament heavy chain: a biomarker of survival for C9ORF72-associated amyotrophic lateral sclerosis. Ann Neurol 2017;82:139–146. [DOI] [PMC free article] [PubMed] [Google Scholar]
- 11.Lu CH, Macdonald-Wallis C, Gray E, et al. Neurofilament light chain: a prognostic biomarker in amyotrophic lateral sclerosis. Neurology 2015;84:2247–2257. [DOI] [PMC free article] [PubMed] [Google Scholar]
- 12.Lu CH, Petzold A, Topping J, et al. Plasma neurofilament heavy chain levels and disease progression in amyotrophic lateral sclerosis: insights from a longitudinal study. J Neurol Neurosurg Psychiatry 2015;86:565–573. [DOI] [PMC free article] [PubMed] [Google Scholar]
- 13.McCombe PA, Pfluger C, Singh P, Lim CY, Airey C, Henderson RD. Serial measurements of phosphorylated neurofilament-heavy in the serum of subjects with amyotrophic lateral sclerosis. J Neurol Sci 2015;353:122–129. [DOI] [PubMed] [Google Scholar]
- 14.Poesen K, De Schaepdryver M, Stubendorff B, et al. Neurofilament markers for ALS correlate with extent of upper and lower motor neuron disease. Neurology 2017;88:2302–2309. [DOI] [PubMed] [Google Scholar]
- 15.Boylan K, Yang C, Crook J, et al. Immunoreactivity of the phosphorylated axonal neurofilament H subunit (pNF-H) in blood of ALS model rodents and ALS patients: evaluation of blood pNF-H as a potential ALS biomarker. J Neurochem 2009;111:1182–1191. [DOI] [PubMed] [Google Scholar]
- 16.Lu CH, Petzold A, Kalmar B, Dick J, Malaspina A, Greensmith L. Plasma neurofilament heavy chain levels correlate to markers of late stage disease progression and treatment response in SOD1(G93A) mice that model ALS. PLoS One 2012;7:e40998. [DOI] [PMC free article] [PubMed] [Google Scholar]
- 17.CReATe Biorepository [online]. Available at: rarediseasesnetwork.org/cms/Portals/5/Documents/CReATe%20PGB_Biospecimen%20Collection%20SOP%20website%20based%20on%20v1.4.pdf. Accessed November 2019. [Google Scholar]
- 18.Kuhle J, Barro C, Andreasson U, et al. Comparison of three analytical platforms for quantification of the neurofilament light chain in blood samples: ELISA, electrochemiluminescence immunoassay and Simoa. Clin Chem Lab Med 2016;54:1655–1661. [DOI] [PubMed] [Google Scholar]
- 19.Quanterix. Simoa NF-light [online]. Available at: quanterix.com/sites/default/files/assays/Simoa_NF-light_Data_Sheet_HD-1.pdf. Accessed November 2019. [Google Scholar]
- 20.Quanterix. Simoa pNF-heavy [online]. Available at: quanterix.com/sites/default/files/assays/Simoa%20pNF-heavy%20Discovery%20data%20sheet.pdf. Accessed November 2019. [Google Scholar]
- 21.De Schaepdryver M, Jeromin A, Gille B, et al. Comparison of elevated phosphorylated neurofilament heavy chains in serum and cerebrospinal fluid of patients with amyotrophic lateral sclerosis. J Neurol Neurosurg Psychiatry 2018;89:367–373. [DOI] [PubMed] [Google Scholar]
- 22.Kimura F, Fujimura C, Ishida S, et al. Progression rate of ALSFRS-R at time of diagnosis predicts survival time in ALS. Neurology 2006;66:265–267. [DOI] [PubMed] [Google Scholar]
- 23.Bland JM, Altman DG. Statistical methods for assessing agreement between two methods of clinical measurement. Lancet 1986;1:307–310. [PubMed] [Google Scholar]
- 24.Disanto G, Barro C, Benkert P, et al. Serum neurofilament light: a biomarker of neuronal damage in multiple sclerosis. Ann Neurol 2017;81:857–870. [DOI] [PMC free article] [PubMed] [Google Scholar]
- 25.Kuffner R, Zach N, Norel R, et al. Crowdsourced analysis of clinical trial data to predict amyotrophic lateral sclerosis progression. Nat Biotechnol 2015;33:51–57. [DOI] [PubMed] [Google Scholar]
- 26.Castrillo-Viguera C, Grasso DL, Simpson E, Shefner J, Cudkowicz ME. Clinical significance in the change of decline in ALSFRS-R. Amyotroph Lateral Scler 2010;11:178–180. [DOI] [PubMed] [Google Scholar]
- 27.Thouvenot E, Demattei C, Lehmann S, et al. Serum neurofilament light chain at time of diagnosis is an independent prognostic factor of survival in amyotrophic lateral sclerosis. Eur J Neurol 2020;27:251–257. [DOI] [PubMed] [Google Scholar]
- 28.Weydt P, Oeckl P, Huss A, et al. Neurofilament levels as biomarkers in asymptomatic and symptomatic familial amyotrophic lateral sclerosis. Ann Neurol 2016;79:152–158. [DOI] [PubMed] [Google Scholar]
- 29.Winter B, Guenther R, Ludolph AC, Hermann A, Otto M, Wurster CD. Neurofilaments and tau in CSF in an infant with SMA type 1 treated with nusinersen. J Neurol Neurosurg Psychiatry 2019;90:1068–1069. [DOI] [PubMed] [Google Scholar]
- 30.Darras BT, Crawford TO, Finkel RS, et al. Neurofilament as a potential biomarker for spinal muscular atrophy. Ann Clin translational Neurol 2019;6:932–944. [DOI] [PMC free article] [PubMed] [Google Scholar]
- 31.Benatar M, Wuu J. The challenge of early therapeutic intervention in ALS. Amyotroph Lateral Scler Frontotemporal Degener 2014;15:5. [Google Scholar]
- 32.Benatar M, Wuu J, Andersen PM, Lombardi V, Malaspina A. Neurofilament light: a candidate biomarker of pre-symptomatic ALS and phenoconversion. Ann Neurol 2018;84:130–139. [DOI] [PMC free article] [PubMed] [Google Scholar]
- 33.Benatar M, Wuu J, Lombardi V, et al. Neurofilaments in pre-symptomatic ALS and the impact of genotype. Amyotroph Lateral Scler Frontotemporal Degener 2019;20:538–548. [DOI] [PMC free article] [PubMed] [Google Scholar]
Associated Data
This section collects any data citations, data availability statements, or supplementary materials included in this article.
Data Availability Statement
Deidentified data are available from Dryad (doi.org/10.5061/dryad.ttdz08ktb).


