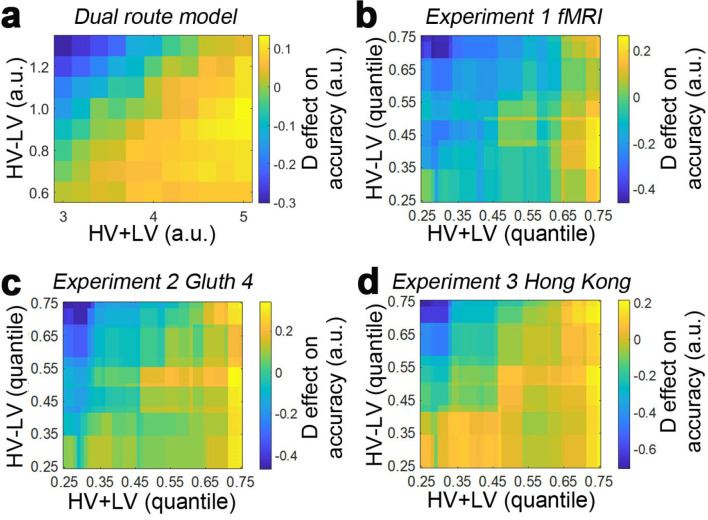
Appendix 3—figure 1. Distractor effects measured across the decision space.
As in Figure 1, the distractor effect (yellow = positive, blue = negative) is plotted across the decision space defined by difficulty (HV-LV) and the total value of the choosable options (HV+LV). Results are shown for (a) the dual route model, (b) Experiment 1 fMRI2014, (c) Experiment 2 Gluth4, (d) Experiment 3 Hong Kong.

