Figure 3. Decision accuracy across the decision space.
Accuracy (light-yellow indicates high accuracy, dark-red indicates low accuracy) is plotted across the decision space defined by decision difficulty (HV-LV) and relative distractor value (D–HV) from (a) Experiment 1 fMRI2014, (c) Experiment 2 Gluth4, (e) Experiment 3 Hong Kong. In the case of each experiment, GLM analysis indicates that similar factors influence accuracy. The difference in value between the better and worse choosable option (HV-LV) is a major influence on accurately choosing the better option HV. However, accurate choice of HV is also more likely when the distractor is high in value (D-HV is high) and this effect is more apparent when the decision is difficult (negative interaction of (HV-LV)(D–HV)) in the data from (b) Experiment 1 fMRI2014, (d) Experiment 2 Gluth4, (f) Experiment 3 Hong Kong. (g) A model comparison shows that participants’ behaviour in Experiments 1 to 3 is best described by the dual route model, as opposed to the null, mutual inhibition, or divisive normalisation models. (h) Posterior probability of each model in accounting for the behaviour of individual participants. Null: null model; Mutual: mutual inhibition model; DivNorm: divisive normalisation model; Dual: dual route model. *p<0.05, **p<0.01, ***p<0.001. (a–f) Error bars indicate standard error. (g–h) Error bars indicate standard deviation.
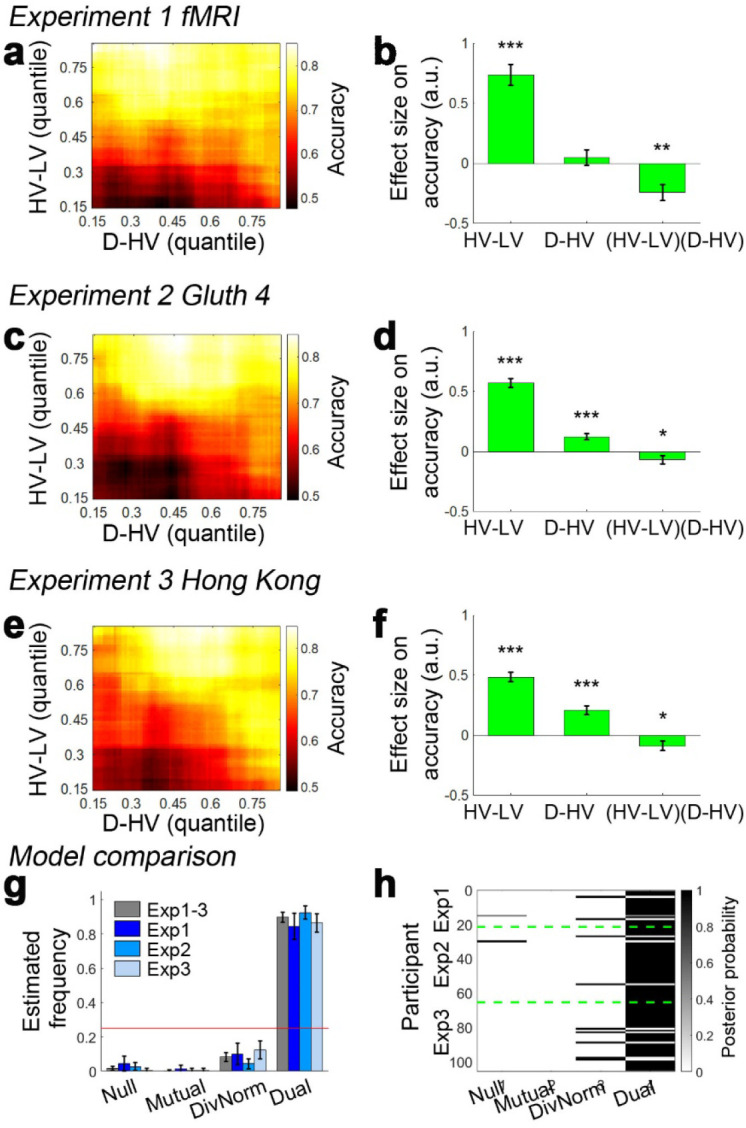
Figure 3—figure supplement 1. A similar (HV-LV)(D–HV) effect was observed when the HV+LV term was added to GLM1a which was done in GLM1b.

Figure 3—figure supplement 2. The dual route model is better than the mutual inhibition, divisive normalisation and null models in predicting participants’ accuracy and reaction time.

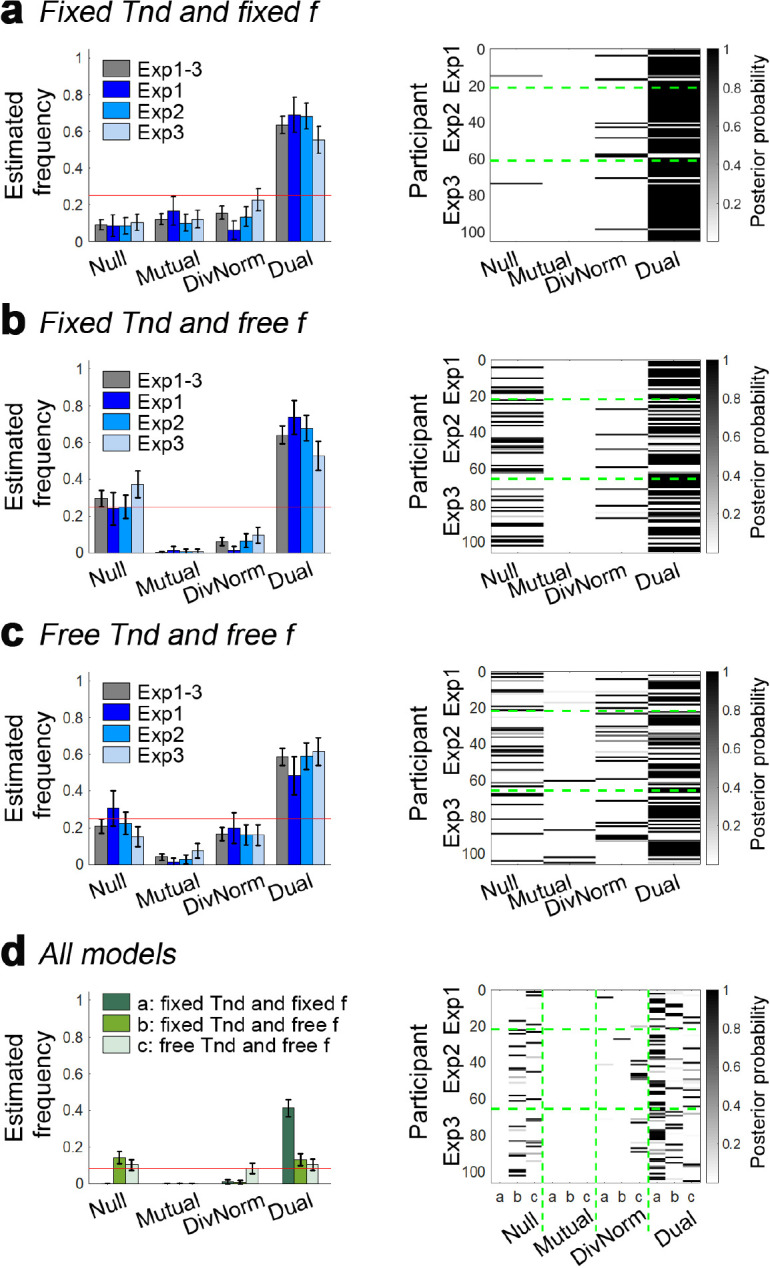
Figure 3—figure supplement 3. The dual route model provides the best account of participants’ behaviour regardless of the parameterisation of non-decision time Tnd and inhibition level f.