Abstract
A series of fluorescent thiazole–pyrazoline derivatives was synthesized and their structures were characterized by 1H NMR, 13C NMR, and HRMS. Biological evaluation demonstrated that these compounds could effectively inhibit the growth of human non-small cell lung cancer (NSCLC) A549 cells in a dose- and time-dependent manner in vitro and inhibit tumor growth in vivo. The structure–activity relationship (SAR) of the compounds was analyzed. Further mechanism research revealed they could induce autophagy and cell cycle arrest while had no influence on cell necrosis. Compound 5e inhibited the activity of mTOR via FKBP12, which could be reversed by 3BDO, an mTOR activator and autophagy inhibitor. Compound 5e inhibited growth, promoted autophagy of A549 cells in vivo. Moreover, compound 5e showed good selectivity with no influence on normal vascular endothelial cell growth and the normal chick embryo chorioallantoic membrane (CAM) capillary formation. Therefore, our research provides potential lead compounds for the development of new anticancer drugs against human lung cancer.
Subject terms: Autophagy, Target identification
Introduction
Cancer is still a major global health concern and a leading cause of death all over the world. It is shown that lung cancer remains the highest death rate in all cancer deaths both in developed and developing countries1. Over the past decades, much attention has been paid to the discovery of effective method to overcome cancer thoroughly. Despite more and more anticancer therapies were developed, chemotherapy is still one of the most common cancer therapies to prolong the lifespan of cancer patients2,3. However, due to side effect and drug resistance, it is an urgent issue to develop novel, selective anticancer agents.
Nevertheless, studying the distribution and targets of anticancer compounds in living cells poses a great challenge for researchers and great help to improve the activity and selectivity. Fluorescigenic small molecules provide a huge boost for determining their location and targets in living cells. Fluorescent compounds have been used as powerful detection tools in cell biology. Currently, due to the nature of high quantum yield and readily synthetic process, some pyrazoline derivatives have been synthesized and used in fluorescence probes, for orientation4, detecting cation5–8, hydrazine9,10, thiols11–13, and DNA14. Moreover, their biological roles have been studied in insecticidal function15–17, human monoamine oxidase activity inhibition18,19, anti-inflammation20–22, antimicrobial23,24, analgesia25. In addition, pyrazoline derivatives could inhibit the proliferation of cancer cells with satisfactory activity26,27. However, the anticancer mechanism was little delineated.
Autophagy, an important process in eukaryotes through which useless organelles were delivered to lysosomes for degradation and reuse, plays double-edged roles in tumor initiation and progression depending on different cell types and specific stages of tumor progression28,29. On the one hand, autophagy deficiency has a positive effect on malignant transformation, indicating autophagy as a tumor suppressor mechanism30,31. On the other hand, excessive autophagy could contribute to cell death in certain cancer cell types which maintained the cellular functions by triggering autophagy32,33. Considering the dual nature of autophagy in tumorigenesis and progression, more modulators of autophagy may provide a powerful tool for cancer therapy.
Mechanistic target of rapamycin (mTOR [serine/threonine kinase]/FK506-binding protein 12-rapamycin associated protein 1), regulates the maintenance of cell homeostasis, including cell growth, autophagy, and cytoskeletal organization34,35. The dysregulated activity of mTOR involved in several human disorders, including cancers, such as lung cancer, breast cancer, and others36. Due to the key role of proliferation in numerous malignant cell types, there were many potential applications in the therapy of various solid tumors and hematological malignancies by targeting the mTOR pathway37,38. However, the expectations of more effective and less toxic treatment with mTOR inhibitors have not realized.
In a continuation of an ongoing program aiming at finding novel fluorescent small molecules with anticancer activity39–41, a series of thiazole–pyrazoline derivatives were synthesized and their properties in A549 cells were evaluated. In this work, deep insights into the antineoplastic activity and mechanism of pyrazoline derivatives were gained to provide a basis for the rational and targetable design of fluorescent anticancer drug for clinical application.
Materials and methods
Reagents and apparatus
All reagents were of analytical grade or chemically pure. Thin-layer chromatography (TLC) was performed on silica gel 60 F254 plates (Merck KGaA) and column chromatography was conducted over silica gel (mesh 200–300). 1H NMR spectra were recorded on a Bruker Avance 400 (400 MHz) spectrometer or Bruker Avance 300 (300 MHz) spectrometer, using DMSO-d6 as solvent and tetramethylsilane as an internal standard. Melting points were determined on an XD-4 digital micro melting point apparatus. IR spectra were recorded with an IR spectrophotometer Avtar 370 FT-IR (Termo Nicolet). MS spectra were recorded on a Trace DSQ mass spectrograph. Unless otherwise stated, all reagents were purchased from J&K, Sinopharm Chemical Reagent Co. and Kermel and used without further purification. Twice-distilled water was used throughout all experiments. Rapamycin was from Calbiochem (Darmstadt, Germany). Chloroquine (CQ) and Bafilomycin-A1 (Baf-A1) were purchased from Sigma-Aldrich (St. Louis, MO, USA).
Preparation of chalcone compounds (3)
In a flask, compound 1 (10 mmol) was dissolved in ethanol (10 ml), and sodium hydroxide solution in water (8 ml, 2.5 M) was added. Then compound 2 dissolved in ethanol (10 ml) was added to the above mixture. After reaction completed (by TLC monitoring), yellow precipitate was filtered, then the solid was washed with water to make pH = 7. The yellow product was dried by infrared lamp to give compound 3 in more than 80% yield.
Preparation of 3,5-diaryl-4,5-dihydro-1H-pyrazole-1-carbothioamide (4)
Thiosemicarbazide (6 mmol), sodium hydroxide (8 mmol), compound 3 and ethanol (30 ml) were added into round-bottom flask. The reaction mixture was refluxed for 3–8 h, it was monitored by TLC until completion. The mixture was cooled to room temperature. Precipitate was filtered, and washed three times with water and ethanol. After dried with infrared lamp, corresponding product 4 was obtained.
Preparation of compound 5
Compound 4 (1 mmol) was added into ethanol (25 ml), then 2-bromo-1-(pyridin-4-yl)ethanone (1 mmol) was added into the mixture. The reaction mixture was refluxed for 4–9 h (monitored by TLC until completion). The mixture was cooled to room temperature and filtered. The solid was washed with ethanol two times. The solid was dissolved in dichloromethane. The mixture was washed with saturated NaHCO3, followed by wash with saturated brine. Organic phase was dried over magnesium sulfate. After desiccant was removed by suction filter, organic phase was concentrated under reduced pressure to give the target products 5. The spectroscopy data of compounds 5a–5j are loaded in the Supplementary file.
Antibodies
Antibody for Light chain 3 beta (LC3B) (2775 S), EIF4EBP1 (9452), p-EIF4EBP1 (9459), RPS6KB1 (9202), p-RPS6KB1 (9205), and p-mTOR (2971) were purchased from CST. Antibody for β-actin (sc-47778), mTOR (sc-8319), FKBP12, and horseradish peroxidase-conjugated secondary antibodies were bought from Santa Cruz. Secondary antibodies for immunofluorescence were donkey anti-rabbit IgG Alexa Fluor-488 (A10040), which was purchased from life technology.
Cell culture
All the cells utilized in the experiment were purchased from the Cell Culture Bank of the Chinese Academy of Sciences (http://www.cellbank.org.cn/). Human lung cancer cell line A549 and H460, human liver carcinoma cell line HepG-2, human hormone-independent prostate carcinoma cell line PC3, human kidney clear cell adenocarcinoma cell line 786-O, human breast carcinoma cell line 4T1, and human renal tubular epithelial cell HK-2 were cultured in RPMI-1640 medium with 10% (v/v) bovine calf serum and 80 U/ml penicillin/streptomycin. Human glioblastoma cells U87 and human embryonic kidney cell 293T were grown in DMEM medium (Gibco, USA) with 10% FBS, penicillin (50 U/ml), and streptomycin (50 ug/mL) (Invitrogen, 10378-016). Human umbilical vein endothelial cells (HUVEC) were grown in M199 medium (Gibco, 31100-035) with 10% (v/v) bovine calf serum and 8.4 IU/mL FGF2. All cell lines were cultured in a humidified incubator with 5% CO2 at 37 °C.
Cell morphology
Morphologic changes of A549 cells treated with compounds at indicated concentration for 12, 24, and 48 h were examined by inverted phase-contrast microscope (Eclipse TS-100; 21 Nikon, Tokyo).
Cell viability assay
Cells were seeded onto 96-well plates for 24 h and then treated with 0.1% DMSO (v/v, as control), 5-fluorouracil (5-FU, as positive group) or compounds 5a–5j at indicated concentrations (0.1, 1, 5, 10 μM) for 24 and 48 h. Cell viability was measured by sulforhodamine B (SRB) assay, in accordance with the previous method42. The intensity of light absorption was measured by using a SpectraMAX190 microplate spectrophotometer (GMI Co, USA) at the wavelength of 540 nm. In some experiments, A549 cells were transfected with siRNAs and/or treated with 5e. A549 cells were exposed to autophagy inhibitors CQ (20 mM) and Baf-A1 (50 nM) for 2 h before treatment with 5e.
Lactate dehydrogenase (LDH) assay
Cell culture medium was gathered after 24-h treatment with compounds 5a–5j (10 μM) or 0.1% DMSO (as control). LDH assay was conducted by using a LDH kit (Nanjing Jiancheng Co, China), according to the manufacturer’s description.
Co-localization imaging of cells
A549 cells were incubated with 5e (1 μM) for 1 h at 37 °C. Then, MitoTracker Deep Red (0.1 μM), Lyso Sensor Green (0.3 μM), and ER Tracker Red (0.3 μM) were added and incubated for another 0.5 h and the confocal fluorescent images were captured.
Western blot analysis
Total proteins were obtained from A549 by using IP lysis buffer (Shanghai beyotime Co., China) after different treatment. Cells were washed twice with ice-cold phosphate-buffered saline (PBS), then lysed in protein lysis buffer (Shanghai beyotime Co., China). The protein concentration of the cells was measured by the Bradford method. Following separation by SDS-PAGE and transferring to PVDF membrane (Millipore, USA), proteins were incubated with primary antibodies, then incubated with horseradish peroxidase-linked secondary antibodies, and finally probed by using an enhanced chemiluminesence detection kit (Thermo). Actin β was used as a loading control. The relative quantity of proteins was analyzed by Image J software and normalized to loading controls.
RNA interference
A549 cells were transiently transfected with siRNA duplex oligonucleotides targeting LC3B (GenePharmcon, Shanghai, China) using Lipofectamine 2000 (Invitrogen, 11668-019). After 24-h transfection, cell lysates were subjected for the western blot assay and cells were treated with 5e or vehicle for an additional 24 h. Cell viability was determined as described above. FKBP12 siRNA (sc-35678) and scramble RNA (sc-37007) were obtained from Santa Cruz Biotechnology. A549 cells at 50–60% confluence were transfected with 60-nM siRNA against FKBP25, FKBP12, and scramble siRNA with Lipofectamine 2000 according to the manufacturer’s instructions. Then cells were harvested and analyzed by western blot.
Flow cytometric analysis of cell cycle distribution
Following treated with compounds 5a, 5d, 5e, 5g and 5h (10 μM) for 48 h, A549 cells were harvested and fixed with 70% ice-cold ethanol, then stained with 50 mg/ml propidium iodide containing 10 mg/ml RNase A at 4 °C for 10 min. The stained cells were analyzed by using a flow cytometer (ImageStreamX MarkII, Amnis, USA). The cell cycle distribution was analyzed by IDEAS software (Amnis, USA).
Immunofluorescence assay
Treated cells were fixed in 4% paraformaldehyde (w/v) for 30 min at room temperature and then incubated with normal donkey serum (1:30) for 30 min and primary antibodies (1:100) overnight at 4 °C. Cells were washed with PBS times, and then three incubated with secondary antibodies (1:200) for 1 h at 37 °C. Fluorescence was detected by laser scanning confocal microscopy Zeiss LSM700 (Germany). Frozen sections of tumors formed on the chick embryo chorioallantoic membrane (CAM) were fixed with cold acetone for 10 min and blocked with 10% normal donkey serum (Solarbio, SL050) for 30 min at room temperature. Then frozen sections of tumors were incubated with primary antibody (1:100; LC3B, Rabbit polyclonal antibody, Santa Cruz Biotechnology) at 4 °C overnight and then corresponding secondary antibody (1:200) at 37 °C for 1 h. Frozen sections of tumors were washed three times with 0.1-M PBST. DAPI (1:200) was added to stain cell nucleus for 10 min and then the sections were washed three times with PBS. Fluorescence was detected by confocal fluorescence microscopy Zeiss LSM700 (Germany).
Chick embryo CAM assay
Fertile chicken eggs (7–9 days old) were used to conduct the CAM assay. An amount of (1–10) × 106 A549 cells suspended in 20-μL RPMI-1640 was engraftment on the CAM. Next, the egg shell was sealed with gas-permeable tape to avoid bacterial infection for another two days. Then, the eggs were treated with PBS (negative control, qod × 3), the compound 5e (25 and 50 μM, qod × 3) or 5-Fu (50-μM positive group, qod × 3). After fixed by 4% paraformaldehyde for 30 min, CAMs were separated from the eggs and photographed by a stereomicroscope (Japan).
Angiogenesis assay of CAM in vivo
Fertilized chicken eggs were incubated with 55% relative humidity at 37 °C. On embryonic day 7 or 8, 5e (25 and 50 μM) soaked in the gelatin sponge was applied to the CAM and DMSO as the vehicle control for 48 h. Then, repeated the above operation for three times. At the end of the incubation, after fixed by 4% paraformaldehyde for 30 min, the CAM zones around the gelatin sponge were photographed and analyzed by using the Image-Pro Plus.
Statistical analyses
Data were presented as means ± SE and analyzed by SPSS software. Pictures were processed with Photoshop software. Mean values were derived from at least three independent experiments. Differences at p < 0.05 were considered statistically significant.
Results
Chemistry
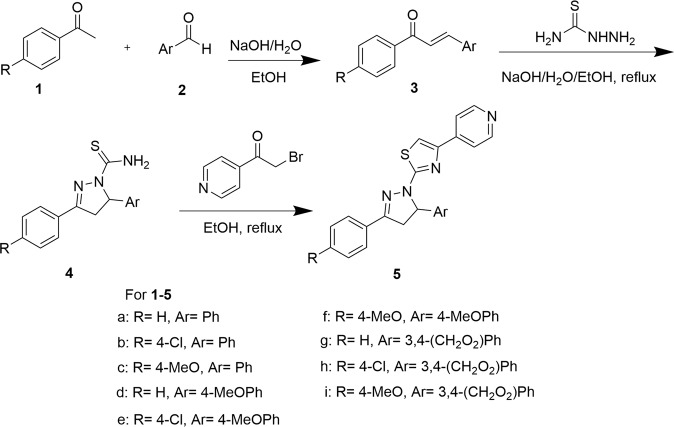
The synthetic route of compounds 5a–5j has been accomplished as shown in Scheme 143. An aryl aldehyde (1) reacted with an aryl methyl ketone (2) to give a chalcone (3). The chalcone (3) reacted with thiosemicarbazide to afford 3,5-diaryl-4,5-dihydro-1H-pyrazole-1-carbothioamide (4). Compound 4 reacted with 2-bromo-1-(pyridin-4-yl)ethanone to produce target products, 2-(3,5-diaryl-4,5-dihydro-1H-pyrazol-1-yl)-4-(pyridin-4-yl)thiazole (5).
Scheme 1.
Synthesis of compounds 5a–5j.
In vitro antiproliferative activity and structure–activity relationship (SAR) study
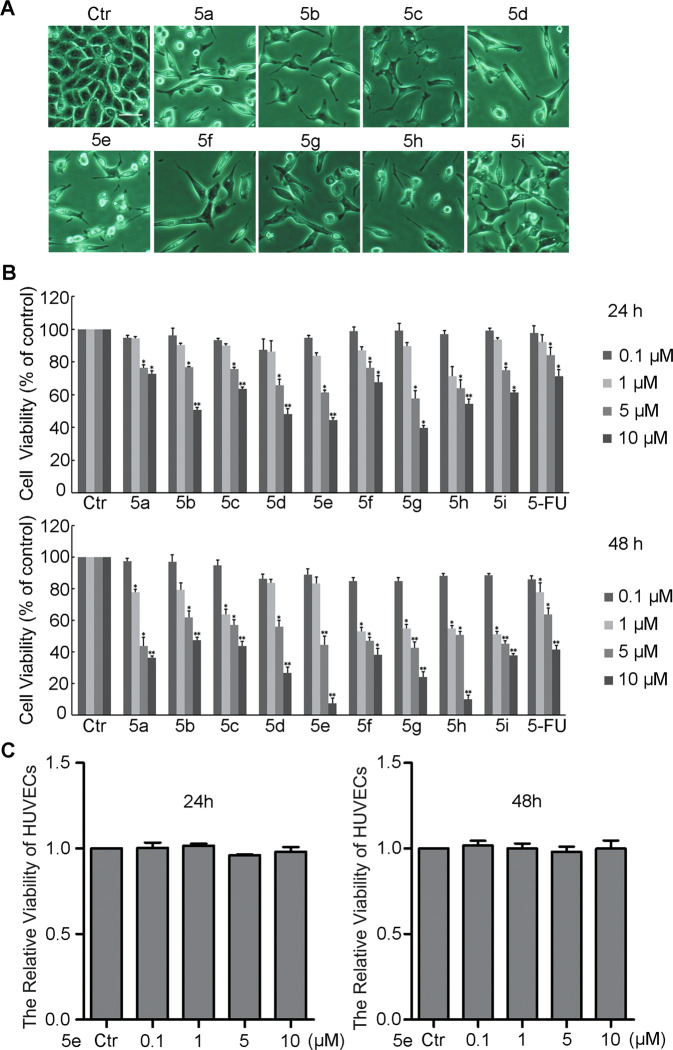
In order to examine the anticancer activity of compounds 5a–5j, we firstly observed the morphological changes of A549 cells treated for 12, 24, or 48 h by a phase-contrast microscope. The data showed obvious morphological changes in A549 cells treated with the compounds 5a–5j in dose- and time-dependent manners (Fig. S1). Compared with control group, the cell density dramatically decreased and cells were elongated or formed triangle and arborization significantly treated for 48 h (Fig. 1a, an excerpt of Fig. S1). SRB assay was conducted to investigate the effect of these compounds on cell proliferation. The data indicated that these compounds suppressed the growth of A549 cells in a dose-dependent manner after treatment with the compounds for 24 and 48 h (Fig. 1b). The IC50 (μM) values of the compounds were totally <10 μM (Table 1). Our finding demonstrated that all tested derivatives exhibited considerable cell growth inhibition on A549 cells. Furthermore, we explored the inhibitory effect of compound 5e on human cancer cells lines H460, HepG-2, PC3, 786-O, 4T1, J82, and human nontumorigenic cell lines HK-2 and 293T. As shown in Table S1, compound 5e also exhibited obvious growth inhibiting activity against other cancer cell lines, but did not inhibit the growth of normal cell lines. 5e had no influence on the growth of HUVECs (Fig. 1c), indicating that this compound showed good selectivity.
Fig. 1. The viability of cells incubated with compounds 5a–5i.
a Effects of compounds 5a–5i at 10 μM on changes in cell morphology for 48 h (100×). These images were re-used from Fig. S1. b Effects of compounds 5a–5i on cell viability assessed by sulforhodamine B for 24 and 48 h. c The effect of compound 5e on HUVECs cell viability assessed by sulforhodamine B for 24 and 48 h. Results were presented as mean ± SE; n = 3; *p < 0.05; **p < 0.01. Bar = 20 μm.
Table 1.
Growth inhibitory properties (IC50, 48 h) of compounds 5a–5i and 5-FU in A549 cells. Results are mean ± SEM.
| Compounds | IC50 (μM) | Compounds | IC50 (μM) |
|---|---|---|---|
| 5-FU | 9.4 ± 0.23 | 5e | 2.6 ± 0.11 |
| 5a | 4.4 ± 0.12 | 5f | 2.9 ± 0.09 |
| 5b | 8.7 ± 0.15 | 5g | 1.8 ± 0.08 |
| 5c | 6.0 ± 0.08 | 5h | 1.8 ± 0.05 |
| 5d | 4.7 ± 0.12 | 5i | 2.7 ± 0.36 |
Further, based on the above results, the SAR of the compounds was analyzed. The antiproliferative activity of these compounds are mainly affected by aryl group in 5 position of pyrazoline moiety. When substituent Ar is benzo[d][1,3]dioxol-5-yl (compounds 5g–5i), the inhibition effect for cell growth is stronger. When Ar is 4-methoxyl phenyl (5d–5f), compounds have also a higher growth inhibitory effect. However, in the case of Ar is phenyl, antitumor activity is poorer. Taken together, compounds 5g, 5h were the most effective compounds in suppressing A549 cell growth.
Continuous proliferation is the hallmark of cancer cells. Because regulation of the cell cycle is critical for cell growth, we investigated the effect of compounds 5 on cell cycle progression using flow cytometry. The results showed that compounds 5a, 5d, 5e, 5g, or 5h effectively arrested the cell cycle at the G1 phase at the concentration of 10 μM for 48 h, which were in accordance with the growth inhibitory effect of these compounds. Notably, treatment with 5e enhanced the G1 population by 33.8% (Fig. S2A). Necrosis, an unwanted side effect of cancer-fighting agents, could be evaluated by the LDH assay. LDH assay was performed on cells treated with the compounds and 0.1% DMSO. Our data revealed that these compounds had no influence on the release of LDH (Fig. S2B).
Compound 5e distributed in lysosome in A549 cells
Given these compounds containing fluorescent group, we detected the fluorescence in A549 cells by a fluorescent microscope. The data indicated that these compounds have good excellent water-solubility and membrane permeability, especially compound 5e had good fluorescence at 0.1 μM (Fig. S3). Combining with 5e showed good cell growth inhibition activity and high selectivity, this compound was chosen for further mechanism research.
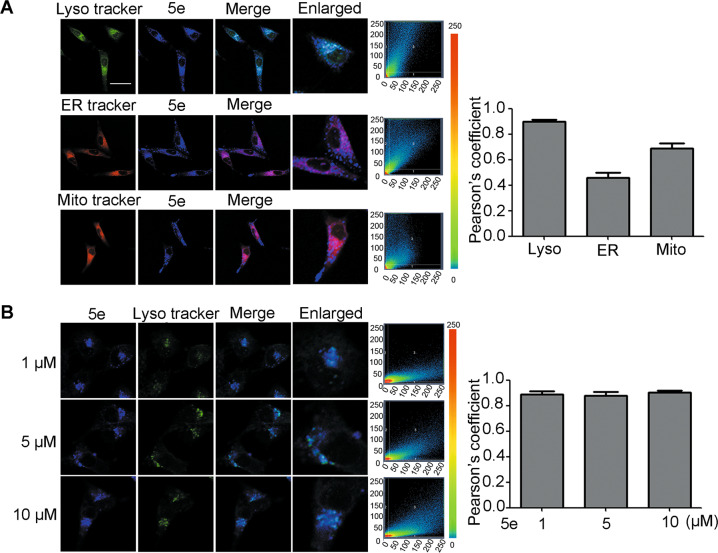
First, the intracellular distribution of compound 5e in A549 cells was explored according to good fluorescence. We used commercial lysosome probe (Lyso Sensor Green), mitochondria probe (mitochondria Deep Red), and endoplasmic reticulum probe (ER red) to co-stain A549 cells. The result showed that compound 5e had good co-localization with lysosome (Pearson’s coefficient 0.903), but poor with mitochondria (Pearson’s coefficient 0.563) or endoplasmic reticulum (Pearson’s coefficient 0.733) (Fig. 2a), implying a preferential distribution of compound 5e in lysosome. Furthermore, the concentration of compound 5e had no significant effect on its cellular distribution (Fig. 2b).
Fig. 2. The distribution of compound 5e in A549 cells.
a A549 cells were treated with 10-μM compound 5e, followed by MitoTracker Deep Red (0.1 μM, 0.5 h), Lyso Sensor Green (0.3 μM, 0.5 h), or ER Tracker Red (0.3 μM, 0.5 h). The average Pearson’s coefficient was shown in bar chart. Compound 5e: λex = 405 nm, λem = 405–490 nm. MitoTracker Deep Red: λex = 635 nm, λem = 635–700 nm. Lyso Sensor Green: λex = 488 nm, λem = 488–700 nm. ER Tracker Red: λex = 555 nm, λem = 555–700 nm. b A549 cells were treated by 1 μM, 5 μM, or 10 μM compound 5e for 24 h, then, incubated with Lyso Sensor Green (0.3 μM, 0.5 h). The average Pearson’s coefficient was shown in bar chart. Compound 5e: λex = 405 nm, λem = 405–490 nm. Lyso Sensor Green: λex = 488 nm, λem = 488–700 nm (200×). X-axis means mean intensity of compound 5e and y-axis means mean intensity of different trackers. Numbers 1 and 2 mean respective regions and 3 means colocation region. Bar = 10 μm.
Compound 5e induced autophagy of A549 cells
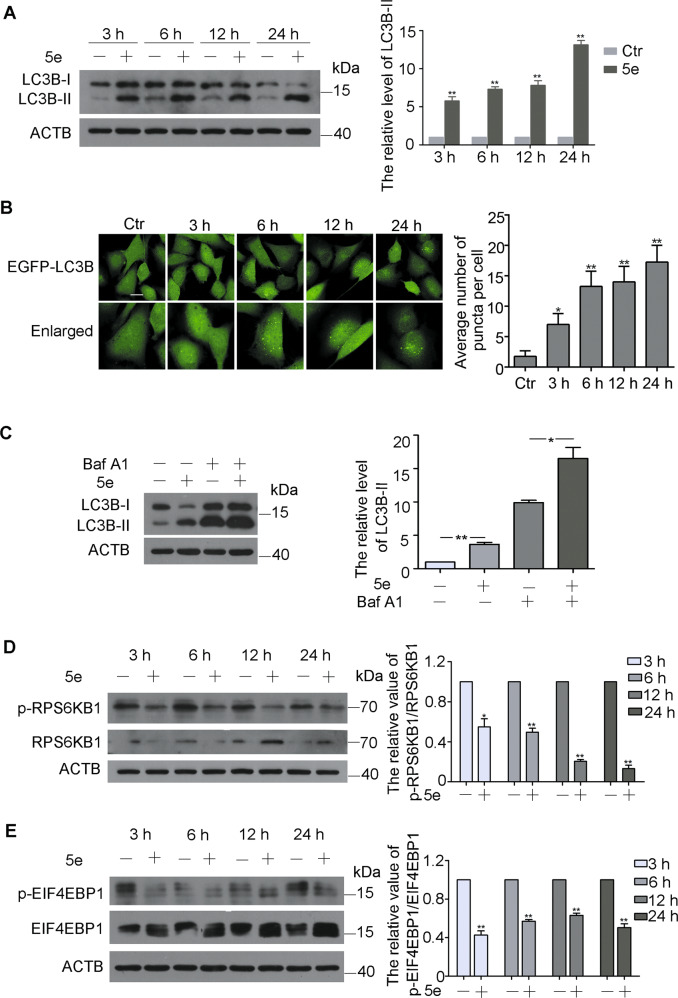
Autophagy is a highly conserved lysosomal degradation pathway in which unnecessary byproducts and damaged organelles are engulfed into double-membrane vesicles termed autophagosomes and transported to lysosomes44,45. Due to compound 5e located in lysosomes, we investigated the effect of this compound on autophagy. LC3B, an autophagy maker, was monitored by western blotting. The result showed that the levels of LC3B-II were enhanced after incubation with 5e at 10 μM for 3, 6, 12 and 24 h, indicating compound 5e induced autophagy in a time-dependent manner (Fig. 3a). Moreover, autophagic LC3B-II accumulation was dramatically enhanced in stably expressing EGFP-LCB3 U87 cells in a time-dependent manner (Fig. 3b). Actually, all other compounds could also induce autophagy (Fig. S4). In order to demonstrate whether compound 5e could induce intact autophagy flux, Baf-A1, a recognized inhibitor of vacuolar H+-ATPase, was used to block autophagy. As shown in Fig. 3c, treatment with compound 5e further enhanced the accumulation of LC3B-II induced by Baf-A1, implying that compound 5e could induce complete autophagy flux. To assess the impact of autophagic flux in 5e-induced cell death, we analyzed cell viability and cell death by pretreating A549 cells with autophagy inhibitors, chloroquine, and Baf-A1. The results showed that these two inhibitors both could increase the cell viabilities compared with cells treated with 5e solely (Fig. S5A,B). We further confirmed the role of autophagic flux in the action of 5e by knockdown of specific autophagy-related LC3B gene. Reduction of LC3B by siRNA significantly alleviated cytotoxic activity of 5e (Fig. S5C,D). Taken together, our data clearly demonstrated that 5e activated an autophagic flux and promoted autophagy-dependent cell death. Compound 5e had no influence on the growth of HUVECs and could not induce autophagy in HUVECs (Fig. S6).
Fig. 3. Compound 5e induced autophagy in a mTOR-dependent manner.
a Western blot analysis of LC3B-I and LC3B-II in A549 cells treated with compound 5e at 10 μM for indicated times and quantification of LC3B-II levels. b Images of EGFP-LC3B U87 cells were treated with compound 5e at the concentration of 10 μM for 3, 6, 12, and 24 h (200×) and quantification of EGFP-LC3B dots. Bar = 10 μm. c Western blot analysis of LC3B-I and LC3B-II in A549 cells treated with compound 5e (10 μM), Baf-A1 (50 nM), or both for 12 h and quantification of LC3B-II levels. d Western blot analysis of RPS6KB1 and p-RPS6KB1 (S424/T421) in A549 cells treated with compound 5e at 10 μM for indicated times and quantification. e Western blot analysis of EIF4EBP1 and p-EIF4EBP1 (S65/T70) in A549 cells treated with 5e at 10 μM for indicated times and quantification. β-actin was used as a loading control. Results were presented as mean ± SE; n = 3; *p < 0.05; **p < 0.01.
mTOR is a crucial molecular during the process of autophagy. To understand whether compound 5e can suppress the activity of mTOR, we examined the influence of compound 5e on the phosphorylation of RPS6KB1 (ribosomal protein S6 kinase, 70 kDa, polypeptide 1) and EIF4EBP1 (eukaryotic translation initiation factor 4E-binding protein 1), two essential substrates of mTOR36,37. Obviously, the levels of phosphorylation of RPS6KB1 and EIF4EBP1 were significantly decreased after treatment with compound 5e for 3, 6, 12 and 24 h (Fig. 3d, e). The levels of p-mTOR and mTOR were detected by immunofluorescence staining based on the fluorescence characteristics of compound 5e. The data showed that 5e could reduce the phosphorylation of mTOR (Fig. S7). Therefore, compound 5e might induce autophagy in an mTOR-dependent manner.
Compound 5e targeted to FKBP12 and inhibited mTOR
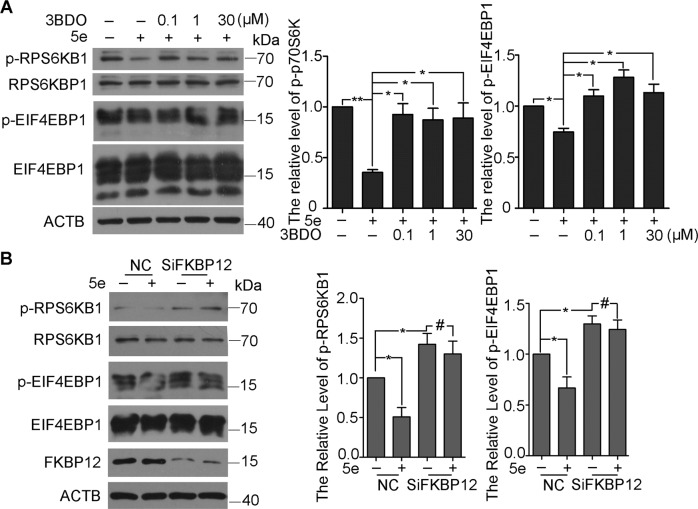
3-Benzyl-5-((2-nitrophenoxy)methyl)-dihydrofuran-2(3H)-one (3BDO), which was found by our group, could activate mTOR by targeting FKBP12 (FK506-binding protein 1A)46. To understand how 5e inhibited mTOR, we examined the effect of 5e on RPS6KB1 and 4EBP1 phosphorylation in the presence or absence of 3BDO. As expected, levels of p-RPS6KB1 and p-EIF4EBP1 were decreased with 5e; however, 5e failed to decrease the phosphorylation of RPS6KB1 and EIF4EBP1 in the presence of 3BDO (Fig. 4A). Accordingly, the mTOR inhibition of 5e was reversed by 3BDO. Then, SiFKBP12 was used to investigate the molecule target of 5e. The interference efficiency of SiFKBP12 was 56% in 60 nM (Fig. S8). As shown in Figs. 4b and 5e could not inhibit the activity of mTOR when FKBP12 was knockdown. These results demonstrated that 5e inhibited the activity of mTOR via FKBP12.
Fig. 4. Compound 5e inhibited mTOR activity via FKBP12.
Western blot analysis of RPS6KB1, p-RPS6KB1, EIF4EBP1, and p-EIF4EBP1. a A549 cells were treated with compound 5e at indicated concentrations for 6 h along with pretreatment of 3BDO or not. The pretreatment time of 3BDO was 3 h and the concentration were 0.1, 1, and 30 μM respectively. b A549 cells were treated with compound 5e for 6 h in 10 μM solely or along with SiFKBP12 in 60 nM for 24 h. β-actin was used as a loading control. Results were presented as mean ± SE; n = 3; *p < 0.05; **p < 0.01.
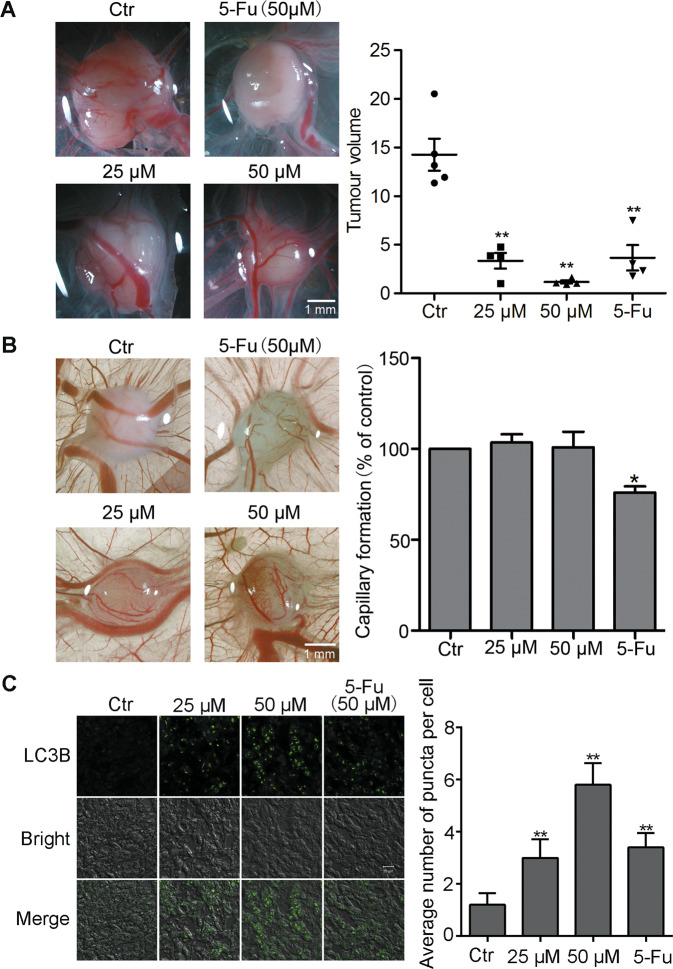
Fig. 5. Compound 5e inhibited the growth of tumor in vivo.
a Biomicroscopy imaging of control and treated tumors. Bar = 1 mm. b Biomicroscopy and quantification of capillary formation with and without compound 5e and 5-Fu treatment on gelatin sponge. Bar = 1 mm. c Immunofluorescence of LC3B-II in the frozen sections of day 6 experimental tumors. Bar = 20 μm. Results were presented as mean ± SE; n = 3; *p < 0.05, **p < 0.01.
Compound 5e inhibited tumor growth in vivo
Given compound 5e effectively inhibited the growth of A549 cell and did not influence the growth of HUVECs in vitro (Fig. 1c), we chose the chick embryo CAM model for further research to evaluate the antitumor effect of 5e. The chick embryo CAM is extensively used for tumor engraftment to evaluate the efficacy of anticancer drugs due to its immune-deficient environment47. As shown in Fig. 5a, compared with the DMSO-treated eggs, significant xenograft tumor remission was observed after 6 days in eggs treated with compound 5e. Notably, compound 5e exerted a better antitumor effect than the therapeutic drug 5-Fu. We further detected that compound 5e had no significant toxicity on angiogenesis in vivo in contrast with 5-Fu which suppressed capillary formation (Fig. 5b). Therefore, 5e effectively inhibited tumor growth in vivo without adverse effect on normal CAM angiogenesis.
Compound 5e induced A549 cells autophagy in vivo
To further investigate the mechanism by which compound 5e inhibited tumor growth in vivo, we prepared frozen sections of solid tumors formed on CAM. Immunofluorescence experiment was performed on frozen sections of tumor. Data showed that compound 5e elevated the level of LC3B-II in tumor tissue, which was in accordance with the results in vitro (Fig. 5c). These data demonstrated that 5e inhibited lung cancer growth through inducing autophagy in vivo.
Discussion
Due to the painful side effects of chemotherapeutic drugs, it is necessary for researchers to improve the selectivity of drugs. Understanding the distribution and target of drugs could be very helpful in improving selectivity. In this study, a series of novel fluorescent compounds were synthesized though sample synthesis steps with high yield. The antiproliferative activity of these compounds against was examined. The results showed that they all showed excellent ability compared with 5-FU. Further SAR analysis showed that the antiproliferative activity of these compounds were mainly affected by aryl group in 5 position of pyrazoline moiety. Further mechanism studied showed that these compounds could arrest cell cycle at the G1 phase and had no influence on cell necrosis.
Using its own fluorescence characteristics, our study found that compound 5e could selectively accumulate in lysosome. Lysosome decomposition is a very important step of autophagy48. Autophagy is an indispensable cellular process for protein and organelle quality control. Autophagy is a double-edged sword. Moderate autophagy could promote cell survival, while excessive autophagy could induce cell death28,49. Previous studies have indicated that autophagy suppression may be a therapeutic strategy for cancer treatment29,50,51. We found that these compounds could induce autophagy and complete autophagy flux.
mTOR has an essential role in different tissues and cells. As mTOR-mediated signaling associated with many diseases, pharmacological agents that modulate mTOR signaling could be helpful in improving many diseases52. mTOR also plays an important role in autophagy53. In this study, phosphorylation of RPS6KB1 and EIF4EBP1 was significantly decreased by 5e, which could be reversed by 3BDO, an mTOR activator, and autophagy inhibitor. 5e failed to decrease the phosphorylation of RPS6KB1 and EIF4EBP1 when FKBP12 was knockdown. Accordingly, we demonstrated that 5e inhibited mTOR though targeting FKBP12 (Fig. 6). FKBP12 targets mTOR in complex with rapamycin54. 3BDO could dock on FKBP12 in the same sites (TYR82A and ILE56A) as rapamycin46. The structure of 5e is different with 3BDO, so we deduced that 5e might occupy rapamycin binding sites more easily than 3BDO.
Fig. 6. The mechanism of compound 5e in inhibiting cancer cell survival.
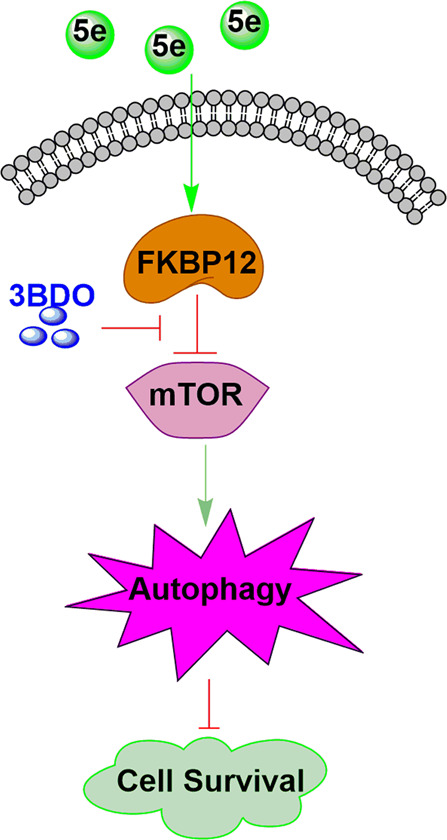
In A549 cells, compound 5e can inhibit the activity of mTOR via FKBP12, which could be reversed by 3BDO. Then autophagy was induced and cellsurvival was inhibited.
CAM model was chosen for further research to evaluate the antitumor effect of 5e in vivo. Our results showed 5e significantly inhibited tumor growth compared with 5-FU and showed no adverse influence of angiogenesis. Immunofluorescence experiment demonstrated that 5e inhibited lung cancer growth through inducing autophagy in vivo.
In conclusion, we found a series of fluorescent thiazole–pyrazoline derivatives, which could inhibit the growth of A549 cells in vitro and inhibit tumor growth in vivo. Compound 5e induced autophagy though inhibiting the activity of mTOR via FKBP12, which could be reversed by 3BDO, an mTOR activator and autophagy inhibitor. Moreover, compound 5e showed no adverse influence of normal cells and angiogenesis. Therefore, our research provides potential lead compounds for the development of new anticancer drugs against human lung cancer.
Supplementary information
Acknowledgements
This work was supported by the National Natural Science Foundation of China (81502948, 31871407, 31741083, and 31870831) and Natural Science Foundation of Shandong Province (2018GSF118201).
Conflict of interest
The authors declare that they have no conflict of interest.
Footnotes
Edited by M Hamasaki
Publisher’s note Springer Nature remains neutral with regard to jurisdictional claims in published maps and institutional affiliations.
Supplementary information
Supplementary Information accompanies this paper at (10.1038/s41419-020-02746-w).
References
- 1.Torre LA, et al. Global cancer statistics, 2012. CA- Cancer J. Clin. 2015;65:87–108. doi: 10.3322/caac.21262. [DOI] [PubMed] [Google Scholar]
- 2.Hanahan D, Weinberg RA. Hallmarks of cancer: the next generation. Cell. 2011;144:646–674. doi: 10.1016/j.cell.2011.02.013. [DOI] [PubMed] [Google Scholar]
- 3.Keefe DMK, Bateman EH. Tumor control versus adverse events with targeted anticancer therapies. Nat. Rev. Clin. Oncol. 2012;9:98–109. doi: 10.1038/nrclinonc.2011.192. [DOI] [PubMed] [Google Scholar]
- 4.Eisinger J, Boens N, Flores J. Fluorescence polarization study of human erythrocyte membranes with 1-phenyl-3-(2-naphthyl)-2-pyrazoline as orientational probe. Biochim. Biophys. Acta. 1981;646:334–343. doi: 10.1016/0005-2736(81)90340-0. [DOI] [PubMed] [Google Scholar]
- 5.Li MM, Zhao WB, Zhang TT. A new thiophenyl pyrazoline fluorescent probe for Cu2+ in aqueous solution and imaging in live cell. J. Fluoresc. 2013;23:1263–1269. doi: 10.1007/s10895-013-1259-x. [DOI] [PubMed] [Google Scholar]
- 6.Ahmed M, Hameed S, Ihsan A, Naseer MM. Fluorescent thiazol-substituted pyrazoline nanoparticles for sensitive and highly selective sensing of explosive 2,4,6-trinitrophenol in aqueous medium. Sens. Actuat. B-Chem. 2017;248:57–62. [Google Scholar]
- 7.Bozkurt E, Gul HI. A novel pyrazoline-based fluorometric “turn-off” sensing for Hg2+ Sens. Actuat. B-Chem. 2018;255:814–825. [Google Scholar]
- 8.Xia S, et al. A novel sensitive fluorescent turn-on probe for rapid detection of Al3+ and bioimaging. RSC Adv. 2015;5:5244–5249. [Google Scholar]
- 9.Wang L, et al. A novel pyrazoline-based fluorescent probe for detection of hydrazine in aqueous solution and gas state and its imaging in living cells. Sens. Actuat. B-Chem. 2016;229:441–452. [Google Scholar]
- 10.Zheng XX, et al. Novel pyrazoline-based selective fluorescent probe for the detection of hydrazine. Spectrochim. Acta A Mol. Biomol. Spectrosc. 2015;138:247–251. doi: 10.1016/j.saa.2014.11.045. [DOI] [PubMed] [Google Scholar]
- 11.Zhang RR, et al. Novel pyrazoline-based fluorescent probe for detecting thiols and its application in cells. Spectrochim. Acta A Mol. Biomol. Spectrosc. 2015;137:450–455. doi: 10.1016/j.saa.2014.08.108. [DOI] [PubMed] [Google Scholar]
- 12.Wang SQ, et al. Novel pyrazoline-based fluorescent probe for detecting glutathione and its application in cells. Biosens. Bioelectron. 2014;55:386–390. doi: 10.1016/j.bios.2013.12.047. [DOI] [PubMed] [Google Scholar]
- 13.Tan JL, et al. A novel “off–on” colorimetric and fluorescent rhodamine-based pH chemosensor for extreme acidity. Spectrochim. Acta A Mol. Biomol. Spectrosc. 2015;140:489–494. doi: 10.1016/j.saa.2014.12.110. [DOI] [PubMed] [Google Scholar]
- 14.Li J, Li D, Han Y, Shuang S, Dong C. Synthesis of 1-phenyl-3-biphenyl-5-(N-ethylcarbazole-3-yl)-2-pyrazoline and its use as DNA probe. Spectrochim. Acta A Mol. Biomol. Spectrosc. 2009;73:221–225. doi: 10.1016/j.saa.2009.01.019. [DOI] [PubMed] [Google Scholar]
- 15.Silver KS, Soderlund DM. Differential sensitivity of rat voltage-sensitive sodium channel isoforms to pyrazoline-type insecticides. Toxicol. Appl. Pharmacol. 2006;214:209–217. doi: 10.1016/j.taap.2005.12.018. [DOI] [PubMed] [Google Scholar]
- 16.Zhao PL, et al. Synthesis, fungicidal, and insecticidal activities of beta-methoxyacrylate-containing N-acetyl pyrazoline derivatives. J. Agric. Food Chem. 2008;56:10767–10773. doi: 10.1021/jf802343p. [DOI] [PubMed] [Google Scholar]
- 17.Silver K, Soderlund DM. State-dependent block of rat Nav1.4 sodium channels expressed in xenopus oocytes by pyrazoline-type insecticides. Neurotoxicology. 2005;26:397–406. doi: 10.1016/j.neuro.2005.03.001. [DOI] [PubMed] [Google Scholar]
- 18.Mishra N, Sasmal D. Development of selective and reversible pyrazoline based MAO-B inhibitors: virtual screening, synthesis and biological evaluation. Bioorg. Med. Chem. Lett. 2011;21:1969–1973. doi: 10.1016/j.bmcl.2011.02.030. [DOI] [PubMed] [Google Scholar]
- 19.Chimenti F, et al. Synthesis and inhibitory activity against human monoamine oxidase of N1-thiocarbamoyl-3,5-di(hetero)aryl-4,5-dihydro-(1H)-pyrazole derivatives. Eur. J. Med. Chem. 2010;45:800–804. doi: 10.1016/j.ejmech.2009.11.003. [DOI] [PubMed] [Google Scholar]
- 20.Rathish IG, et al. Synthesis and antiinflammatory activity of some new 1,3,5-trisubstituted pyrazolines bearing benzene sulfonamide. Bioorg. Med. Chem. Lett. 2009;19:255–258. doi: 10.1016/j.bmcl.2008.10.105. [DOI] [PubMed] [Google Scholar]
- 21.Chirumarry S, et al. Design, synthesis and surfactant properties of perfluorobutyl-based fluorinated sodium alkanesulfonates. J. Fluor. Chem. 2017;197:111–117. [Google Scholar]
- 22.Sharma PK, et al. Synthesis and biological evaluation of some pyrazolylpyrazolines as anti-inflammatory-antimicrobial agents. Eur. J. Med. Chem. 2010;45:2650–2655. doi: 10.1016/j.ejmech.2010.01.059. [DOI] [PubMed] [Google Scholar]
- 23.Hu L, et al. Synthesis and antibacterial activity of C-12 pyrazolinyl spiro ketolides. Eur. J. Med. Chem. 2010;45:5943–5949. doi: 10.1016/j.ejmech.2010.09.060. [DOI] [PubMed] [Google Scholar]
- 24.Siddiqui ZN, Musthafa TN, Ahmad A, Khan AU. Thermal solvent-free synthesis of novel pyrazolyl chalcones and pyrazolines as potential antimicrobial agents. Bioorg. Med. Chem. Lett. 2011;21:2860–2865. doi: 10.1016/j.bmcl.2011.03.080. [DOI] [PubMed] [Google Scholar]
- 25.Marella A, et al. Pyrazolines: a biological review. Mini-Rev. Med. Chem. 2013;13:921–931. doi: 10.2174/1389557511313060012. [DOI] [PubMed] [Google Scholar]
- 26.Altintop MD, et al. A novel series of thiazolyl-pyrazoline derivatives: synthesis and evaluation of antifungal activity, cytotoxicity and genotoxicity. Eur. J. Med. Chem. 2015;92:342–352. doi: 10.1016/j.ejmech.2014.12.055. [DOI] [PubMed] [Google Scholar]
- 27.Yang W, et al. Design, modification and 3D QSAR studies of novel naphthalin-containing pyrazoline derivatives with/without thiourea skeleton as anticancer agents. Bioorg. Med. Chem. 2013;21:1050–1063. doi: 10.1016/j.bmc.2013.01.013. [DOI] [PubMed] [Google Scholar]
- 28.Mizushima N, Komatsu M. Autophagy: renovation of cells and tissues. Cell. 2011;147:728–741. doi: 10.1016/j.cell.2011.10.026. [DOI] [PubMed] [Google Scholar]
- 29.Fulda S, Kogel D. Cell death by autophagy: emerging molecular mechanisms and implications for cancer therapy. Oncogene. 2015;34:5105–5113. doi: 10.1038/onc.2014.458. [DOI] [PubMed] [Google Scholar]
- 30.Mulcahy Levy JM, Towers CG, Thorburn A. Targeting autophagy in cancer. Nat. Rev. Cancer. 2017;17:528–542. doi: 10.1038/nrc.2017.53. [DOI] [PMC free article] [PubMed] [Google Scholar]
- 31.Galluzzi L, Bravo-San Pedro JM, Levine B, Green DR, Kroemer G. Pharmacological modulation of autophagy: therapeutic potential and persisting obstacles. Nat. Rev. Drug Discov. 2017;16:487–511. doi: 10.1038/nrd.2017.22. [DOI] [PMC free article] [PubMed] [Google Scholar]
- 32.Amaravadi RK, et al. Principles and current strategies for targeting autophagy for cancer treatment. Clin. Cancer Res. 2011;17:654–666. doi: 10.1158/1078-0432.CCR-10-2634. [DOI] [PMC free article] [PubMed] [Google Scholar]
- 33.Kondo Y, Kondo S. Autophagy and cancer therapy. Autophagy. 2006;2:85–90. doi: 10.4161/auto.2.2.2463. [DOI] [PubMed] [Google Scholar]
- 34.Laplante M, Sabatini DM. mTOR signaling in growth control and disease. Cell. 2012;149:274–293. doi: 10.1016/j.cell.2012.03.017. [DOI] [PMC free article] [PubMed] [Google Scholar]
- 35.Weichhart T. Mammalian target of rapamycin: a signaling kinase for every aspect of cellular life. Methods Mol. Biol. 2012;821:1–14. doi: 10.1007/978-1-61779-430-8_1. [DOI] [PubMed] [Google Scholar]
- 36.Mamane Y, et al. mTOR, translation initiation and cancer. Oncogene. 2006;25:6416–6422. doi: 10.1038/sj.onc.1209888. [DOI] [PubMed] [Google Scholar]
- 37.Zaytseva YY, Valentino JD, Gulhati P, Evers BM. mTOR inhibitors in cancer therapy. Cancer Lett. 2012;319:1–7. doi: 10.1016/j.canlet.2012.01.005. [DOI] [PubMed] [Google Scholar]
- 38.Alayev A, Holz MK. mTOR signaling for biological control and cancer. J. Cell Physiol. 2013;228:1658–1664. doi: 10.1002/jcp.24351. [DOI] [PMC free article] [PubMed] [Google Scholar]
- 39.Zhang JF, Li M, Miao JY, Zhao BX. Biological activities of novel pyrazolyl hydroxamic acid derivatives against human lung cancer cell line A549. Eur. J. Med. Chem. 2014;83:516–525. doi: 10.1016/j.ejmech.2014.06.065. [DOI] [PubMed] [Google Scholar]
- 40.Wei Q, et al. Discovery of novel HSP90 inhibitors that induced apoptosis and impaired autophagic flux in A549 lung cancer cells. Eur. J. Med. Chem. 2018;145:551–558. doi: 10.1016/j.ejmech.2018.01.024. [DOI] [PubMed] [Google Scholar]
- 41.Li N, et al. Discovery of a new autophagy inducer for A549 lung cancer cells. Bioorg. Med. Chem. 2019;27:2845–2856. doi: 10.1016/j.bmc.2019.05.015. [DOI] [PubMed] [Google Scholar]
- 42.Papazisis KT, Geromichalos GD, Dimitriadis KA, Kortsaris AH. Optimization of the sulforhodamine B colorimetric assay. J. Immunol. Methods. 1997;208:151–158. doi: 10.1016/s0022-1759(97)00137-3. [DOI] [PubMed] [Google Scholar]
- 43.Zhang X, et al. New fluorescent pH probes for acid conditions. Sens. Actuat. B-Chem. 2015;206:663–670. [Google Scholar]
- 44.Jaishy B, Abel ED. Lipids, lysosomes, and autophagy. J. Lipid Res. 2016;57:1619–1635. doi: 10.1194/jlr.R067520. [DOI] [PMC free article] [PubMed] [Google Scholar]
- 45.Settembre C, et al. A lysosome-to-nucleus signalling mechanism senses and regulates the lysosome via mTOR and TFEB. EMBO J. 2012;31:1095–1108. doi: 10.1038/emboj.2012.32. [DOI] [PMC free article] [PubMed] [Google Scholar]
- 46.Ge D, et al. Identification of a novel MTOR activator and discovery of a competing endogenous RNA regulating autophagy in vascular endothelial cells. Autophagy. 2006;10:957–971. doi: 10.4161/auto.28363. [DOI] [PMC free article] [PubMed] [Google Scholar]
- 47.Lokman NA, Elder ASF, Ricciardelli C, Oehler MK. Chick chorioallantoic membrane (CAM) assay as an in vivo model to study the effect of newly identified molecules on ovarian cancer invasion and metastasis. Int. J. Mol. Sci. 2012;13:9959–9970. doi: 10.3390/ijms13089959. [DOI] [PMC free article] [PubMed] [Google Scholar]
- 48.Settembre C, Fraldi A, Medina DL, Ballabio A. Signals from the lysosome: a control centre for cellular clearance and energy metabolism. Nat. Rev. Mol. Cell Biol. 2013;14:283–296. doi: 10.1038/nrm3565. [DOI] [PMC free article] [PubMed] [Google Scholar]
- 49.Rabinowitz JD, White E. Autophagy and metabolism. Science. 2010;330:1344–1348. doi: 10.1126/science.1193497. [DOI] [PMC free article] [PubMed] [Google Scholar]
- 50.Liu R, et al. Itraconazole suppresses the growth of glioblastoma through induction of autophagy: 8 involvement of abnormal cholesterol trafficking. Autophagy. 2014;10:1241–1255. doi: 10.4161/auto.28912. [DOI] [PMC free article] [PubMed] [Google Scholar]
- 51.Nassour J, et al. Autophagic cell death restricts chromosomal instability during replicative crisis. Nature. 2019;565:659–663. doi: 10.1038/s41586-019-0885-0. [DOI] [PMC free article] [PubMed] [Google Scholar]
- 52.Zoncu R, Efeyan A, Sabatini DM. mTOR: from growth signal integration to cancer, diabetes and ageing. Nat. Rev. Mol. Cell Biol. 2011;12:21–35. doi: 10.1038/nrm3025. [DOI] [PMC free article] [PubMed] [Google Scholar]
- 53.Yu L, et al. Termination of autophagy and reformation of lysosomes regulated by mTOR. Nature. 2010;465:942–946. doi: 10.1038/nature09076. [DOI] [PMC free article] [PubMed] [Google Scholar]
- 54.Huang S, Bjornsti MA, Houghton PJ. Rapamycins: mechanism of action and cellular resistance. Cancer Biol. Ther. 2003;2:222–232. doi: 10.4161/cbt.2.3.360. [DOI] [PubMed] [Google Scholar]
Associated Data
This section collects any data citations, data availability statements, or supplementary materials included in this article.


