Abstract
OBJECTIVE
Insulin secretion declines rapidly after diagnosis of type 1 diabetes, followed by a slower rate of change. Previous studies have demonstrated that the C-peptide decline begins before the clinical diagnosis. Changes in insulin secretion in the same individuals studied from preclinical stages through and after clinical diagnosis have not been previously reported.
RESEARCH DESIGN AND METHODS
Antibody-positive relatives undergo sequential oral glucose tolerance testing (OGTT) as part of TrialNet’s Pathway to Prevention study and continue both OGTT and mixed-meal tolerance testing (MMTT) as part of the Long-term Investigational Follow-up in TrialNet study if they develop type 1 diabetes. We analyzed glucose and C-peptide data obtained from 80 TrialNet subjects who had OGTT before and after clinical diagnosis. Separately, we compared C-peptide response to OGTT and MMTT in 127 participants after diagnosis.
RESULTS
C-peptide did not change significantly until 6 months before the clinical diagnosis of type 1 diabetes and continued to decline postdiagnosis, and the rates of decline for the first 6 months postdiagnosis were similar to the 6 months prediagnosis. There were no significant differences in MMTT and OGTT C-peptide responses in paired tests postdiagnosis.
CONCLUSIONS
This is the first analysis of C-peptide levels in longitudinally monitored patients with type 1 diabetes studied from before diagnosis and continuing to the postdiagnosis period. These data highlight the discordant timing between accelerated β-cell dysfunction and the current glucose thresholds for clinical diagnosis. To preserve β-cell function, disease-modifying therapy should start at or before the acute decline in C-peptide.
Introduction
While it is now understood that type 1 diabetes develops over time from a genetic predisposition to the development of β-cell autoimmunity with measurable pancreatic autoantibodies (stage 1 disease) to dysglycemia (stage 2 disease) and then to a clinical diagnosis of type 1 diabetes (stage 3 disease) (1,2), little is known about sequential changes in insulin secretion and glucose homeostasis that occur as individuals progress through these stages. TrialNet’s Pathway to Prevention study screens relatives of those with type 1 diabetes for the presence of autoantibodies. Antibody-positive relatives are then closely monitored every 6 months with oral glucose tolerance tests (OGTTs) until stage 3. These same individuals are then studied postdiagnosis as part of the Long-term Investigational Follow-up in TrialNet (LIFT) study with serial OGTT and mixed-meal tolerance test (MMTT) assessments, thus providing a unique cohort to understand the peridiagnostic period. This study has two major objectives: to assess the C-peptide in the peridiagnostic period and to measure the C-peptide response to both OGTT and MMTT.
It has previously been shown that individuals with positive antibodies have impaired C-peptide secretion long before the clinical diagnosis of type 1 diabetes, but the decline is stable until 6–12 months before diagnosis, when C-peptide starts to fall more abruptly. This rapid decline in C-peptide is associated with an increase in glucose levels at 6–12 months before clinical type 1 diabetes diagnosis (3–5).
Separately, there is considerable literature describing changes in C-peptide in response to MMTT postdiagnosis. As previously reported, the fall of C-peptide after clinical diagnosis of type 1 diabetes is not constant; the decline in the C-peptide was slower 12 months postdiagnosis compared with the decline seen within the 1st year (6). Multiple studies have found that adults have a slower rate of C-peptide decline than children (6–9).
The pattern of metabolic decompensation in the same cohort using the same metabolic test and monitored through the stages of the disease—from before, during, and after clinical diagnosis of type 1 diabetes—has not been previously reported. Here we aimed to determine whether crossing the type 1 diabetes diagnostic glucose threshold impacts the rate of change in OGTT-stimulated C-peptide, and further, to explore the relation of OGTT- and MMTT-stimulated C-peptide postclinical diagnosis.
Research Design and Methods
Subjects
Type 1 Diabetes TrialNet is an international network established to conduct clinical trials to intervene in the type 1 diabetes disease process at any stage of disease, with the aim of preserving β-cell function. Subjects enrolled in the TrialNet Pathway to Prevention protocol— first- or second-degree relatives of patients with type 1 diabetes—were monitored every 6 months with an OGTT until a clinical type 1 diabetes diagnosis. Those with diagnosis of diabetes are eligible to enter the LIFT study where they continue to have an OGTT every 6 months as well as an MMTT to assess residual insulin secretion. Protocols were approved by institutional review boards/ethic review boards. Written informed consent and assent, as appropriate, were obtained before study participation.
Cohort 1
Change in OGTT C-peptide and glucose was evaluated in cohort 1 (n = 80) through and after clinical diagnosis. Criteria for inclusion in this cohort required 1) participation in both Pathway to Prevention and LIFT studies, 2) diagnosis of diabetes via two consecutive OGTTs within 2 months (71 days) of each other meeting American Diabetes Association criteria for diagnosis (fasting glucose ≥126 mg/mL or 2-h ≥200 mg/dL), with the date of the second confirmatory OGTT used as the date of diagnosis, and 3) at least two additional OGTTs within 9 months before and 9 months after the type 1 diabetes (±275 days) diagnosis. As per criteria for serial OGTT testing in the Pathway to Prevention study, all individuals were antibody positive while in that study, two had a single confirmed antibody, and the rest had more than one antibody.
Cohort 2
OGTT- and MMTT-stimulated C-peptide were compared in cohort 2 (n = 127) after clinical diagnosis. Criteria for inclusion required 1) participation in both Pathway to Prevention and LIFT studies and 2) at least one MMTT and OGTT pair within 28 days of each other after the type 1 diabetes diagnosis defined above. There were a total of 171 paired tests; 44 subjects had 2 OGTT and MMTT pairs and the remaining 83 subjects had 1 pair of tests.
Procedures
OGTT
As previously described (4), data were collected from a 2-h OGTT started before 10:00 a.m. after an overnight fast. OGTTs were initiated only if the fasting glucose levels were between 70 and 200 mg/dL. Glucola was administered at a dose of 1.75 g/kg to a maximum of 75 g and consumed within 5 min. Venous blood samples were obtained 10 min before and at the start of consuming the Glucola and 30, 60, 90, and 120 min later for measurement of both glucose and C-peptide.
MMTT
As previously described (10), data were collected from a 2-h MMTT that started before 10:00 a.m. after an overnight fast. MMTTs were initiated only if the fasting glucose levels were between 70 and 200 mg/dL. BOOST-HP (Nestlé Health Care Nutrition), a standard preparation of fat, carbohydrate, and protein, was administered at a dose of 6 mg/kg to a maximum of 360 mL. Venous blood samples were obtained 10 min before and at the start of consuming the BOOST and 30, 60, 90, and 120 min later for measurement of glucose and C-peptide.
Statistical Analysis
The C-peptide area under the curve (AUC) mean and glucose AUC mean over time were calculated in all subjects from cohort 1. Computations used the transformed value of C-peptide AUC mean: log (Cp + 1). A unique line for each individual was computed using the closest values before and after each month. For each month and each subject, the two most proximal assessments were used to compute a unique line defined by the slope and y-intercept. The C-peptide or glucose value was set to the line’s value at the specific month being evaluated. A given subject’s slope may not change for several months until the month being evaluated dictates a different pair of proximal C-peptide assessments. Those who did not have the defined pair of proximal C-peptide assessments were excluded from that month’s calculation.
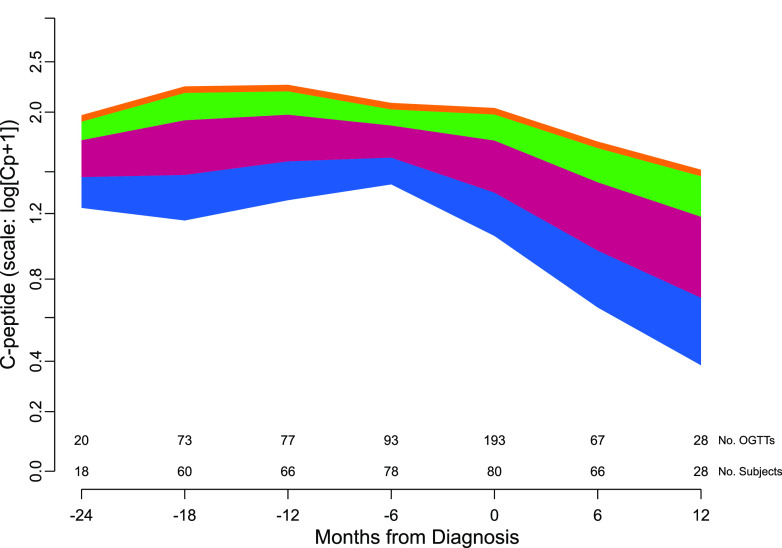
A mixed model was fitted to repeated measures of C-peptide from the OGTTs taken 24 months before type 1 diabetes diagnosis to 12 months after the diagnosis. There were three random effects: y-intercept and two slope segments (<−6 months and >−6 months) to reflect between-subject differences. Fixed effects were included for age and time (piecewise linear, 6-month intervals) as well as an interaction term of age with each 6-month interval, yielding seven main fixed effects and six interaction fixed effects. The likelihood ratio test was used to estimate the significance levels of the fixed effects. Two series of tests were conducted. The first series tested whether the 6-month coefficient (i.e., slope) was zero. The second series tested whether the 6-month coefficient differed from the previous 6-month coefficient. Age was included as a continuous variable up to 20 years and then held constant to be consistent with lack of evidence of any differing age effect among the adults. Figure 2 reflects the model described above, including all covariates (i.e., full). The intent is that the graph reflects the data fitted to the full model.
Figure 2.
The mean rate of C-peptide decline before and after type 1 diabetes diagnosis from the fitted mixed model in which age is included as a continuous variable. Four age ranges are used to illustrate the effect of age on C-peptide decline: blue = ages 6–11; burgundy = ages 11–17; green = ages 17–20; and orange = age >20 years. The number of subjects and the number of C-peptide measurements contributing to the fit are displayed along the x-axis. The frequency is based on the points within a ±3-month window of the month indicated under the tick mark.
Pearson’s product moment correlation coefficient was used in estimating the correlation between the transformed (i.e., log[Cp + 1]) C-peptide AUC means from the OGTT versus the MMTT.
All analyses were conducted in TIBCO Spotfire S+ 8.2 Workbench.
Results
Evaluating Changes in OGTT C-Peptide and Glucose Through Clinical Diagnosis
Adult and pediatric subjects were included, with a median age of 14 years (range 3.9–55.1). There were 20 individuals younger than age 11 years, 35 between age 11 and 20 years, and 25 older than age 20 years. There were 41 male participants (51%), and 74 white (95%), 2 African American, 2 Asian, and 3 participants of unreported race. Three participants were Hispanic/Latino.
A median of 9 (range 2–29) prediagnosis OGTTs were performed; the median time of the most recent prediagnosis OGTT to diagnosis was 6.6 months (range 8.9–1.1). There was a median of two postdiagnosis OGTTs (range 1–3), and the median of the first was done at 3.9 months (range 0.7–8.7) from diagnosis.
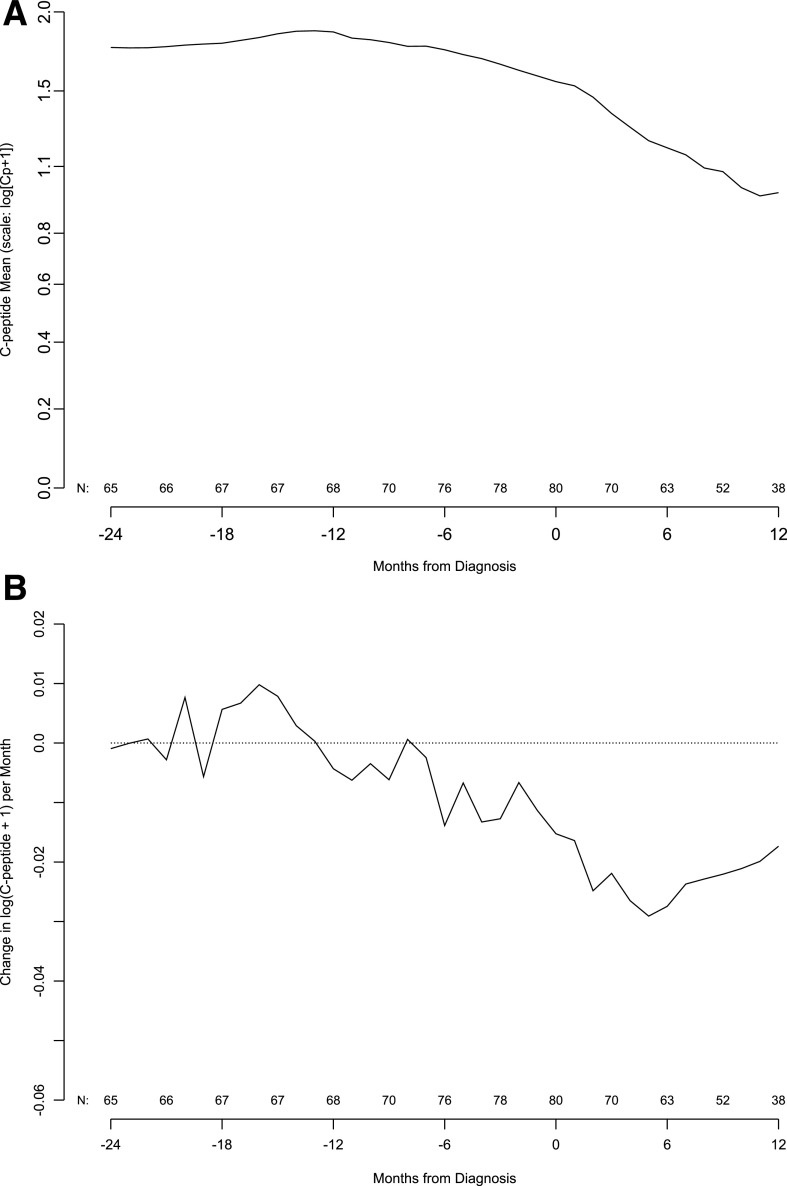
The mean C-peptide level was relatively stable from 24 to 6 months before the type 1 diabetes diagnosis. C-peptide levels then significantly declined from 6 months before diagnosis, a decline that continued through 12 months after diagnosis (Fig. 1A). Subtle changes in the C-peptide level per month start ∼12 months before the diagnosis, but the change in C-peptide mean hovers around zero until 6 months before the diagnosis and continues to be negative thereafter (Fig. 1B).
Figure 1.
A: Population mean of C-peptide AUC mean by months from type 1 diabetes diagnosis. Number of subjects contributing to the mean is indicated along the x-axis. B: Population mean of change in C-peptide AUC mean by month from type 1 diabetes diagnosis. Number of subjects contributing to the mean change appears along the x-axis. The slope is in units of change in log(Cp +1) per month.
The fall in the C-peptide AUC mean from 24 months before the type 1 diabetes diagnosis through 12 months after the diagnosis was further explored by fitting a mixed model to the C-peptide levels from the OGTTs. Age, as a continuous variable through 20 years, was significant for the level of C-peptide (likelihood ratio test: P = 0.0007) and the rate of decline for all 6-month linear time intervals (likelihood ratio test: P = 0.02). The slopes of the 6-month linear time intervals were each tested for departure from zero (no decline), with the intervals −6 to 0, 0 to +6, and +6 to +12 months having statistically significant declines (P = 0.0001, P < 0.0001, P = 0.005, respectively). Retaining these three intervals, we then tested which 6-month interval had a significant departure in slope from the −6- to 0-month period. Neither the 0- to +6-month interval nor the +6- to +12-month interval was significantly different from the slope starting at −6 months (P = 0.61 and P = 0.22, respectively). Thus, the model indicates that C-peptide begins to decline 6 months before the diagnosis and continues to fall at approximately the same rate 12 months after the diagnosis.
Figure 2 shows the model-predicted means of C-peptide for subjects’ age starting 24 months before diagnosis until 12 months after diagnosis. The predicted C-peptide mean for subjects of a specific age may be approximated from the figure by interpolating within the range of the appropriate color band. Older subjects had higher C-peptide levels throughout the time range, and age influenced the rate of decline.
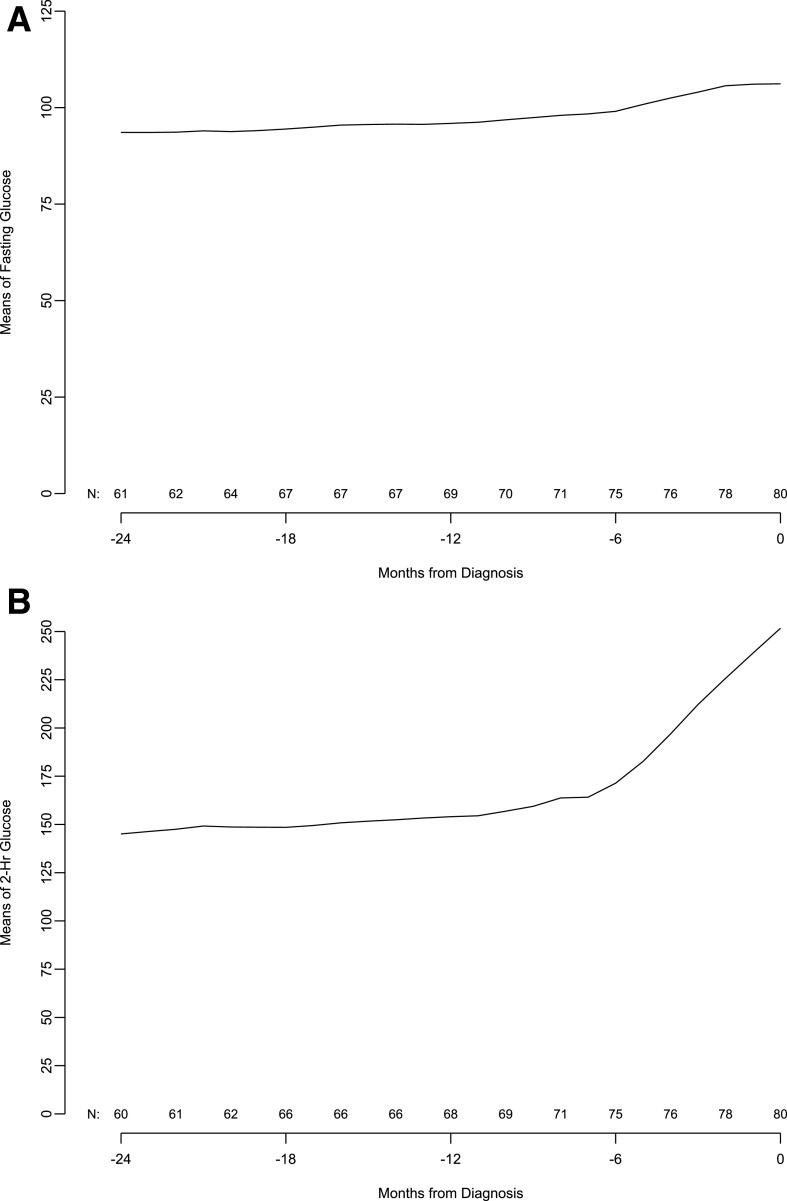
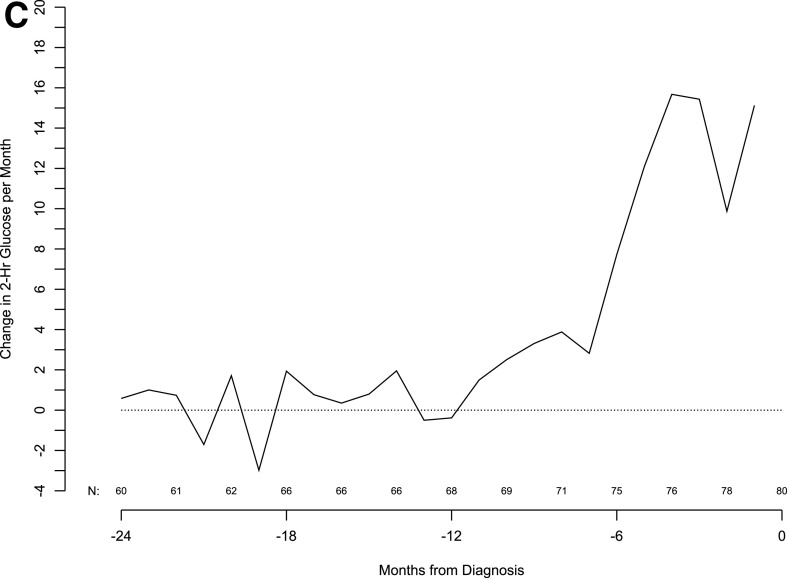
Given the significant C-peptide fall before diagnosis, we evaluated glucose levels in the same cohort of patients in 6-month increments from 24 months before up to the type 1 diabetes diagnosis. The results show that mean fasting and 2-h glucose levels start to increase 6 months before the diagnosis. This time period also corresponded to a marked increase in the monthly rate of change of fasting glucose. In contrast, like C-peptide, changes in the 2-h glucose value per month started ∼12 months before the diagnosis, and this increase rate was sustained through clinical diagnosis (Fig. 3).
Figure 3.
Moving averages of fasting glucose (A), 2-h glucose (B), and 2-h glucose slope (C, next page) in subjects from 24 months before diagnosis to diagnosis.
Comparison of C-Peptide From OGTT and MMTT
Data from 127 individuals with 171 paired tests were used to compare C-peptide in response to OGTT and MMTT stimulation. This cohort had a median age of 13.5 years (range 4.3–51.1), and 66 (52%) participants were male. Of the participants, 120 were white (95%), 1 African American, 1 Asian, and 5 with unreported race. Five participants were Hispanic/Latino. There were a median of 3.0 days (range 0–28) between the paired tests. The median time to the paired tests was 11.3 months (range 7.47–28.5) from diagnosis time.
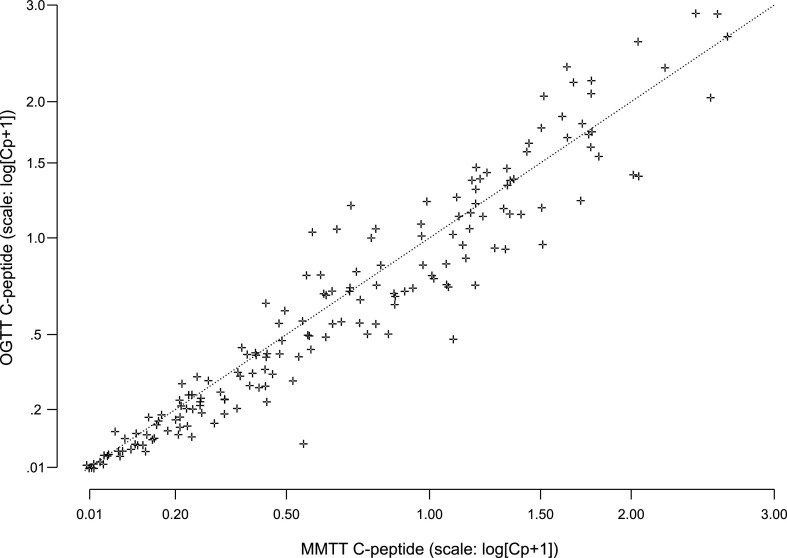
The OGTT preceded the MMTT in 126 paired tests (74%). The AUC C-peptide response to OGTT and MMTT was highly correlated among the 171 paired measurements from 111 subjects (r = 0.96) (Fig. 4). The linear regression coefficient of 1.01% from the paired tests was not statistically significantly different from 1 (P = 0.66), thus indicating that the paired values are the same except for random error. The intercept (coefficient estimate of −0.0257) was not significantly different from zero (P = 0.07). The days between the two tests, age, and the time from diagnosis had no significant influence on the agreement between the C-peptide levels from the two tests.
Figure 4.
Comparison of C-peptide AUC means computed from proximal MMTT and OGTT samples after type 1 diabetes diagnosis (171 pairs from 127 subjects).
Conclusions
A goal of disease-modifying therapy in type 1 diabetes is to preserve β-cell function; thus, understanding when changes in β-cell function occur in the natural history of the disease should help identify when to intervene and to evaluate response to therapy. The recently accepted concept of stages of diabetes progression depends on measures of antibodies and glucose. Multiple antibody-positive individuals with normal glucose tolerance are considered to be at stage 1 diabetes, those with abnormal glucose tolerance at stage 2 diabetes, and clinical diagnosis is considered stage 3 type 1 diabetes (1,2). Missing from this classification scheme is the status of β-cell function during disease progression.
As previously reported, a pattern of stable, but impaired, C-peptide response to an OGTT, followed by rapid decline, was evident in antibody-positive individuals who progressed to stage 3 disease regardless of whether the time of progression was short or >5 years (3,11). Other data have described a steep slope of C-peptide shortly after diagnosis, followed by a more stable rate of change (6). By evaluating responses to the same test in the same individuals before, during, and after clinical diagnosis, we demonstrate that there is no difference in the rate of decline of C-peptide before and after crossing the diagnostic threshold for clinical type 1 diabetes. Thus, our study pinpoints a window from ∼6 months on either side of clinical diagnosis in which rapid changes in β-cell function are occurring. Further, while age influences the amount and rate of fall of C-peptide, all age-groups had the same pattern in the change of C-peptide through the peridiagnostic period.
The reason for the abrupt change in C-peptide secretion is unknown. One possibility is an external event placing acute stress on the β-cell, for example, increased insulin demand in response to an environmental insult such as infection. Ironically, the knowledge that autoimmunity begins long before diagnosis has directed the search for disease triggers in early life, and these data highlight the gap in knowledge about how external insults alter disease course after (often long after) autoimmunity is present. The rapid change in C-peptide secretion could also simply represent β-cells having reached a critical threshold resulting in collapse of the remaining function rather than a discrete insult. This is analogous to progression to renal failure, where a gradual decline in function eventually reaches a tipping point. A third explanation is that this could be evidence of an immune flair accelerating tissue injury, as commonly seen in other immune-mediated diseases. In multiple sclerosis, for example, there appears to be progressive neurological tissue injury in addition to immune flairs. Importantly, however, immune therapy reduces the flairs and leads to better clinical outcome (12). In type 1 diabetes, five different immunotherapeutics have thus far been found that alter the rate of β-cell dysfunction or death when given in the first few months after clinical diagnosis (13–17), and immune therapy with teplizumab was recently shown to be effective in delaying disease progression before diagnosis (18), supporting the concept that there is active immunity occurring during this time. Data presented here suggest that the window for effective immunotherapy starts 6–12 months before the clinical diagnosis (19). Combining immune therapy with approaches directed at β-cell dysfunction would be ideal. Work is underway to predict and better understand the causes of this metabolic inflection point.
Our data also showed no real differences between C-peptide response to stimulus with oral glucose compared with a mixed meal containing glucose, protein, and fat, although the former results in higher glucose excursions (data not shown). Historically, the MMTT has been used to assess β-cell function after diagnosis to better mimic islet responses that would be experienced with normal food consumption and also to take into account that insulin secretion is maintained in response to fats and proteins when response to glucose is diminished (10). In the Diabetes Prevention Trial–Type 1 (DPT-1), OGTT and MMTT were used to measure insulin secretion in autoantibody-positive subjects before the clinical onset of diabetes. In that study, the insulin response to OGTT was greater than to MMTT (20). Thus, the loss in response to an oral glucose load relative to MMTT with further disease progression and, therefore, more β-cell injury, is expected and likely accounts for the equivalence in response to the two tests in the period of time studied. The high correlation observed in our study between OGTT and MMTT response soon after diagnosis of type 1 diabetes is reassuring that either test is valid and that studies that use one or the other produce comparable results.
In DPT-1, subjects had an intravenous glucose tolerance test in addition to OGTT and MMTT. Evaluation of DPT-1 data led to the conclusion that the added subject burden outweighed the additional information about insulin secretion obtained from the different tests (20). As a result, only the OGTT is regularly performed in TrialNet before diagnosis, because the single test provides required glucose values depicting disease progression and insulin secretion data. Nonetheless, using different measures to assess the health of the β-cell may provide a more comprehensive picture of disease progression at early disease stages and, in particular, to better understand the transition of stable to rapid loss secretion described here. For example, the presence of low first-phase insulin response to intravenous glucose markedly increased the rate of disease progression and identified a cohort that responded to oral insulin (21), and we have recently reported that the insulin response to glucose-potentiated arginine stimulation is a reproducible measure that is thought to estimate function of the β-cell mass (22). Combined with other measures indicative of β-cell injury, such as impaired insulin (23) and islet amyloid polypetide (24) processing, and measures of β-cell death, such as demethylation of insulin DNA in circulating blood (25,26), such detailed and frequent analyses are likely to be informative during this period of time.
In summary, we evaluated sequential C-peptide levels in antibody-positive subjects as they progressed from early stages of type 1 diabetes through and after development of stage 3 “new-onset” type 1 diabetes. We found that C-peptide levels declined significantly 6 months before the transition to stage 3 (new-onset) type 1 diabetes and demonstrate for the first time that this rate of fall continues unchanged after diagnosis. Thus, the rate of fall of insulin secretion should be considered as entry criteria or an outcome measure for clinical trials aiming to alter disease course alongside progression through stages of type 1 diabetes. Importantly, these data highlight the discordant timing between accelerated β-cell dysfunction and the current glucose thresholds for diagnosis. To preserve β-cell function, disease-modifying therapy should start at or before the acute decline.
Article Information
Acknowledgments. The authors acknowledge the support of the Type 1 Diabetes TrialNet Study Group, which identified study participants and provided samples and follow-up data for this study.
Funding. The Type 1 Diabetes TrialNet Study Group is a clinical trials network funded by the National Institutes of Health Clinical Center through the National Institute of Diabetes and Digestive and Kidney Diseases, the National Institute of Allergy and Infectious Diseases, and the Eunice Kennedy Shriver National Institute of Child Health and Human Development, through cooperative agreements U01-DK-061010, U01-DK-061034, U01-DK-061042, U01-DK-061058, U01-DK-085465, U01-DK-085453, U01-DK-085461, U01- DK-085466, U01-DK-085499, U01-DK-085504, U01-DK-085509, U01-DK-103180, U01-DK-103153, U01-DK-085476, U01-DK-103266, U01-DK-103282, U01-DK-106984, U01-DK-106994, U01-DK-107013, U01-DK-107014, UC4-DK-097835, and UC4-DK-106993 and JDRF.
The contents of this article are solely the responsibility of the authors and do not necessarily represent the official views of the National Institutes of Health or JDRF.
Duality of Interest. No potential conflicts of interest relevant to this article were reported.
Author Contributions. M.M.B. contributed to the design of the study and data interpretation and wrote the manuscript. B.N.B. performed the statistical analysis and edited and reviewed the manuscript. R.S.G. contributed to the design of the study and data interpretation and edited and reviewed the manuscript. C.J.G. contributed to the design, discussion, and interpretation of data and reviewed and edited the manuscript. All authors gave final approval for publication. M.M.B. and B.N.B. are the guarantors of this work and, as such, had full access to all the data in the study and take responsibility for the integrity of the data and the accuracy of the data analysis.
Prior Presentation. Parts of this study were presented as a moderated poster discussion at the 76th Scientific Sessions of the American Diabetes Association, New Orleans, LA, 10–14 June 2016.
References
- 1.Insel RA, Dunne JL, Atkinson MA, et al. . Staging presymptomatic type 1 diabetes: a scientific statement of JDRF, the Endocrine Society, and the American Diabetes Association. Diabetes Care 2015;38:1964–1974 [DOI] [PMC free article] [PubMed] [Google Scholar]
- 2.Bingley PJ, Wherrett DK, Shultz A, Rafkin LE, Atkinson MA, Greenbaum CJ. Type 1 Diabetes TrialNet: a multifaceted approach to bringing disease-modifying therapy to clinical use in type 1 diabetes. Diabetes Care 2018;41:653–661 [DOI] [PMC free article] [PubMed] [Google Scholar]
- 3.Evans-Molina C, Sims EK, DiMeglio LA, et al.; Type 1 Diabetes TrialNet Study Group . β Cell dysfunction exists more than 5 years before type 1 diabetes diagnosis. JCI Insight 2018;3:e120877. [DOI] [PMC free article] [PubMed] [Google Scholar]
- 4.Sosenko JM, Palmer JP, Greenbaum CJ, et al. . Patterns of metabolic progression to type 1 diabetes in the Diabetes Prevention Trial-Type 1. Diabetes Care 2006;29:643–649 [DOI] [PubMed] [Google Scholar]
- 5.Ferrannini E, Mari A, Nofrate V, Sosenko JM, Skyler JS; DPT-1 Study Group . Progression to diabetes in relatives of type 1 diabetic patients: mechanisms and mode of onset. Diabetes 2010;59:679–685 [DOI] [PMC free article] [PubMed] [Google Scholar]
- 6.Greenbaum CJ, Beam CA, Boulware D, et al.; Type 1 Diabetes TrialNet Study Group . Fall in C-peptide during first 2 years from diagnosis: evidence of at least two distinct phases from composite Type 1 Diabetes TrialNet data. Diabetes 2012;61:2066–2073 [DOI] [PMC free article] [PubMed] [Google Scholar]
- 7.Davis AK, DuBose SN, Haller MJ, et al.; T1D Exchange Clinic Network . Prevalence of detectable C-peptide according to age at diagnosis and duration of type 1 diabetes. Diabetes Care 2015;38:476–481 [DOI] [PubMed] [Google Scholar]
- 8.Ludvigsson J, Carlsson A, Deli A, et al. . Decline of C-peptide during the first year after diagnosis of Type 1 diabetes in children and adolescents. Diabetes Res Clin Pract 2013;100:203–209 [DOI] [PubMed] [Google Scholar]
- 9.Hao W, Gitelman S, DiMeglio LA, Boulware D, Greenbaum CJ; Type 1 Diabetes TrialNet Study Group . Fall in C-peptide during first 4 years from diagnosis of type 1 diabetes: variable relation to age, HbA1c, and insulin dose. Diabetes Care 2016;39:1664–1670 [DOI] [PMC free article] [PubMed] [Google Scholar]
- 10.Greenbaum CJ, Mandrup-Poulsen T, McGee PF, et al.; Type 1 Diabetes Trial Net Research Group; European C-Peptide Trial Study Group . Mixed-meal tolerance test versus glucagon stimulation test for the assessment of β-cell function in therapeutic trials in type 1 diabetes. Diabetes Care 2008;31:1966–1971 [DOI] [PMC free article] [PubMed] [Google Scholar]
- 11.Sosenko JM, Palmer JP, Rafkin-Mervis L, et al. . Glucose and C-peptide changes in the perionset period of type 1 diabetes in the Diabetes Prevention Trial-Type 1. Diabetes Care 2008;31:2188–2192 [DOI] [PMC free article] [PubMed] [Google Scholar]
- 12.Filippi M, Bar-Or A, Piehl F, et al. . Multiple sclerosis. Nat Rev Dis Primers 2018;4:43. [DOI] [PubMed] [Google Scholar]
- 13.Pescovitz MD, Greenbaum CJ, Krause-Steinrauf H, et al.; Type 1 Diabetes TrialNet Anti-CD20 Study Group . Rituximab, B-lymphocyte depletion, and preservation of beta-cell function. N Engl J Med 2009;361:2143–2152 [DOI] [PMC free article] [PubMed] [Google Scholar]
- 14.Orban T, Bundy B, Becker DJ, et al.; Type 1 Diabetes TrialNet Abatacept Study Group . Co-stimulation modulation with abatacept in patients with recent-onset type 1 diabetes: a randomised, double-blind, placebo-controlled trial. Lancet 2011;378:412–419 [DOI] [PMC free article] [PubMed] [Google Scholar]
- 15.Rigby MR, Harris KM, Pinckney A, et al. . Alefacept provides sustained clinical and immunological effects in new-onset type 1 diabetes patients. J Clin Invest 2015;125:3285–3296 [DOI] [PMC free article] [PubMed] [Google Scholar]
- 16.Herold KC, Gitelman SE, Ehlers MR, et al.; AbATE Study Team . Teplizumab (anti-CD3 mAb) treatment preserves C-peptide responses in patients with new-onset type 1 diabetes in a randomized controlled trial: metabolic and immunologic features at baseline identify a subgroup of responders. Diabetes 2013;62:3766–3774 [DOI] [PMC free article] [PubMed] [Google Scholar]
- 17.Haller MJ, Long SA, Blanchfield JL, et al.; Type 1 Diabetes TrialNet ATG-GCSF Study Group . Low-dose anti-thymocyte globulin preserves C-peptide, reduces HbA1c, and increases regulatory to conventional T-cell ratios in new-onset type 1 diabetes: two-year clinical trial data. Diabetes 2019;68:1267–1276 [DOI] [PMC free article] [PubMed] [Google Scholar]
- 18.Herold KC, Bundy BN, Long SA, et al.; Type 1 Diabetes TrialNet Study Group . An anti-CD3 antibody, teplizumab, in relatives at risk for type 1 diabetes. N Engl J Med 2019;381:603–613 [DOI] [PMC free article] [PubMed] [Google Scholar]
- 19.Greenbaum CJ, Speake C, Krischer J, et al. . Strength in numbers: opportunities for enhancing the development of effective treatments for type 1 diabetes—the TrialNet experience. Diabetes 2018;67:1216–1225 [DOI] [PMC free article] [PubMed] [Google Scholar]
- 20.Greenbaum CJ, Buckingham B, Chase HP, Krischer J; Diabetes Prevention Trial, Type 1 Diabetes (DPT-1) Study Group . Metabolic tests to determine risk for type 1 diabetes in clinical trials. Diabetes Metab Res Rev 2011;27:584–589 [DOI] [PMC free article] [PubMed] [Google Scholar]
- 21.Writing Committee for the Type 1 Diabetes TrialNet Oral Insulin Study Group, Krischer JP, Schatz DA, Bundy B, Skyler JS, Greenbaum CJ. Effect of oral insulin on prevention of diabetes in relatives of patients with type 1 diabetes: a randomized clinical trial. JAMA 2017;318:1891–1902 [DOI] [PMC free article] [PubMed] [Google Scholar]
- 22.Hao W, Woodwyk A, Beam C, Bahnson HT, Palmer JP, Greenbaum CJ. Assessment of β cell mass and function by AIRmax and intravenous glucose in high-risk subjects for type 1 diabetes. J Clin Endocrinol Metab 2017;102:4428–4434 [DOI] [PMC free article] [PubMed] [Google Scholar]
- 23.Sims EK, Chaudhry Z, Watkins R, et al. . Elevations in the fasting serum proinsulin-to-C-peptide ratio precede the onset of type 1 diabetes. Diabetes Care 2016;39:1519–1526 [DOI] [PMC free article] [PubMed] [Google Scholar]
- 24.Courtade JA, Klimek-Abercrombie AM, Chen YC, et al. . Measurement of pro-islet amyloid polypeptide (1-48) in diabetes and islet transplants. J Clin Endocrinol Metab 2017;102:2595–2603 [DOI] [PubMed] [Google Scholar]
- 25.Herold KC, Usmani-Brown S, Ghazi T, et al.; Type 1 Diabetes TrialNet Study Group . β cell death and dysfunction during type 1 diabetes development in at-risk individuals. J Clin Invest 2015;125:1163–1173 [DOI] [PMC free article] [PubMed] [Google Scholar]
- 26.Speake C, Ylescupidez A, Neiman D, et al. . Circulating unmethylated insulin DNA as a biomarker of human beta cell death: a multi-laboratory assay comparison. J Clin Endocrinol Metab 2020;105:781–791 [DOI] [PMC free article] [PubMed] [Google Scholar]


