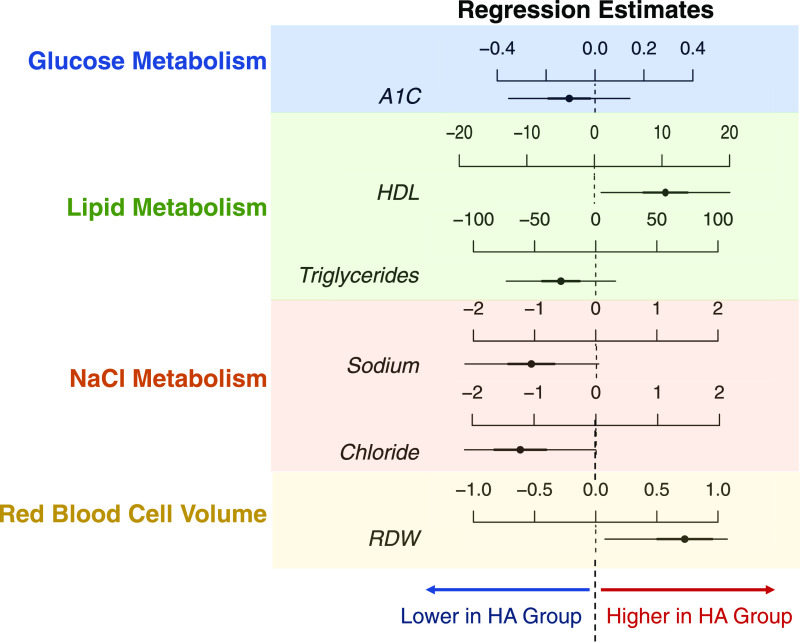
Figure 2.
Linear mixed model estimates on fixed effects introduced by LA and HA group. Results for full linear mixed models are shown in Supplementary Fig. 9. The comparisons of active vs. inactive groups are presented here. Dashed lines represent the LA group, while regression estimates for the HA group are displayed as horizontal lines. The center of each horizontal line is the β-coefficient of regression, while thick lines represent 50% credible intervals or ±1 SD and thin lines represent 95% credible intervals or ±2 SD. A1C, hemoglobin A1c. This analysis is based on 88 and 229 repeated measurements for HA and LA subjects, respectively.

