

Abstract
Objective:
Individuals with human immunodeficiency virus (HIV) treated with antiretroviral therapy can expect to reach average life span, making them susceptible to combined disease and aging effects on cognitive and motor functions. Slowed processing speed in HIV is a concern for cognitive and everyday functioning and is sensitive to declines with aging. We hypothesized that information processing (IP) deficits, over and above that expected with normal aging, would occur in older HIV patients similar to those observed in Parkinson’s disease (PD) patients, with both conditions affecting frontostriatal pathways.
Method:
Groups comprised 26 individuals with HIV infection, 29 with mild-to-moderate PD, and 21 healthy controls (C). Speed of IP was assessed with the oral version of the Symbol Digit Modalities Test and the color naming condition of the Golden Stroop Task.
Results:
The HIV group was impaired on speed of IP tasks compared to both the C and PD groups. Even after controlling for normal aging effects, older age in the HIV group correlated with IP slowing. Slower IP speed was associated with poorer general cognitive ability and more extrapyramidal motor signs in older HIV-infected individuals.
Conclusions:
The notable effects of impaired IP speed, over and above neurotypical age–related declines, indicate that older HIV–infected individuals may have an enhanced vulnerability for developing non–motor and motor symptoms despite antiretroviral therapy. Assessing for oral IP speed may provide the unique opportunity to identify early signs of progressive clinical declines in HIV.
Keywords: HIV, aging, Parkinson’s disease, information processing speed, cognitive and motor functions
In the age of combination antiretroviral therapy (cART), there is an increasing prevalence of older adult individuals living with HIV infection in the United States (U.S.). In 2014, approximately 45% of individuals diagnosed with HIV infection in the U.S. were 50 years or older, with 27% aged 55 or older and 6% aged 65 or older (Centers for Disease Control and Prevention [CDC], 2015). In fact, a 20-year-old undergoing highly active ART (HAART) can expect to live into their 70s, similar to the life expectancy of the general population (Samji et al., 2013). However, with greater life expectancy comes age–related declines, increasing the susceptibility of combined effects of aging and HIV infection on cognitive and motor functions.
Despite the advent of HAART, cognitive impairments, specifically HIV-associated neurocognitive disorder (HAND), commonly occur and continue to affect approximately 15-55% of HIV-infected individuals engaging in ART (Clifford & Ances, 2013; Heaton et al., 2011; Sacktor, 2017; Sacktor et al., 2002, 2016). Cognitive impairments in individuals with HIV-infection have been related to decline in motor-related functioning, such as psychomotor speed and speed of information processing (IP) (Robinson-Papp et al., 2008; Fellows, Byrd, & Morgello, 2014; Sacktor et al., 2003). Impairments in IP speed are of particular concern, as this domain has shown increased decline as a function of HIV disease duration in pre-HAART (Baldewicz et al., 2004; Becker et al., 1997; Heaton et al., 2011) and HAART eras (Fellows et al., 2014; Heaton et al., 2011). Speed of IP is also sensitive to age–related decline in healthy adults (Baldewicz et al., 2004; Reger, Welsh, Razani, Martin, & Boone, 2002). Older adults with HIV infection have been found to consistently perform worse on tasks of psychomotor speed and executive functioning compared to younger HIV-infected adults, and demonstrate high within-person variability in performance across domains associated with neurocognitive decline (Hinkin et al., 2004; Morgan, Woods, Delano-Wood, Bondi, & Grant, 2011; Wilkie et al., 2003). The neuropsychological relevance of IP speed is that this cognitive domain can index decline with aging and may be of specific value for individuals now aging with HIV-infection (Fellows et al., 2014) for endorsing speed of processing training interventions to counteract cognitive and motor decline shown to impact driving, mobility, and employment (Cody, Fazeli, & Vance, 2015; Vance, Fazeli, Ball, Slater, & Ross, 2014).
Even though motor impairments with HIV infection became less common since the introduction of cART (i.e., 50% pre-cART as opposed to 35% post-cART; Heaton et al., 2011), the current aging HIV-infected population may be prone to developing age–related neurodegenerative diseases affecting motor systems (Tisch & Brew, 2009). In fact, one study found extrapyramidal motor signs present in HIV individuals undergoing HAART, which were further exacerbated by aging (Valcour et al., 2008). Recent results from a longitudinal multicenter study on neurocognitive functioning in over 5,000 individuals with HIV infection found that, among other domains, motor function was most susceptible to the progression of neurocognitive impairment as a result of aging in individuals with HIV (Goodkin et al., 2017). Possible interactions between immunosenescence and viral loads in HIV may lead to increased risk of brain injury specific to HIV infection, functional brain network degradation, and variations in the nigrostriatal dopaminergic pathway (Jahanshad et al., 2012; Kumar, Ownby, Waldrop-Valverde, Fernandez, & Kumar, 2011; Pfefferbaum et al., 2012; Schulte, Müller-Oehring, Sullivan, & Pfefferbaum, 2012; Thomas, Brier, Snyder, Vaida, & Ances, 2013). These vulnerable subcortical brain structures and pathways are similar to those affected in Parkinson’s disease (PD), the second most common neurodegenerative disorder affecting more than 1% of individuals over 55 years of age and 3% over 75 years of age (Ascherio & Schwarzschild, 2016; Collier, Kanaan, & Kordower, 2017; de Lau et al., 2006; Nichols et al., 2005; Tanner & Aston, 2000). As with HIV infection, aging is a primary independent risk factor to developing parkinsonian symptoms (Tisch & Brew, 2009; Valcour et al., 2008).
PD is characterized by the deterioration of dopaminergic neurons that project from the substantia nigra to basal ganglia-cortical loops (Swainson, Rogers, & Sahakian, 2000). Decreased levels of dopamine in the substantia nigra, as well as the basal ganglia, putamen, and caudate have also been found in HIV, with significant associations between these brain regions and level of performance in measures of motor functioning and speed of IP (Kumar et al., 2011). With these associations is mind, the combined effects of aging and HIV infection may affect frontostriatal circuitry similar to that observed in PD (Ipser et al., 2015; Morgan et al., 2011). In patients with PD, IP speed has been identified as primary frontostriatal cognitive correlate, which may contribute to impairments in other cognitive domains (Price et al., 2016). To test cognitive ability with minimal demands on motor function in PD, it has been recommended that tasks measuring IP speed be administered orally (Marras, Tröster, Kulisevsky, & Stebbins, 2014; Tröster & Browner, 2013). The oral version of the Symbol Digit Modalities Test (SDMT) can be used to accurately assess IP speed in such populations (Sheridan et al., 2006; Smith, 1968, 1982).
This study examined speed of IP using two different measures (i.e., the oral SDMT and color naming condition of the Golden Stroop task) in older HIV-infected individuals compared to PD patients and healthy control subjects (C). We hypothesized: (1) speed of IP would be similarly impaired in HIV and PD compared with C, (2) HIV-infected individuals would show greater motor impairment than C, but not at the level of PD, (3) the degree of impairment in speed of IP in clinical groups (HIV and PD) would be related to age and disease-specific variables. In particular, older age in HIV would add to functional decline over and above normal age effects on cognition and motor processes would be associated with slower information processing speed.
Materials and Methods
Participants
Participants included 26 individuals who were HIV seropositive, 29 individuals who met criteria for mild-to-moderate PD, and 21 healthy controls (C) (see Table 1). Participants with HIV infection were recruited from community physicians and HIV treatment centers. Participants with PD were recruited through Bay Area Parkinson’s disease events, the Michael J. Fox trial finder, and Stanford Departments of Neurology & Neurological Sciences (Drs. Brontë-Stewart and Poston labs). C subjects were recruited from the local community. All procedures were approved by the Institutional Review Boards of SRI International and Stanford University. Written informed consent was obtained prior to participants’ undergoing any study procedures. All participants were financially compensated for their time.
Table 1.
Demographic and Clinical Characteristics of Study Groups
| HIV (n=26) M (SD) |
PD (n=29) M (SD) |
C (n=21) M (SD) |
p-value | Effect Size (η2p, φ, Cohen's d) |
Pair-wise Comparisons |
|
|---|---|---|---|---|---|---|
| Sex (M/F) | 15/11 | 17/12 | 11/10 | nsa | φ=0.053 | |
| Age (yrs) Range |
57.96 (6.34) 47–71 |
65.31 (7.79) 49–79 |
60.95 (8.24) 45–77 |
0.002 | η2p=0.156 | PD > HIV, C |
| Education (yrs) Range |
14.35 (2.30) 10–19 |
16.69 (2.27) 12–21 |
16.19 (2.64) 10–21 |
0.002 | η2p=0.163 | HIV < PD, C |
| SES Range |
37.92 (15.10) 11-69 |
20.45 (8.96) 11-40 |
22.38 (8.74) 11-37 |
0.0001 | η2p=0.336 | HIV > PD, C |
| DOD (yrs) Range |
22.54 (7.96) 3–40 |
4.91 (2.96) 2–14 |
-- | 0.0001b | d=2.99 | HIV > PD |
| DOS (yrs) Range |
-- | 7.99 (4.13) 2–17 |
-- | -- | -- | -- |
| LEDD (mg) Range |
-- | 576.6 (286.5) 100–1440 |
-- | -- | -- | -- |
| CD4 (cells/mm3) Range |
695.2 (333.1) 221–1576 |
-- | -- | -- | -- | -- |
| Nadir CD4 Range |
177.9 (137.7) 0–600 |
-- | -- | -- | -- | -- |
Abbreviations: HIV=HIV infection; PD=Parkinson’s disease; C=healthy controls; M (SD)=mean (standard deviation) M=male; F=female; SES=socioeconomic status (note, lower values indicate higher socioeconomic status); DOD=duration of diagnosis; DOS=duration since first symptoms started; CD4 (t-cell) count per cubic millimeter; nadir CD4=lowest CD4 value in disease history; LEDD=Levodopa equivalent daily dose in mg; ns=not significant; p=significance level (ANOVA, Chi-square, t-test); Pair-wise comparisons: LSD=least significant difference.
Chi-square test
t-test
At the time of testing, all participants were at least 45 years of age and screened for dementia using the Dementia Rating Scale (DRS–2; Jurica, Leitten, & Mattis, 2004). In reference to Springate, Tremont, Papandonatos, & Ott (2014), we used the cutoff score of 136/144 for healthy control subjects. Although all three groups had average DRS–2 scores > 136, the HIV group displayed lower DRS–2 scores than the C group (p=0.008), but did not differ from the PD group’s general cognitive ability, while the PD group showed a trend for lower DRS-2 scores than the C group (p=0.06) (ANCOVA with age as covariate: F(2,71)=3.89, p=0.025; η2p=0.099; Table 2). A MANCOVA was used to test for group differences (HIV, PD-on, C) within the DRS profile (attention, initiation/perseveration, construction, conceptualization, and memory) while controlling for age (covariate). The multivariate result was significant for group differences (Pillai’s trace, F(10,136)=2.21, p=0.02, η2p=0.14). The univariate F tests showed a significant group difference for initiation/perseveration (I/P) and memory (MEM) subscales, with pairwise comparisons indicating lower initiation/perseveration (I/P) scores in HIV than PD and C, and lower memory (MEM) scores in PD than HIV and C (see Table 2). All groups had I/P scores ≥36 and MEM scores of ≥23 and, thus, their performance was within normal limits compared to individuals with mild cognitive impairment or dementia (see Springate et al., 2014).
Table 2.
Test Scores and Group Differences for Measures of General Cognitive and Motor Ability
| HIV M (SD) |
PD-on M (SD) |
PD-offb M (SD) |
C M (SD) |
p-valuea | Effect Size (η2p) |
Pairwise Comparisons Groups [95% CId] p-value |
|
|---|---|---|---|---|---|---|---|
| Cognitive | |||||||
| DRS-2 [CI] |
138.62 (3.95) [137.4, 139.9] |
138.64 (3.11) [137.4, 139.8] |
- | 140.8 (2.02) [139.4, 142.2] |
0.025 | 0.10 | HIV = PD [−2.62, 1.03] ns
HIV< C [−4.36, −0.68] 0.008 PD ≤ C [−3.56, −0.105] 0.064 |
| ATT [CI] |
35.88 (1.37) [35.3, 36.3] |
35.93 (1.12) [35.6, 36.5] |
- | 36.19 (0.81) [35.7, 36.7] |
0.54 | 0.02 | |
| I/P [CI] |
36.00 (1.94) [35.3, 36.3] |
36.43 (0.84) [36.1, 37.1] |
- | 36.71 (0.56) [36.1, 37.2] |
0.046 | 0.08 | HIV< C [−1.59, −0.12] 0.024 HIV < PD [−1.49, −0.03] 0.042 |
| CTR [CI] |
5.81 (0.49) [5.6, 6.0] |
5.79 (0.57) [5.6, 6.0] |
- | 5.95 (0.22) [5.7, 6.1] |
0.42 | 0.02 | |
| CPT [CI] |
37.12 (1.71) [36.4, 37.7] |
37.50 (1.60) [37.0,38.2] |
- | 37.90 (1.30) [37.2, 38.6] |
0.19 | 0.05 | |
| MEM [CI] |
23.81 (1.02) [23.3, 24.3] |
23.00 (1.41) [22.6, 23.5] |
- | 24.05 (0.92) [23.5, 24.6] |
0.012 | 0.12 | PD< C [−1.71, −0.33] 0.004 PD < HIV [−1.44, −0.07] 0.031 |
| Motor | |||||||
| UPDRS I
[CI] |
8.63 (6.20) [6.66, 10.59] |
7.93 (4.71) [6.14, 9.72] |
- | 2.33 (2.73) [0.23, 4.43] |
<0.0001 | 0.25 | HIV = PD [−1.28, 4.37] ns
HIV > C [3.74, 9.47] 0.0001 PD > C [2.52, 7.86] 0.001 |
| UPDRS II [CI] |
2.13 (2.79) [0.11, 4.14] |
9.38 (7.46) [7.54, 11.22] |
10.50 (7.30) [8.46, 12.54] |
0.29 (0.64) [−1.87, 2.44] |
<0.0001 | 0.35 | HIV < PD [−9.2, −3.42] 0.0001 HIV = C [−5.12, 0.76] 0.07 PD > C [5.62, 11.37] 0.0001 |
| UPDRS III
[CI] |
4.04 (4.18) [1.64, 6.45] |
16.55 (8.17) [14.4, 18.7] |
22.34 (9.99) [20.2, 25.1] |
2.05 (3.23) [−0.52, 4.62] |
<0.0001 | 0.52 | HIV < PD [−15.19, −8.23] 0.0001 HIV = C [−1.25, 5.82] ns PD > C [10.54, 17.46] 0.0001 |
| Tremor [CI] |
0.88 (2.07) [−0.16, 1.91] |
5.14 (3.49) [4.20, 6.08] |
7.76 (5.37) [6.26, 9.16] |
0.48 (0.93) [−0.63, 1.58] |
<0.0001 | 0.39 | HIV < PD [−5.60, −2.62] 0.0001 HIV = C [−1.07, 1.95] ns PD > C [3.06, 6.04] 0.0001 |
| Bradykinesia [CI] |
2.21 (2.65) [1.20, 3.22] |
5.17 (2.73) [4.26, 6.09] |
6.83 (3.16) [6.01, 7.99] |
1.14 (1.80) [0.07, 2.22] |
<0.0001 | 0.29 | HIV < PD [−3.96, −1.05] 0.001 HIV > C [−0.16, 2.79] 0.039 PD > C [2.37, 5.27] 0.0001 |
| Ataxia (SARA) [CI] |
1.00 (1.48) [0.34, 1.66] |
2.16 (2.16) [1.55, 2.76] |
2.41 (2.71) [1.61, 3.39] |
0.38 (0.59) [−0.33, 1.09] |
0.004 | 0.14 | HIV ≤ PD [−1.88, 0.01] 0.053 HIV = C [−0.28, 1.64] ns PD > C [0.67, 2.56] 0.001 |
Abbreviations: M=mean, (SD)=standard deviation; CI=95% confidence interval; CId= confidence interval for difference; DRS–2=Dementia Rating Scale-2nd Edition (DRS–2; Jurica, Leitten, & Mattis, 2004), ATT indicates attention; I/P, initiation/perseveration; CTR, Construction; CPT, Conceptualization; MEM, Memory.; Scale for Assessment and Rating of Ataxia (SARA; Schmitz-Hübsch et al., 2006); Unified Parkinson’s Disease Rating Scale (UPDRS) part I (mentation, non-motor aspects of daily living), part II (motor aspects of daily living), part III (motor exam) (Fahn & Elton, 1987)
ANCOVA and MANCOVAs using age as covariate comparing HIV, PD-on, and C; pairwise comparisons with LSD adjustment for multiple comparisons.
PD showed fewer motor symptoms on– than off–dopaminergic medication for UPDRS-III, bradykinesia, and tremor (paired samples t-tests).
Participants were excluded if they had not completed at least 8 years of education or had a history of psychiatric (e.g., schizophrenia or bipolar disorder), neurological (other than PD), or medical conditions potentially affecting the CNS (e.g., stroke, diabetes) other than HIV, or MRI contraindications. Inclusion of PD patients was based on disease duration (≥ 2 years) and motor improvement on–medication measured by the Movement Disorder Society – Unified Parkinson’s Disease Rating Scale (MDS–UPDRS) part III, as determined by a neurologist. Inclusion of HIV patients was based on a seropositive HIV test and at least 2 months of continuous ART. C subjects were excluded if they tested positive for HIV or hepatitis C virus, had an abnormal neurological exam, or had a history of psychiatric or neurological disease.
Demographics and Clinical Characteristics.
Demographic and clinical characteristics of the study groups are presented in Tables 1 and 2. Groups differed significantly in age and education. The PD group was older than the C and HIV groups, and the HIV group had lower education level than both the C and PD groups. On average, the HIV group had significantly lower socioeconomic status (SES) (i.e., higher scores indicate lower SES) than both C and PD groups. SES was determined using a 2-factor scale that includes education and lifetime occupation (Hollingshead & Redlich, 1958) and can be considered a representative measure of the highest functioning achieved (Sassoon et al., 2007). Disease duration was measured in years since diagnosis and was, on average, 23 years for the HIV group and 5 years for the PD group. For PD participants, first symptoms were reported to have occurred, on average, 8 years prior to study participation. For HIV participants, blood samples were collected to determine disease progression markers and confirm HIV status. All HIV subjects were on HAART and adhered to treatment. Of the 26 HIV subjects, 19 individuals (73%) reported at least one AIDS–defining event in their medical history, such as Coccidiomycosis (disseminating or extrapulmonary) (n=2), Herpes Simples Virus more than one month, Herpes Simplex Chronic Ulcers more than one month in duration (n=2), Mycobacterium Tuberculosis (n=2), Kaposi’s Sarcoma (n=1), Pneumocystis Carinii Pneumonia (n=3), Pneumonia, recurrent (n=1), Wasting Syndrome due to HIV (n=4), and CD4 blood cell count less than 200 cells/mm3 (n=16) at any time since HIV infection (Nadir CD4). At the time of testing, viral loads were undetectable in 17 HIV participants (81%; n=21 with viral load data), none had a CD4 count of cells/mm3< 200 (n=24 with CD4 data), and the average CD4 T cell count was 695.2 cells/mm3 (see Table 1). CD4 counts correlated with lower general cognitive ability (DRS-2 total raw score) (Rho=.39, p=0.031), mainly driven by the relationship in the ‘conceptualization’ subtest (Rho=.50, pcorrected=0.03).
All participants underwent a neurological examination and clinical motor exam by a movement disorder specialist or trained assistant at the Stanford Movement Disorders Center. The PD group exhibited more severe motor symptoms than both the HIV and C groups in the UPDRS-III motor exam, bradykinesia, tremor, and ataxia (MANCOVA with age as covariate; Pillai’s Trace F(12,132)=7.79, p<0.0001, η2p=.415). The HIV group exhibited more bradykinesia symptoms than the C group (p=0.039). Regarding aspects of daily living, HIV had more difficulties in non–motor aspects of daily living (UPDRS part I) and less difficulties in motor aspects of daily living (UPDRS part II) than PD (Table 2). For PD participants, disease severity was determined using clinical motor exams while on and off dopaminergic medication. Fewer motor symptoms were observed on– than off–dopaminergic medication (UPDRS–III: t(28)=−4.414, 95% CId [−8.48, −3.11], p<0.0001; r=0.641; bradykinesia: t(28)=−4.193, 95% CId [−2.46, −0.85], p<0.0001; r=0.62; tremor: t(28)=−3.104, 95% CId [−4.35, −0.89], p=0.004; r=0.51) (Table 2). PD subject’s medication involved a combination of MAO-B inhibitors, dopamine agonists (DA), and/or levodopa (l-dopa). Levodopa equivalent daily dosage (LEDD) was calculated from the treatment regimen for each PD participant (Herzog et al., 2003; Lozano et al., 1995) and was, on average, 577mg (100-1440mg) (see Table 1). More severe bradykinesia in the off–dopaminergic state was associated with longer disease duration (Rho=.36, p=0.026) and higher LEDD (Rho=.49, p=0.008) (i.e., PD with more bradykinesia off-medication received higher levodopa-equivalent daily doses).
Procedure
All participants were screened using the Structured Clinical Interview for DSM–IV (SCID-IV; First, Spitzer, Gibbon, & Williams, 1998), underwent motor testing (on- and off-dopaminergic medication for PD), a neurological examination with a trained clinician, and a neuropsychological battery including the Dementia Rating Scale (DRS–2), the oral version of the Symbol Digit Modalities Test (SDMT), and the Golden Stroop (color naming condition). To reduce the influence of motor deficits on cognitive measures in PD (when off-medication), we examined cognitive functions while PD participants were on dopaminergic medication.
Motor Examination.
MDS–UPDRS (Fahn & Elton, 1987): This rating scale is divided into three parts: part I (subscale ‘mentation’; non–motor aspects of daily living), part II (subscale ‘daily living’; motor aspects of daily living), and part III (subscale ‘motor’; motor exam). Participants were also administered the Scale for Assessment and Rating of Ataxia (SARA; Schmitz-Hübsch et al., 2006) to determine ataxic motor signs in HIV, PD, and older C participants. The SARA was originally developed for assessing autosomal dominant cerebellar ataxias, but has been shown to be useful in evaluating cerebellar ataxias overall (Yabe, Matsushima, Soma, Basri, & Sasaki, 2008). The cerebellum contributes to pathological and compensatory mechanisms in PD (Wu & Hallett, 2013) and demonstrates a more rapid progressive brain atrophy (among other regions such as the caudate, pallidum, and frontal lobe) in older HIV patients (> 60 years), compared to healthy aging counterparts, despite persistent viral suppression (Clifford et al., 2017). Participants were scored on 8 composite subscales: gait, stance, sitting, speech disturbance, finger chase (dysmetria), nose-finger test (tremor), fast alternating hand movement, and heel-shin slide to obtain a semi-quantitative scaled score (Marelli et al., 2012; Schmitz-Hübsch et al., 2006).
Speed of IP.
Speed of IP was measured using the oral SDMT and color naming condition of the Golden Stroop Test. Each assessment was administered and scored according to standardized instructions. All participants were administered the:
(a) SDMT, the Symbol Digit Modalities Test (Smith, 1968, 1982). This measure of IP speed assesses divided attention, visual scanning, tracking, and motor speed and is sensitive to a number of psychiatric and neurologic conditions, including HIV (Applebaum et al., 2009; Sacktor et al., 1999; Sacktor et al., 2003). The SDMT can be given in an oral format, which provides a verbal modality of processing speed (Larrabee, 2014). The task consists of a sheet with boxes that are filled with symbols and empty boxes underneath these symbols. At the top of the test sheet, a legend of the nine symbols is provided in numerical order. The objective is to name the number that corresponds to the respective symbol. Study participants were given 90 seconds to orally indicate which number correctly matches each symbol. SDMT-oral scores are the sum of correct responses in 90 seconds (total score), ranging from 0–129, as well as the sum of correct responses from each 15–second interval (subscores at 15, 30, 45, 60, 75, and 90 seconds) (Sassoon et al., 2007).
(b) Color Naming, a condition of the Golden Stroop Task (Golden, 1978). The Golden Stroop task assesses verbal speed of information processing and inhibition from color–word interference. There are three timed subtests: word reading, color naming, and color-word interference. We utilized the total score from the color naming condition to assess the participants’ speed of IP when naming the color of items (XXXX) printed in red, green, and blue font on a sheet of paper. Each assessment was administered and scored according to standardized instructions. Similar to the SDMT, the color naming condition of the Golden Stroop task assesses verbal processing speed independent of individual motor ability or impairment. As such, it serves as a complementary measure for validating oral SDMT IP speed performance in HIV and PD.
Age– and Education–corrected Z–scores.
For SDMT and the color naming condition of the Golden Stroop task, speed of IP scores were statistically corrected for age and education and standardized on the C group (mean and standard deviation for C group: Z=0+1), allowing direct comparisons between groups and across tests. Lower Z–scores always indicate worse performance.
Statistical Analyses.
For between–group differences, unvariate and multivariate analyses of variance (ANOVA, MANOVA) were used. To examine whether HIV and PD patients differed from C in their speed of IP for the SDMT task, overall and throughout the time of the task, a repeated-measures ANOVA was used with SDMT time points (e.g., 15–second intervals) as the repeated–measures factor and the HIV, PD, and C groups as the between–subject factor. For significance of group effects, post–hoc least significant differences (LSD) tests examined differences between group means. Paired samples t–tests were used to examine mean differences in motor ability for PD patients on– and off–dopaminergic medication. For all correlation analyses, Spearman’s Rho correlation was used. Stepwise multiple regression analyses were used to identify the specific cognitive functions (as tested with the DRS subscales) contributing to IP speed performance in the HIV, PD, and C groups. For all IP speed measures, standardized scores correcting for normal effects of aging and influences of education were used. An alpha level of p<0.05, 2–tailed was used for all statistical tests. For correlation analyses testing directional hypotheses regarding older age and disease severity, we used 1-tailed significances. We further applied Holm’s Sequential Bonferroni Procedure to correct for multiple comparisons (Holm, 1979).
Results
SDMT IP Speed
A repeated measures ANOVA with six SDMT time points (performance at 15, 30, 45, 60, 75, and 90 seconds) as the within-subjects factor and participant group (HIV, PD, C) as the between-subjects factor showed a significant main effect for group differences in SDMT IP speed (F(2,71)=11.05, p<0.0001; η2p=0.237). LSD post–hoc analyses revealed slower IP speed for HIV compared to PD and C, respectively (p<0.0001), while PD and C did not differ from each other (Table 2). A non-linear main effect for SDMT task condition (quadratic: F(1,71)=15.664, p<0.0001, η2p=0.181; order 4: F(1,71)=5.261, p=0.025, η2p=0.069) indicated significant variations in SDMT performance over time. A significant interaction between group and SDMT time points (linear: F(2,71)=5.886, p=0.004, η2p=0.142; quadratic: F(2,71)=5.614, p=0.005, η2p=0.137; order 4: F(2,71)=5.136, p=0.008, η2p=0.126) indicated that groups differed in SDMT performance with HIV showing slower IP speed and higher performance variability over time compared to C and PD (Figure 1). Follow–up testing on group differences for each time point (MANOVA; Pillai’s Trace F(12,134)=2.68, p=0.003, η2p=.194) indicated no significant IP speed difference at the beginning of the task, but for the following time points (Table 3). Here, HIV displayed slower IP speed than C and PD. PD did not differ from C (all p’s > 0.2). Group differences in SDMT IP speed were confirmed when controlling for general cognitive ability using DRS-2 total scores as a covariate (group effect: F(2,69)=10.41, p<0.0001, η2p=0.232; group-by-SDMT time point interaction: linear F(2,69)=5.23, p=0.004, η2p=0.132; quadratic F(2,69)=4.632, p=0.013, η2p=0.118; order 4 F(2,69)=4.811, p=0.011, η2p=0.122) (Pillai’s trace F(10,132)=2.38, p=0.009). HIV and PD groups further differed in their disease duration, i.e., the time since diagnosis, which was on average 23 years in HIV as opposed to 5 years in PD. Nevertheless, when using disease duration as a covariate, we still found the reported IP speed group difference between HIV and PD (SDMT: F(1,51)=4.868, p=0.032, η2p=0.087).
Figure 1. SDMT IP speed:
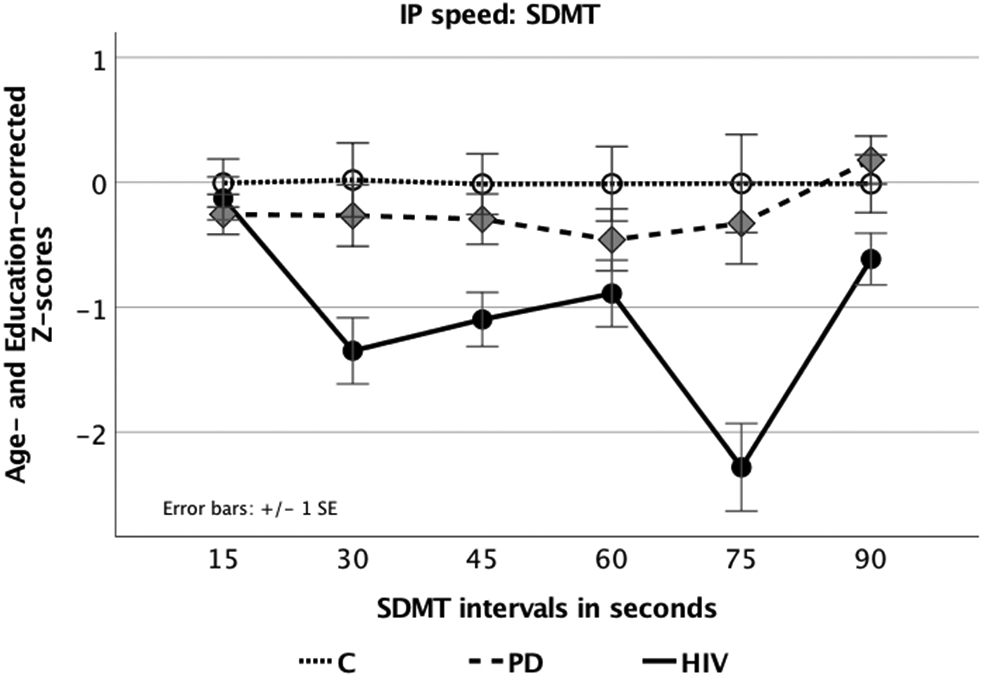
Line graph displaying age– and education–corrected Z–scores for SDMT performance in 15–second intervals for all groups (Symbol Digit Modalities Test, SDMT; Smith, 1968, 1982).
Table 3.
Test Scores and Group Differences for IP Speed Measures
| HIV M (SD) |
PD-on M (SD) |
C M (SD) |
F (2,71) value |
p-value | Effect Size (η2p) |
Pairwise Comparisons Groups [95% CId] p-value |
|
|---|---|---|---|---|---|---|---|
| SDMT a
CI] |
−1.22 (1.09) [−1.68, −0.77] |
−0.35 (1.16) [−0.75, 0.06] |
−0.01 (1.04) [−0.50, 0.48] |
11.05 | <0.0001 | 0.24 | HIV < C [−1.54, −0.569] 0.0001 HIV < PD [−1.26, −0.380] 0.0001 PD = C [−0.703, 0.238] ns |
| 15 sec | −0.13 (0.75) [−0.47, 0.22] |
−0.26 (0.8) [−0.58, 0.06] |
−0.01 (1.05) [−0.39, 0.38] |
0.511 | 0.602 | 0.01 | |
| 30 sec | −1.35 (1.5) [−0.19, −0.82] |
−0.27 (1.35) [−0.76, 0.22] |
0.02 (1.03) [−0.57, 0.61] |
7.049 | 0.002 | 0.17 | HIV < C [−2.16, −0.58] 0.001 HIV > PD [−1.80, −0.360] 0.004 PD = C [−1.05, 0.48] ns |
| 45 sec | −1.1 (1.24) [−1.53, −0.67] |
−0.3 (0.97) [−0.7, 0.11] |
−0.01 (1.03) [−0.5, 0.47] |
6.316 | 0.003 | 0.15 | HIV < C [−1.73, −0.44] 0.001 HIV < PD [−1.39, −0.213] 0.008 PD = C [−1.91, 0.35] ns |
| 60 sec | −0.89 (1.51) [−1.42, −0.36] |
−0.46 (1.36) [−0.96, 0.04] |
−0.01 (1.02) [−0.61, 0.58] |
2.413 | 0.097 | 0.06 | HIV < C [−1.67, −0.080] 0.008 HIV = PD [−1.16, 0.296] ns PD = C [−1.22, 0.33] ns |
| 75 sec | −2.28 (1.76) [−2.98, −1.58] |
−0.33 (2.12) [−0.98, 0.32] |
−0.01 (1.01) [−0.79, 0.77] |
11.862 | <0.0001 | 0.25 | HIV < C [−3.32, −1.22] 0.0001 HIV < PD [−2.92, −0.10] 0.0001 PD = C [−1.34, 0.7] ns |
| 90 sec | −0.61 (1.12) [−1.03, −0.2] |
−0.18 (0.94) [−0.21, 0.56] |
−0.01 (1.05) [−0.98, 0.32] |
4.154 | 0.02 | 0.11 | HIV < C [−1.22, −0.02] 0.056 HIV < PD [−1.36, −0.23] 0.006 PD = C [−0.41, 0.79] ns |
| Color Namingb
[CI] |
−0.96 (1.46) [−1.45, −0.47] |
−0.21 (1.04) [−0.65, 0.24] |
−0.01 (1.05) [−0.53, 0.51] |
4.592 | 0.013 | 0.11 | HIV < PD [−1.44, −0.139] 0.018 HIV < C [−1.69, −0.279] 0.007 PD = C [−0.88, 0.49] ns |
Abbreviations: HIV=HIV infection; PD=Parkinson’s disease; C=controls; M (SD)=mean (standard deviation); CI=95% confidence interval; CId= confidence interval for difference; Symbol Digit Modalities Test (SDMT; Smith, 1968, 1982); Color Naming (Golden, 1978).
repeated-measures ANOVA and follow-up MANOVA.
ANOVA and using standardized Z scores (age- and education-corrected) comparing HIV, PD-on, and C. (M)ANOVAs pairwise comparisons with LSD adjustment for multiple comparisons.
Color Naming IP Speed
Group differences were observed for color naming IP speed (F(2,71)=4.592, p=0.013; η2p=0.113), with post–hoc LSD analyses showing lower scores for the HIV group compared to both the PD (p=0.018) and C groups (p=0.007), similar to results observed for speed of IP on the SDMT (Table 3). Group differences were confirmed for color naming IP speed when controlling for general cognitive ability using DRS-2 total scores as a covariate (F(2,70)=3.658, p=0.031; η2p=0.095).
Correlation between IP Speed Measures.
The two IP speed measures, independently derived from two different tasks (e.g., the SDMT and the color naming condition of the Golden Stroop test) were significantly correlated with each other in the clinical groups (HIV, Rho=.677, p<0.0001; PD, Rho=.708, p<0.0001) but not in the control group (C, Rho=.349, p=0.13) (Figure 2).
Figure 2. IP speed.
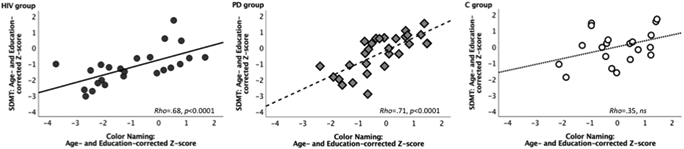
Scatterplots displaying correlations between age– and education–corrected Z–scores for SDMT total score and Color Naming (condition of the Golden Stroop test) total score in HIV–infected individuals, patients with Parkinson’s disease (PD), and healthy controls (C).
IP Speed and Older Age in HIV
In testing for effects of aging in HIV, over and above normal effects of age, on IP speed by using standardized age– and education–corrected measures (Z–scores), we found that older age in the HIV group significantly correlated with slower speed of IP at the beginning of the SDMT (see Figure 3) (i.e., 15–second interval) (Rho=−.478, pcorrected=0.048), but not significantly in the PD group (15–second interval: Rho=−.314, pcorrected=0.19).
Figure 3. IP Speed and Age.
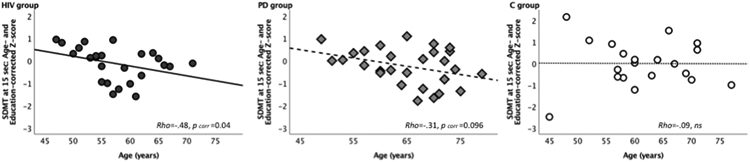
Scatterplots displaying significant correlations between age (years) and age– and education–corrected Z–scores for SDMT performance at the outset of the task (i.e., 15-second interval) HIV-infected individuals, patients with Parkinson’s disease (PD), and healthy controls (C), testing the directional hypothesis of poorer performance with older age, over and above normal aging effects (corrected for multiple comparisons, pcorr).
IP Speed and General Cognitive Ability
Cognitive ability (DRS–2 total raw score) was significantly related to processing speed in HIV (SDMT oral: Rho=.54, pcorrected=0.01; Golden Stroop color naming: Rho=.46, pcorrected=0.02). In PD, SDMT IP speed was not significantly correlated, but showed a trend, with DRS-2 scores (SDMT oral: Rho=.41, pcorrected=0.06, but not Golden Stroop color naming: Rho=.12, ns), while in controls, IP speed and cognitive ability was not significantly related (SDMT oral: Rho=.41, pcorrected=0.15; Golden Stroop color naming: Rho=.29, ns) (see Figure 4).
Figure 4. IP Speed and Cognitive Ability.

Scatterplots displaying correlations between A. SMDT and DRS–2 scores and B. Color Naming and DRS-2 scores in individuals with HIV infection, Parkinson’s disease (PD) and healthy controls (C) (corrected for multiple comparisons, pcorr).
In exploring the contribution of DRS-2 subscales to IP speed, a stepwise multiple regression for SDMT revealed that memory (MEM) (t=2.89) explained 27% of the IP speed variance in HIV (F(1,23)=8.34, p=0.008, R2=0.27), while initiation/perseveration (I/P) (t=3.59, p=0.001) and attention (ATT) (t=2.55, p=0.017) together explained 41% percent of the variance in PD (F(1,25)=8.70, p=0.001, R2=0.41). We specifically explored these DRS-2 subscales’ contributions for the 75s SDMT time point, for which the HIV group showed marked poor performance, and found MEM (t=4.17) to be the sole predictor for the SDMT performance in HIV (F(1,23)=17.37, p<0.0001, R2=0.41). For color naming, by contrast, attention (ATT) (t=2.79, p=0.001) explained 25% percent of the IP speed variance in HIV F(1,25(=13.64, p=0.01, R2=0.25). In PD, again I/P (t=3.89, p=0.001) and ATT (t=3.69, p=0.001) together explained 51% percent of the color naming IP speed variance (F(1,25)=13.64, p=0.001, R2=0.51). DRS subscale performance did not predict IP speed in C (all regression models, ns).
IP Speed and Motor Ability
Motor exam.
In HIV, slower oral IP speed correlated with higher UDPRS-III motor scores (SDMT Rho=−.41, pcorrected=0.042; Color Naming Rho=−.41, pcorrected=0.042; 1-tailed), similar to the relationship observed in the PD group (PD: SDMT Rho=−.34, pcorrected=0.035; Color Naming Rho=−.50, pcorrected=0.006; but not in C: SDMT Rho=−.34, ns; Color Naming Rho=−.00, ns).
Bradykinesia.
In HIV, slower oral IP speed correlated with more severe bradykinesia (SDMT Rho=−.41, pcorrected=0.046; Color Naming Rho=−.39, pcorrected=0.046), a relationship also observed in the PD group (SDMT Rho=−.386, pcorrected=0.036; Color Naming Rho=−.393, pcorrected=0.036; but not in C: SDMT Rho=−.21, ns; Color Naming Rho=.02, ns) (Figure 5).
Figure 5. IP Speed and Motor Ability.


Scatterplots displaying correlations between A. standardized SDMT IP speed, B. standardized Color Naming IP speed, (age– and education–corrected Z–scores, lower values denote slower speed) and bradykinesia scores (higher values denote greater symptom severity), C. Color Naming IP speed and UPDRS-III scores (higher values denote more motor problems), D. Color Naming IP speed and ataxia scores (higher values denote more difficulty) in individuals with HIV infection and Parkinson’s disease (PD), but not in healthy control subjects (C) (corrected for multiple comparisons, pcorr).
Tremor.
IP speed measures were not related to tremor severity (HIV: SDMT Rho=0.05, ns; Color Naming Rho=−.14, ns; PD: SDMT Rho=−.04, ns; Color Naming Rho=−.22, ns; C: SDMT Rho=−.31, ns; Color Naming Rho=−.08, ns).
Ataxia.
Slower Color Naming IP speed was correlated with higher SARA scores in HIV (Color Naming Rho=−.57, pcorrected=0.004; SDMT Rho=−.32, pcorrected=0.062), and in PD (SDMT Rho=−.38, pcorrected=0.023; Color Naming Rho=−.42, pcorrected=0.022). In C, slower SDMT IP speed correlated with ataxia (SDMT Rho=−.47, pcorrected=0.036; Color Naming Rho=−.15, ns).
Motor Ability and Age.
In healthy controls, older age was associated with more tremor (Rho=.56, pcorrected=0.016). In HIV, the relationship with age was modest for tremor (Rho=.45, pcorrected=0.052) and ataxia (Rho=.41, pcorrected=0.063). No such associations were observed in PD (all p’s>0.05).
Discussion
Although the development of HAART has provided the benefit of increased life expectancy in aging populations with HIV infection, the consequences of this virus still produces detectable cognitive and physical sequelae (Heaton et al., 2011; Morgan et al., 2011). The added risk of neurological and psychological vulnerabilities to collective effects of aging and HIV infection still remains unclear. Our data partly support the findings of others suggesting an increased risk for individuals with HIV infection to develop cognitive and motor deficits as they reach middle and older ages (Brew, Crowe, Landay, Cysique, & Guillemin, 2009). This study highlights the gap in our understanding of the long-term effects of aging with HIV infection, and how it compares to age–related neurodegenerative diseases. Here, we examined older HIV adults, ranging between 47–and 71–years of age, who have lived with HIV infection for, on average, 23 years (range 3–40 years).
Research on IP speed has primarily assessed psychomotor speed through tasks, which include a motor component. We used the oral version of the SDMT to eliminate hand and arm motor involvement, consistent with guidelines for cognitive assessment in PD (Marras et al., 2014; Tröster & Browner, 2013). IP speed in our sample of older HIV–infected participants was impaired relative to older healthy controls and individuals with PD. Although all three groups (HIV, PD, C) started out on comparable performance levels, only the HIV group performance dropped considerably within 30–seconds of the task. Furthermore, IP speed in the HIV group remained impaired with considerable variation over the test duration. Impaired IP speed in HIV relative to healthy controls and PD was validated by significantly slower performance in color naming, a subtest of the Golden Stroop test. HIV and PD groups displayed positive correlations between the two oral IP speed measures, the SDMT and the color naming subtest, validating that both assessed IP speed in clinical samples and IP speed impairment in HIV.
Our oral IP speed measures provided some indication for additional aging effects in our older HIV subject sample. After correction for normal age and education effects, older age was associated with slower IP speed at the beginning of the SDMT task (i.e., the 15–second interval) in the HIV group. Slower IP speed in HIV was further associated with general cognitive compromise, as indicated by lower DRS–2 scores, and also motor control, as indicated by higher UDPRS-III motor and bradykinesia scores. Moreover, associations were found among biological immune system markers (CD4 counts) and general cognitive ability. These findings are in agreement with findings from prior studies (Baldewicz et al., 2004; Becker et al., 1997; Heaton et al., 2011; Hinkin et al., 2004; Reger et al., 2002) and support the idea that augmented IP slowing can mark cognitive decline in older HIV–infected individuals.
HIV also showed marked fluctuations in SDMT performance (e.g., the 75–second interval). We found that attention and memory ability can in part explain the overall slowed IP speed in HIV and memory in particular the SDMT fluctuations. Other contributing factors, that were not tested in this study, might include subclinical electrical dysregulation, fluctuations in arousal and task focus related to impaired nighttime sleep, and abnormal susceptibility to distraction from internal or external stimuli. Thus, the IP impairment is at least exacerbated by influences that can vary across time, which may be important to our understanding of the neuropsychological presentation of chronic HIV. As adequate processing speed is fundamental to normal cognitive functioning, significant IP slowing and fluctuation could be an indicator for emerging deficits in a wide variety of cognitive domains including attention, memory, executive function, or even comprehension of complex grammatical language as it requires extra processing time, both in formal testing and in real-world situations.
In the era of HAART, HIV–infection has evidenced the development of parkinsonism (Tisch & Brew, 2009; Devine, Herrin, Warnack, & Dubey, 2018), with symptoms worsening with older age (Valcour et al., 2008). In our study, all groups differed on all three parts of the MDS–UPDRS. Both HIV and PD groups reported more problems for non–motor aspects of daily living (part I) than control subjects; the HIV group reported some difficulties with motor aspects of daily living (part II) although to a lesser extent than the PD group. Motor symptoms are key features of PD (Jankovic, 2008). Accordingly, the PD group in our study experienced more severe symptoms as evidenced in the motor exam (part III) than the HIV and C groups. As expected, motor symptom severity in the PD group was less pronounced in the on- compared to the off-dopaminergic state showing better ability on the UPDRS-III motor exam, less bradykinesia, and less severe tremor. Here, the individual levodopa-equivalent daily dose was directly related to bradykinesia severity off-medication.
Although this study could not investigate dopaminergic involvement for motor signs in our HIV-infected individuals, it has been reasoned that possible interactions between immunosenescence and viral loads in HIV can augment the risks of HIV–related brain degeneration, deteriorating functional neural connectivity, and nigrostriatal dopaminergic pathway dysfunction (Jahanshad et al., 2012; Kumar et al., 2011; Pfefferbaum et al., 2012; Schulte et al., 2012; Thomas et al., 2013), with similar motor characteristics exhibited in PD progression. More extrapyramidal symptoms were observed in HIV than controls, in particular bradykinesia, a main characteristic in PD (Jankovic, 2008). This is consistent with previous findings by Valcour et al. (2008) showing that bradykinesia and postural/action tremor were most strongly associated with aging in HIV. Thus, our findings partially support the notion that individuals aging with HIV–infection may have an increasing likelihood, even with HAART and largely effective viral suppression, to develop parkinsonian symptoms similar to those observed in neurodegenerative diseases (Brew et al., 2009). Furthermore, in both clinical groups, standardized oral IP speed measures were associated with UPDRS-III motor symptoms and bradykinesia. Together, the notable effects of impaired speed of IP, over and above neurotypical age–related declines, indicate that older HIV–infected individuals may have an enhanced vulnerability for developing non–motor and motor symptoms despite antiretroviral therapy. However, longitudinal studies are warranted to confirm these speculations.
Our findings on impaired IP speed in aging HIV–infected individuals need to be interpreted in light of limitations, such as sample size and the cross–sectional nature of the study. The moderate sample size of our subgroups may have obscured significant findings on the relationship between disease history (e.g., immune system markers), aging, clinical motor signs, and processing speed. Although moderately significant associations were observed among these variables, the degree to which they mark disease trajectories in relation to immune status and increase cognitive and motor system vulnerability in those aging with HIV–infection in the era of ART awaits longitudinal study.
In conclusion, the current study demonstrated impaired IP speed and signs for cognitive and motor functional vulnerabilities in older individuals with HIV–infection, over and above that explained by normal age–related slowing. Poorer performance on speed of IP in older HIV–infected individuals was shown in two separate tasks, but not observed in the PD. Furthermore, IP impairment was correlated with poorer current overall cognitive ability, even after accounting for normal age effects on IP speed, and with extrapyramidal signs in the HIV group. Overlapping age–related and disease–specific patterns in HIV-infected individuals can have clinical implications related to cognitive ability and motor functioning. Assessing for oral IP speed may provide the unique opportunity to identify early signs of functional compromise in HIV despite ART. Earlier detection of IP slowing may inform further diagnostic and treatment recommendations such as speed of IP training in this vulnerable population of older HIV-infected individuals.
Public Significance Statement: The results of this study demonstrate a significant slowing of IP speed in older HIV-infected individuals, even after accounting for normal age–related decline, as an index of cognitive and motor functions. Assessing for speed of IP may provide a unique opportunity to identify early signs of cognitive and motor compromise in those aging with HIV in the era of antiretroviral therapy (ART). Early detection of marked IP slowing may allow for speed of processing training interventions to address dementia and motor compromise in this vulnerable population of older individuals.
Acknowledgments
This work was supported by National Institutes of Health (NIH)/National Institute on Alcohol Abuse and Alcoholism (NIAAA) Grants R01 AA023165 (TS), U01 AA017347 (AP), KO5 AA017168 (EVS), NIH/National Institute of Neurological Disorders and Stroke (NINDS) K23 NS075097 (KLP), and Michael J. Fox Foundation for Parkinson’s Research (KLP).
The authors wish to thank Priya Asok, Ember Kalon, Eden Gallanter, Gilbert Hong, and Stephanie Sassoon for assistance with recruitment, screening, clinical interviewing, and testing of study participants and Weiwei Chu for assistance with data management.
Footnotes
Prior dissemination of a portion of the data and narrative interpretations of the data/research appearing in the manuscript were presented at the 46th Annual Meeting of the International Neuropsychological Society in Washington, D.C. in February 2018.
References
- Applebaum AJ, Reilly LC, Gonzalez JS, Richardson MA, Leveroni CL, & Safren SA (2009). The impact of neuropsychological functioning on adherence to HAART in HIV-infected substance abuse patients. AIDS Patient Care and STDs, 23(6), 455–462. 10.1089/apc.2008.0181 [DOI] [PMC free article] [PubMed] [Google Scholar]
- Ascherio A, & Schwarzschild MA (2016). The epidemiology of Parkinson’s disease: Risk factors and prevention. The Lancet Neurology, 15(12), 1257–1272. 10.1016/S1474-4422(16)30230-7 [DOI] [PubMed] [Google Scholar]
- Baldewicz TT, Leserman J, Silva SG, Petitto JM, Golden RN, Perkins DO, … Evans DL (2004). Changes in neuropsychological functioning with progression of HIV-1 infection: Results of an 8-year longitudinal investigation. AIDS and Behavior, 8(3), 345–355. 10.1023/B:AIBE.0000044081.42034.54 [DOI] [PubMed] [Google Scholar]
- Becker JT, Sanchez J, Dew MA, Lopez OL, Dorst SK, & Banks G (1997). Neuropsychological abnormalities among HIV-infected individuals in a community-based sample. Neuropsychology, 11(4), 592–601. 10.1037/0894-4105.11.4.592 [DOI] [PubMed] [Google Scholar]
- Brew BJ, Crowe SM, Landay A, Cysique LA, & Guillemin G (2009). Neurodegeneration and ageing in the HAART era. Journal of Neuroimmune Pharmacology, 4(2), 163–174. 10.1007/s11481-008-9143-1 [DOI] [PubMed] [Google Scholar]
- Centers for Disease Control and Prevention [CDC]. (2015). Diagnoses of HIV infections in the United States and dependent areas. HIV Surveillance Report, 27(27), 1–114. 10.1017/CBO9781107415324.004 [DOI] [Google Scholar]
- Clifford DB, & Ances BM (2013). HIV-associated neurocognitive disorder. The Lancet Infectious Diseases, 13(11), 6–86. 10.1016/S1473-3099(13)70269-X [DOI] [PMC free article] [PubMed] [Google Scholar]
- Clifford KM, Samboju V, Cobigo Y, Milanini B, Marx GA, Hellmuth JM, … Valcour VG (2017). Progressive brain atrophy despite persistent viral suppression in HIV patients older than 60 years. Journal of Acquired Immune Deficiency Syndromes, 76(3), 289–297. 10.1097/QAI.0000000000001489 [DOI] [PMC free article] [PubMed] [Google Scholar]
- Cody SL, Fazeli PL, & Vance DE (2015). Feasibility of a home-based speed of processing training program in middle-aged and older adults with HIV. Journal of Neuroscience Nursing, 47(4), 247–254. 10.1097/JNN.0000000000000147 [DOI] [PMC free article] [PubMed] [Google Scholar]
- Collier TJ, Kanaan NM, & Kordower JH (2017). Aging and Parkinson’s disease: Different sides of the same coin? Movement Disorders, 32(7), 983–990. 10.1002/mds.27037 [DOI] [PMC free article] [PubMed] [Google Scholar]
- de Lau LML, Breteler MMB, Greenamyre J, Hastings T, Litvan I, Bhatia K, … Al E (2006). Epidemiology of Parkinson’s disease. The Lancet Neurology, 5(6), 525–35. 10.1016/S1474-4422(06)70471-9 [DOI] [PubMed] [Google Scholar]
- Devine MF, Herrin C, Warnack W, Dubey D (2018). Novel use of levodopa in human immunodeficiency virus encephalopathy-mediated parkinsonism in an adult. Journal of Postgraduate Medicine, 64(1):53–55. doi: 10.4103/jpgm.JPGM_674_16. [DOI] [PMC free article] [PubMed] [Google Scholar]
- Fahn S, & Elton R (1987). Unified Parkinson’s disease rating scale (UPDRS) In Fahn D, Marsden C, Calne D, & Goldstein M (Eds.), Recent Developments in Parkinson’s Disease (pp. 153–163). Florham Park, NJ: Maacmillan Healthcare Information. [Google Scholar]
- Fellows RP, Byrd DA, & Morgello S (2014). Effects of information processing speed on learning, memory, and executive functioning in people living with HIV/AIDS. Journal of Clinical and Experimental Neuropsychology, 36(8), 806–817. 10.1080/13803395.2014.943696 [DOI] [PMC free article] [PubMed] [Google Scholar]
- First MB, Spitzer R, Gibbon M, & Williams JB (1998). Structured clinical interview for DSM-IV axis I disorders (SCID) version 2.0. New York, NY: Biometrics Research Department, New York State Psychiatric Institute. [Google Scholar]
- Golden CJ (1978). Stroop color and word test: A manual for clinical and experimental uses. Chicago, IL: Stoelting Co. [Google Scholar]
- Goodkin K, Miller EN, Cox C, Reynolds S, Becker JT, Martin E, … Sacktor NC (2017). Effect of ageing on neurocognitive function by stage of HIV infection: Evidence from the Multicenter AIDS Cohort Study. The Lancet HIV, 4(9), e411–e422. 10.1016/S2352-3018(17)30098-X [DOI] [PMC free article] [PubMed] [Google Scholar]
- Heaton RK, Franklin DR, Ellis RJ, McCutchan JA, Letendre SL, LeBlanc S, … Grant I (2011). HIV-associated neurocognitive disorders before and during the era of combination antiretroviral therapy: Differences in rates, nature, and predictors. Journal of NeuroVirology, 17(1), 3–16. 10.1007/s13365-010-0006-1 [DOI] [PMC free article] [PubMed] [Google Scholar]
- Herzog J, Volkmann J, Krack P, Kopper F, Potter M, Lorenz D, … Deuschl G (2003). Two-year follow-up of subthalamic deep brain stimulation in Parkinson’s disease. Movement Disorders, 18(11), 1332–1337. 10.1002/mds.10518 [DOI] [PubMed] [Google Scholar]
- Hinkin CH, Hardy DJ, Mason KI, Castellon SA, Durvasula RS, Lam MN, & Stefaniak M (2004). Medication adherence in HIV-infected adults: Effect of patient age, cognitive status, and substance abuse. AIDS, 18(Suppl 1), S19–25. http://doi.org/00002030-200418001-00004 [pii] [DOI] [PMC free article] [PubMed] [Google Scholar]
- Hollingshead AB, & Redlich FC (1958). Social class and mental illness: Community study. New York: Wiley. [DOI] [PMC free article] [PubMed] [Google Scholar]
- Holm S (1979). A simple sequentially rejective multiple test procedure. Scandinavian Journal of Statistics, 6(6), 65–70. 10.2307/4615733 [DOI] [Google Scholar]
- Ipser JC, Brown GG, Bischoff-Grethe A, Connolly CG, Ellis RJ, Heaton RK, & Grant I (2015). HIV infection is associated with attenuated frontostriatal intrinsic connectivity: A preliminary study. Journal of the International Neuropsychological Society, 21(3), 203–213. 10.1017/S1355617715000156 [DOI] [PMC free article] [PubMed] [Google Scholar]
- Jahanshad N, Valcour VG, Nir TM, Kohannim O, Busovaca E, Nicolas K, & Thompson PM (2012). Disrupted brain networks in the aging HIV+ population. Brain Connectivity, 2(6), 335–344. 10.1089/brain.2012.0105-Rev [DOI] [PMC free article] [PubMed] [Google Scholar]
- Jankovic J (2008). Parkinson’s disease: Clinical features and diagnosis. Journal of Neurology, Neurosurgery & Psychiatry, 79(4), 368–76. 10.1136/jnnp.2007.131045 [DOI] [PubMed] [Google Scholar]
- Jurica PJ, Leitten C, & Mattis S (2004). Dementia rating scale-2: Professional manual. Odessa, FL: Psychological Assessment Resources. [Google Scholar]
- Kumar AM, Ownby RL, Waldrop-Valverde D, Fernandez B, & Kumar M (2011). Human immunodeficiency virus infection in the CNS and decreased dopamine availability: Relationship with neuropsychological performance. Journal of NeuroVirology, 17(1), 26–40. 10.1007/s13365-010-0003-4 [DOI] [PubMed] [Google Scholar]
- Larrabee GJ (2014). Test validity and performance validity: Considerations in providing a framework for development of an ability-focused neuropsychological test battery. Archives of Clinical Neuropsychology, 29(7), 695–714. 10.1093/arclin/acu049 [DOI] [PMC free article] [PubMed] [Google Scholar]
- Lozano AM, Lang AE, Galvez-Jimenez N, Miyasaki J, Duff J, Hutchison WD, & Dostrovsky JO (1995). Effect of GPi pallidotomy on motor function in Parkinson’s disease. The Lancet, 346(8987), 1383–1387. 10.1016/S0140-6736(95)92404-3 [DOI] [PubMed] [Google Scholar]
- Marelli C, Figoni J, Charles P, Anheim M, Tchikviladze M, Vincitorio CM, … Dürr A (2012). Annual change in Friedreich’s ataxia evaluated by the Scale for the Assessment and Rating of Ataxia (SARA) is independent of disease severity. Movement Disorders, 27(1), 135–139. 10.1002/mds.23879 [DOI] [PubMed] [Google Scholar]
- Marras C, Tröster AI, Kulisevsky J, & Stebbins GT (2014). The tools of the trade: A state of the art “how to assess cognition” in the patient with Parkinson’s disease. Movement Disorders, 29(5), 584–596. 10.1002/mds.25874 [DOI] [PubMed] [Google Scholar]
- Morgan EE, Woods SP, Delano-Wood L, Bondi MW, & Grant I (2011). Intraindividual variability in HIV infection: Evidence for greater neurocognitive dispersion in older HIV seropositive adults. Neuropsychology, 25(5), 645–654. 10.1037/a0023792 [DOI] [PMC free article] [PubMed] [Google Scholar]
- Nichols WC, Pankratz N, Hernandez D, Paisán-Ruíz C, Jain S, Halter CA, … Foroud T (2005). Genetic screening for a single common LRRK2 mutation in familial Parkinson’s disease. Lancet, 365(9457), 410–412. 10.1016/S0140-6736(05)17828-3 [DOI] [PubMed] [Google Scholar]
- Pfefferbaum A, Rosenbloom MJ, Sassoon SA, Kemper CA, Deresinski S, Rohlfing T, & Sullivan EV (2012). Regional brain structural dysmorphology in human immunodeficiency virus infection: Effects of acquired immune deficiency syndrome, alcoholism, and age. Biological Psychiatry, 72(5), 361–370. 10.1016/j.biopsych.2012.02.018 [DOI] [PMC free article] [PubMed] [Google Scholar]
- Price CC, Tanner J, Nguyen PT, Schwab NA, Mitchell S, Slonena E, … Bowers D (2016). Gray and white matter contributions to cognitive frontostriatal deficits in non-demented Parkinson’s disease. PLoS ONE, 11(1), e0147332 10.1371/journal.pone.0147332 [DOI] [PMC free article] [PubMed] [Google Scholar]
- Reger M, Welsh R, Razani J, Martin DJ, & Boone KB (2002). A meta-analysis of the neuropsychological sequelae of HIV infection. Journal of the International Neuropsychological Society, 8(3), 410–424. 10.1017/S1355617702813212 [DOI] [PubMed] [Google Scholar]
- Motor function and human immunodeficiency virus-associated cognitive impairment in a highly active antiretroviral therapy-era cohort.
- Robinson-Papp J, Byrd D, Mindt MR, Oden NL, Simpson DM, & Morgello S (2008). Manhattan HIV Brain Bank. Archives of Neurology, 65(8), 1096–1101. doi: 10.1001/archneur.65.8.1096. [DOI] [PMC free article] [PubMed] [Google Scholar]
- Sacktor N (2017). Changing clinical phenotypes of HIV-associated neurocognitive disorders. Journal of NeuroVirology, 1–5. 10.1007/s13365-017-0556-6 [DOI] [PMC free article] [PubMed] [Google Scholar]
- Sacktor NC, Lyles RH, Skolasky RL, Anderson DE, McArthur JC, McFarlane G, … (MACS), for the M. A. C. S. (1999). Combination antiretroviral therapy improves psychomotor speed performance in HIV-seropositive homosexual men. Neurology, 52(8), 1640–1640. 10.1212/WNL.52.8.1640 [DOI] [PubMed] [Google Scholar]
- Sacktor N, McDermott MP, Marder K, Schifitto G, Selnes OA, McArthur JC, … Epstein L (2002). HIV-associated cognitive impairment before and after the advent of combination therapy. Journal of Neurovirology, 8(2), 136–142. 10.1080/13550280290049615 [DOI] [PubMed] [Google Scholar]
- Sacktor N, Skolasky RL, Seaberg E, Munro C, Becker JT, Martin E, … Miller E (2016). Prevalence of HIV-associated neurocognitive disorders in the Multicenter AIDS Cohort Study. Neurology, 86(4), 334–340. 10.1212/WNL.0000000000002277 [DOI] [PMC free article] [PubMed] [Google Scholar]
- Sacktor N, Skolasky RL, Tarwater PM, McArthur JC, Selnes OA, Becker J, … Miller EN (2003). Response to systemic HIV viral load suppression correlates with psychomotor speed performance. Neurology, 61(4), 567–569. 10.1212/01.WNL.0000076477.71313.6E [DOI] [PubMed] [Google Scholar]
- Samji H, Cescon A, Hogg RS, Modur SP, Althoff KN, Buchacz K, … Gange SJ (2013). Closing the gap: Increases in life expectancy among treated HIV-positive individuals in the United States and Canada. PLoS ONE, 8(12), e81355 10.1371/journal.pone.0081355 [DOI] [PMC free article] [PubMed] [Google Scholar]
- Sassoon SA, Fama R, Rosenbloom MJ, O’Reilly A, Pfefferbaum A, & Sullivan EV (2007). Component cognitive and motor processes of the digit symbol test: differential deficits in alcoholism, HIV infection, and their comorbidity. Alcoholism, Clinical and Experimental Research, 31(8), 1315–1324. [DOI] [PubMed] [Google Scholar]
- Schmitz-Hübsch T, Du Montcel ST, Baliko L, Berciano J, Boesch S, Depondt C, … Fancellu R (2006). Scale for the assessment and rating of ataxia: Development of a new clinical scale. Neurology, 66(11), 1717–1720. 10.1212/01.wnl.0000219042.60538.92 [DOI] [PubMed] [Google Scholar]
- Schulte T, Muller-Oehring EM, Sullivan EV, & Pfefferbaum A (2012). White matter fiber compromise contributes differentially to attention and emotion processing impairment in alcoholism, HIV-infection, and their comorbidity. Neuropsychologia, 50(12), 2812–2822. 10.1016/j.neuropsychologia.2012.07.042 [DOI] [PMC free article] [PubMed] [Google Scholar]
- Sheridan LK, Fitzgerald HE, Adams KM, Nigg JT, Martel MM, Puttler LI, … Zucker RA (2006). Normative symbol digit modalities test performance in a community-based sample. Archives of Clinical Neuropsychology, 21(1), 23–28. 10.1016/j.acn.2005.07.003 [DOI] [PubMed] [Google Scholar]
- Smith A (1968). The symbol-digit modalities test: A neuropsychologic test of learning and other cerebral disorders In Helmuth J (Ed.), Learning Disorders (pp. 83–91). Seattle, WA: Special Child Publications. [Google Scholar]
- Smith A (1982). Symbol digit modalities test. Los Angeles, CA: Western Psychological Services. [Google Scholar]
- Springate BA, Tremont G, Papandonatos G, & Ott BR (2014). Screening for mild cognitive impairment using the dementia rating scale-2. Journal of Geriatric Psychiatry and Neurology, 27(2), 139–144. 10.1177/0891988714522700 [DOI] [PubMed] [Google Scholar]
- Swainson R, Rogers R, & Sahakian B (2000). Probabilistic learning and reversal deficits in patients with Parkinson’s disease or frontal or temporal lobe lesions: Possible adverse effects of dopaminergic medication. Neuropsychologia, 38(5), 596–612. [DOI] [PubMed] [Google Scholar]
- Tanner CM, & Aston DA (2000). Epidemiology of Parkinson’s disease and akinetic syndromes. Current Opinion in Neurology, 12(4), 427–430. 10.1097/00019052-200008000-00010 [DOI] [PubMed] [Google Scholar]
- Thomas JB, Brier MR, Snyder AZ, Vaida FF, & Ances BM (2013). Pathways to neurodegeneration: Effects of HIV and aging on resting-state functional connectivity. Neurology, 80(13), 1186–1193. 10.1212/WNL.0b013e318288792b [DOI] [PMC free article] [PubMed] [Google Scholar]
- Tisch S, & Brew B (2009). Parkinsonism in HIV-infected patients on highly active antiretroviral therapy. Neurology, 73(5), 401–403. 10.1212/WNL.0b013e3181b04b0d [DOI] [PubMed] [Google Scholar]
- Tröster AI, & Browner N (2013). Movement disorders with dementia in older adults In Ravdin LD & Katzen H (Eds.), Handbook on the Neuropsychology of Aging and Dementia. New York, NY: Springer US. [Google Scholar]
- Valcour V, Watters M, Williams A, Sacktor N, McMurtray A, & Shikuma C (2008). Aging exacerbates extrapyramidal motor signs in the era of highly active antiretroviral therapy. Journal of NeuroVirology, 14(5), 362–367. 10.1080/13550280802216494 [DOI] [PMC free article] [PubMed] [Google Scholar]
- Vance DE, Fazeli PL, Ball DA, Slater LZ, & Ross LA (2014). Cognitive functioning and driving simulator performance in middle-aged and older adults with HIV. The Journal of the Association of Nurses in AIDS Care : JANAC, 25(2), e11–26. 10.1016/j.jana.2013.12.001 [DOI] [PMC free article] [PubMed] [Google Scholar]
- Wechsler D (1955). Manual for the Wechsler adult intelligence scale. Oxford, England: Psychological Corporation. [Google Scholar]
- Wilkie FL, Goodkin K, Khamis I, van Zuilen MH, Lee D, Lecusay R, … Eisdorfer C (2003). Cognitive functioning in younger and older HIV-1-infected adults. Journal of Acquired Immune Deficiency Syndromes (1999), 33(Suppl2), S93–S105. 10.1097/00126334-200306012-00006 [DOI] [PubMed] [Google Scholar]
- Wu T, & Hallett M (2013). The cerebellum in Parkinson’s disease. Brain, 136(3), 696–709. 10.1093/brain/aws360 [DOI] [PMC free article] [PubMed] [Google Scholar]
- Yabe I, Matsushima M, Soma H, Basri R, & Sasaki H (2008). Usefulness of the Scale for Assessment and Rating of Ataxia (SARA). Journal of the Neurological Sciences, 266(1–2), 164–166. 10.1016/j.jns.2007.09.021 [DOI] [PubMed] [Google Scholar]