

Abstract
Background:
The Affordable Care Act (ACA) with Medicaid expansion implemented in 2014, extended health insurance to >20-million previously-uninsured individuals. However, it is unclear whether enhanced primary care access with Medicaid expansion decreased ED visits and hospitalizations for Gastrointestinal (GI)/pancreatic/liver diseases.
Methods:
We evaluated trends in GI/pancreatic/liver diagnosis-specific ED/hospital utilization over a 5-year period leading up to Medicaid expansion and a year following expansion, in California (a state that implemented Medicaid expansion) and compare these with Florida (a state that did not).
Results:
From 2009–2013, GI/pancreatic/liver disease ED visits increased by 15.0% in California and 20.2% in Florida and hospitalizations for these conditions decreased by 2.6% in California and increased by 7.9% in Florida. Following Medicaid expansion a shift from self-pay/uninsured to Medicaid insurance was seen California; additionally, a new decrease in ED visits for nausea/vomiting and GI infections, was evident, without associated change in overall ED/hospital utilization trends. Total hospitalization charges for abdominal pain, nausea/vomiting, constipation and GI infection diagnoses decreased in California following Medicaid expansion, but increased over the same time-period in Florida.
Conclusions:
We observed a striking payer shift for GI/pancreatic/liver disease ED visits/hospitalizations after Medicaid expansion in California, indicating a shift in the reimbursement burden in self-pay/uninsured patients, from patients and hospitals to the government. ED visits and hospitalization charges decreased for some primary care-treatable GI diagnoses in California, but not for Florida, suggesting a trend toward lower cost of gastroenterology care, perhaps due to decreased hospital utilization for conditions amenable to outpatient management.
Keywords: Affordable Care Act, Gastrointestinal Disease, Pancreatic Disease, Liver Disease
INTRODUCTION
Gastrointestinal (GI), pancreatic and liver diseases represent a significant source of morbidity and contribute substantially to health care costs within the United States (US).1 Trends in prevalence and morbidity related to GI, pancreatic and liver disease have altered as a consequence of the aging US population,1 and advances in management of GI and liver diseases including the availability of new curative options for Hepatitis C.2 The politically divisive Patient Protection and Affordable Care Act (ACA), fully implemented in 2014, extended health insurance coverage to over 20 million previously-uninsured individuals.3, 4 Recent trends in emergency department (ED) utilization and hospital admissions for GI, pancreatic and liver diseases and the impact of the ACA on these trends have not yet been evaluated.
One major provision of the ACA was expansion of Medicaid coverage, to include individuals under 65 years of age earning up to 138% of the federal poverty level.3 A Supreme Court ruling upheld the ACA but allowed states to opt out of Medicaid expansion. Nineteen states chose not to expand Medicaid, whereas thirty one states and the District of Columbia elected to expand Medicaid,3 leading to an estimated 21% increase in the number of individuals enrolled.
There is controversy as to whether the ACA has resulted in decreased ED utilization, decreased hospital admission/re-admission rates, deceleration of the trend of increasing health care costs, or in improving quality of care.3, 5–8 An important aim of Medicaid expansion was to improve access to primary care physician visits, with the intent of decreasing utilization of ED services for conditions treatable by primary care physicians (primary care-treatable conditions), to limit rising health care costs. It is well-established that Medicaid patients and uninsured individuals are traditionally high utilizers of ED services for all conditions, including GI, pancreatic and liver diseases.9,10 Many GI diseases such as constipation, diarrhea, irritable bowel syndrome, dyspepsia and reflux are routinely managed by primary care physicians,11, 12 with GI diagnoses accounting for an estimated 10% of general internal medicine outpatient visits13 and 12% of ED visits.14 Prior studies have indicated that up to a quarter of ED visits could have been managed by primary care physicians,12 and the proportion of such primary care-treatable ED visits may potentially be higher for GI conditions.
In this study we define the 5-year trends in ED/hospital utilization, payer mix, hospitalization charges and percentage of patients admitted to the ED for the most prevalent GI, pancreatic and liver diagnoses, and evaluate the impact of Medicaid expansion on these trends. To determine whether the goal of enhanced access to primary care physicians resulted in decreased ED visits and hospitalizations, we compared trends extending from five years prior to and one year following Medicaid expansion in two populous and demographically similar states, one that implemented the Medicaid expansion provision of the ACA (California) and another which opted out of this provision (Florida).
METHODS
GI Diagnoses and Diagnostic Categories
ICD-9 and CPT codes for the most frequent ED and hospitalization primary GI, pancreatic and liver diagnoses, as well as selected other diagnostic codes of interest were included in the analysis. Diagnoses were grouped into twelve major ED/hospitalization GI diagnostic categories (Supplementary Figure 1, Supplemental Digital Content 1, http://links.lww.com/JCG/A434). Within these GI diagnostic categories, the five categories most amenable to management on an outpatient basis by primary care or subspecialty physicians are abdominal pain, constipation, nausea & vomiting, GI infections, and functional/motility disorders. Diagnoses were also grouped into discretionary (Abdominal Pain, Nausea and Vomiting, Constipation, Functional/Motility Disorders) and non-discretionary (GI Infections, Biliary, Appendicitis, Pancreatitis, Liver Disease, Inflammatory Bowel Disease, GI Malignancy, GI Hemorrhage) categories.
Data Sets
Data for Florida from 2009–2014 and for California from 2009–2011, were extracted from the State Inpatient Databases (SID) and the State Emergency Department Databases (SEDD) maintained by the Agency for Healthcare Research and Quality, Healthcare Cost and Utilization Project (HCUP).15 The SID includes inpatient discharge records15 and SEDD includes ED visits.15 As SID and SEDD are not available for California from 2012–2014, ED/hospitalization data were collected from the California Office of Statewide Health Planning and Development (OSHPD).16 OSHPD data are identical to SID/SEDD data, as OSHPD is the source for these data. As a sensitivity analysis, ED visits/hospitalizations from 2009–2011 were analyzed with OSHPD and HCUP data, with consistent results.
Analyses
We evaluated all ED encounters and hospitalizations from the states of California and Florida for the twelve major ED/hospitalization GI diagnostic categories during the study period, 2009–2014 and compared the pre-ACA period (prior to January 1, 2014) with the post-ACA period. Total ED visits, hospitalizations and the percentage of ED visits resulting in hospitalization were calculated for each year, and stratified by payer (with self-pay including uninsured individuals). Hospitalization-associated charges were obtained from the ‘total charges’ dataset field and ‘total hospitalization cost’ was defined as the sum of these charges for patients who fall under a given diagnostic category. Linear regression analysis was performed on 2009–2013 data to compare predicted and actual rate of Medicaid ED visits in 2014 for each diagnosis and analysis category. All analyses were performed using SAS version 9.4 (SAS Institute, Inc., Cary, NC) and Microsoft Excel 2016.
RESULTS
Demographics
Population demographics over the study period are depicted in Table 1. California and Florida represented 12.05% and 6.08% of the US population of 306,771,529 in 2009 and 12.16% and 6.24% of the US population of 318,907,401 in 2014, respectively. Florida has a higher proportion of individuals 65 years of age and older, with 17.19% of Florida’s population aged ≥ 65 years, compared to 11.46% of the California population and 12.92% of the US population in 2009.
Table 1:
Total population, racial/ethnic and age demographic characteristics of California, FlOFlda and the United States in 2009 and 2014.
| United States, Florida and California Demographics for 2009 and 2014 | ||||||||||||
|---|---|---|---|---|---|---|---|---|---|---|---|---|
| 2009 | 2014 | |||||||||||
| United States | California | Florida | United States | California | Florida | |||||||
| % | % | % | % | % | % | |||||||
| Total | 306,771,529 | 36,961,229 | 18,652,644 | 318,907,401 | 38,792,291 | 19,905,569 | ||||||
| 0–18 years | 78,668,801 | 25.6 | 9,872,723 | 26.7 | 4,252,850 | 22.8 | 77,827,101 | 24.4 | 9,678,170 | 24.9 | 4,290,642 | 21.6 |
| 19–25 years | 30,200,314 | 9.8 | 3,853,022 | 10.4 | 1,716,027 | 9.2 | 31,767,407 | 10.0 | 4,063,772 | 10.5 | 1,818,949 | 9.1 |
| 26–34 years | 36,518,740 | 11.9 | 4,730,660 | 12.8 | 2,028,143 | 10.9 | 39,035,791 | 12.2 | 5,123,045 | 13.2 | 2,263,011 | 11.4 |
| 35–44 years | 41,487,811 | 13.5 | 5,214,338 | 14.1 | 2,460,117 | 13.2 | 40,534,422 | 12.7 | 5,176,950 | 13.3 | 2,427,515 | 12.2 |
| 45–54 years | 44,867,088 | 14.6 | 5,220,443 | 14.1 | 2,715,193 | 14.6 | 43,464,825 | 13.6 | 5,243,365 | 13.5 | 2,739,674 | 13.8 |
| 55–64 years | 35,405,600 | 11.5 | 3,905,550 | 10.6 | 2,274,599 | 12.2 | 40,076,125 | 12.6 | 4,520,695 | 11.7 | 2,574,733 | 12.9 |
| Age 65+ | 39,623,175 | 12.9 | 4,164,493 | 11.3 | 3,205,715 | 17.2 | 46,201,730 | 14.5 | 4,986,294 | 12.9 | 3,791,045 | 19.0 |
| White | 199,993,079 | 65.2 | 15,538,954 | 42.0 | 11,060,801 | 59.3 | 201,025,357 | 63.0 | 15,432,084 | 39.8 | 11,260,915 | 56.6 |
| Black | 39,104,815 | 12.7 | 2,355,669 | 6.4 | 2,917,176 | 15.6 | 41,322,154 | 13.0 | 2,420,088 | 6.2 | 3,194,110 | 16.0 |
| Asian | 15,793,995 | 5.1 | 5,097,609 | 13.8 | 496,184 | 2.7 | 18,498,178 | 5.8 | 5,757,924 | 14.8 | 593,219 | 3.0 |
| American Indian | 2,552,151 | 0.8 | 209,130 | 0.6 | 54,176 | 0.3 | 2,666,544 | 0.8 | 209,888 | 0.5 | 57,947 | 0.3 |
| Hispanicsall races | 49,327,489 | 16.1 | 13,759,867 | 37.2 | 4,124,307 | 22.1 | 55,395,168 | 17.4 | 14,972,307 | 38.6 | 4,799,378 | 24.1 |
ED Utilization
Trends for predicted and actual prevalence of ED visits for top GI, pancreatic and liver diseases are notable for a steady increase in ED visits for these conditions over time and close correspondence between predicted and actual prevalence (Figure 1A). Trends of predicted and actual prevalence of ED visits for the 12 individual GI diagnostic categories and for Hepatitis C from 2009–2014 in both California and Florida are depicted in Figure 2. With respect to primary care-treatable conditions, some divergent trends are noteworthy between the two states. Prior to Medicaid expansion, total ED visits for nausea/vomiting steadily increased in both California and Florida. After Medicaid expansion in California, total ED visits for nausea and vomiting dropped by 3% in California, while increasing by 10% over the same period in Florida (Figure 2, Supplementary Table 1, Supplemental Digital Content 2, http://links.lww.com/JCG/A435). Similarly, total ED visits for gastrointestinal infections progressively increased in both California and Florida prior to Medicaid expansion, with a 3–9% increase per year in California and an 8–12% increase per year in Florida. Following Medicaid expansion, ED visits for GI infections dropped by 5% in California while these visits stabilized in Florida over the same time-period (Figure 2, Supplementary Table 1, Supplemental Digital Content 2, http://links.lww.com/JCG/A435). A yearly increase in ED visits for constipation was noted in both California and Florida from 2009–2013, with up to a 17% annual increase in ED visits for constipation from 2010 to 2011 in California. This trend was paralleled in Florida and continued to be observed following Medicaid expansion in California and over the same time-period in Florida (Supplementary Table 1, Supplemental Digital Content 2, http://links.lww.com/JCG/A435, Figure 2).
Figure 1:

(A) Predicted (red) and Actual (blue) prevalence of Emergency Department visits per 100,000 residents for all studied GI Diagnostic Categories in California and Florida from 2009–2014. (B) Predicted (red) and Actual (blue) percentage of patients admitted from the Emergency Department for all studied GI Diagnostic Categories in California and Florida from 2009–2014.
Figure 2:

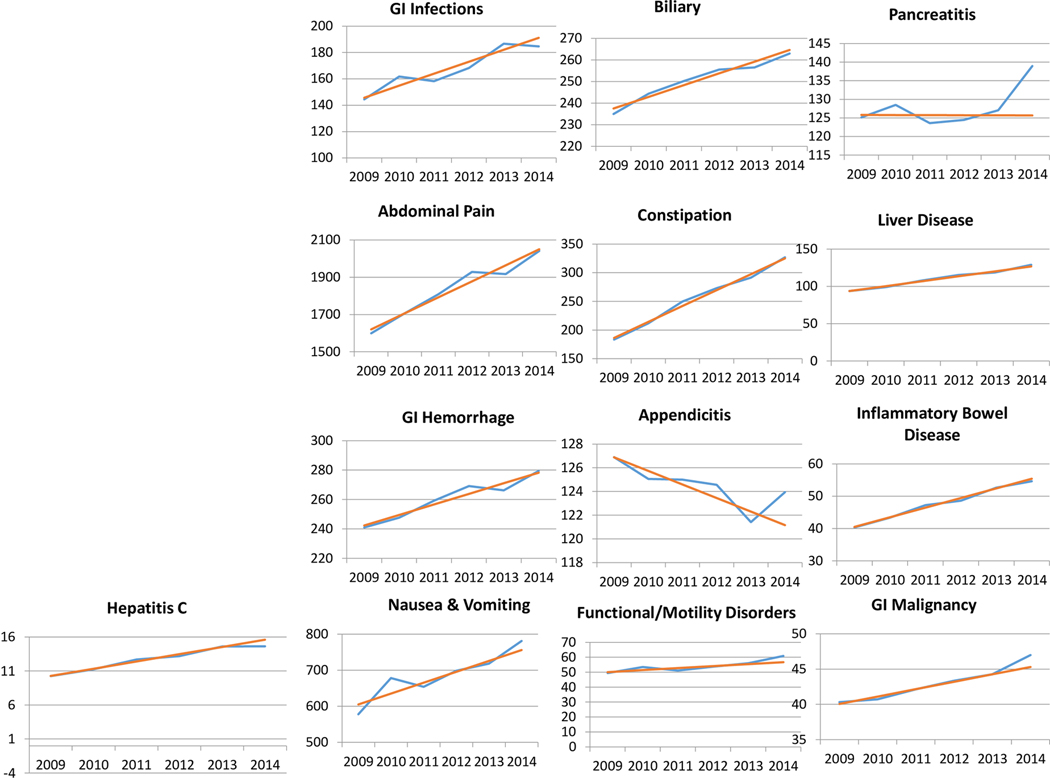
(A) Predicted (red) and Actual (blue) prevalence of total Emergency Department visits per 100,000 residents in California for each GI Diagnostic Category and Hepatitis C from 2009–2014. (B) Predicted (red) and Actual (blue) prevalence of total Emergency Department visits per 100,000 residents in Florida for each GI Diagnostic Category and Hepatitis C from 2009–2014.
Proportion of Patients Admitted from the ED
Predicted and actual percentage of patients admitted following an ED visit for top GI, pancreatic and liver diseases revealed an across-the-board decrease in the proportion of patients admitted with a primary diagnosis included in these major GI diagnostic category diagnoses over time, and a close correspondence between predicted and actual percentage of patients admitted in both California and Florida (Figure 1B). A higher proportion of patients with primary GI, pancreatic and liver diagnoses were admitted following an ED visit in Florida (24%) relative to California (21%) in 2009, the first year evaluated, and over the entire study period (Figure 1B, Supplementary Table 2, Supplemental Digital Content 2, http://links.lww.com/JCG/A435). The predicted and actual percentage of patients admitted following an ED visit for each of the individual major GI diagnostic categories from 2009–2014 in both California and Florida over the study period prior to and after Medicaid expansion are depicted in Figure 2.
Payer Mix:
From 2009 to 2013, the percentage of Medicaid ED visits varied by GI diagnostic category and by year, but did not increase by more than 34.6% for any single GI diagnostic category over a one-year period in California or more than 36.4% for any single GI diagnostic category in Florida. This yearly variation remained stable for Florida from 2013 to 2014 (Supplementary Table 3, Supplemental Digital Content 2, http://links.lww.com/JCG/A435). A dramatic shift in payer was seen following Medicaid expansion in California in 2014, with an increase in the number of Medicaid ED visits for all GI, pancreatic and liver diagnostic categories, and corresponding decreases in self-pay ED visits (Supplementary Table 3, Supplemental Digital Content 2, http://links.lww.com/JCG/A435). The highest increase in Medicaid ED visits (60.75%) was noted for pancreatitis and a 60.64% increase was noted for inflammatory bowel disease, a 50.86% increase for GI hemorrhage, a 49.88% increase for liver disorders, and a 46.89% increase for functional/motility disorders. Over the same time-period in Florida, fluctuations in payer by GI diagnostic category were consistent with those in prior years (Supplementary Table 2, Supplemental Digital Content 2, http://links.lww.com/JCG/A435). Medicaid ED visits for both Discretionary and non-discretionary diagnoses were significantly higher than predicted in California following Medicaid expansion (p<0.001), but the actual and predicted Medicaid ED visits did not differ significantly in Florida over the same time period (Figure 4).
Figure 4:

(A) Predicted (red) and Actual (blue) prevalence of total Emergency Department visits per 100,000 residents in California and Florida for Discretionary and Non-Discretionary GI Diagnostic Categories.
Hospitalizations
In the five years prior to Medicaid expansion, total hospitalizations for top GI diagnoses and diagnostic categories varied by year and by diagnostic category in both California and Florida (Supplementary Tables 4-6, Supplemental Digital Content 2, http://links.lww.com/JCG/A435). GI, pancreatic and liver disease hospitalizations decreased by 2.6% in California while rising 7.9% in Florida from 2009–2013. Total hospitalizations following Medicaid expansion in California, and over the same time-period in Florida were without striking variation relative to that seen in the years prior to Medicaid expansion (Supplementary Tables 4-6, Supplemental Digital Content 2, http://links.lww.com/JCG/A435).
Payer Mix:
Payer mix remained stable in Florida from 2013–2014 (Supplementary Table 7, Supplemental Digital Content 2, http://links.lww.com/JCG/A435). A dramatic payer shift was noted following Medicaid expansion in California in 2014, with a 56.87% increase in Medicaid hospitalizations for pancreatitis, a 47.99% increase for GI hemorrhage, a 47.62% increase in Medicaid hospitalizations for functional and motility diseases, and a 41% increase in Medicaid hospitalizations for biliary diseases (Supplementary Table 7, Supplemental Digital Content 2, http://links.lww.com/JCG/A435). A corresponding decrease in self-pay/uninsured hospitalizations for these conditions was noted in California over this time period (Supplementary Table 7, Supplemental Digital Content 2, http://links.lww.com/JCG/A435).
Median Length of Stay
Median length of hospital stay for these GI, pancreatic or liver diseases was assessed for 2009–2014 in both California and Florida. In California, the only observed change in median length of stay following Medicaid expansion was a decrease from 6 days to 5 days for the diagnosis of GI Malignancy (Table 2).
Table 2:
Median length of stay for hospitalizations by GI diagnostic category
| California | Florida | |||||||||
|---|---|---|---|---|---|---|---|---|---|---|
| Diagnosis | ||||||||||
| 2010 | 2011 | 2012 | 2013 | 2014 | 2010 | 2011 | 2012 | 2013 | 2014 | |
| Abdominal pain | 2 | 2 | 2 | 2 | 2 | 2 | 2 | 2 | 2 | 2 |
| Nausea and vomiting | 2 | 2 | 2 | 2 | 2 | 2 | 2 | 2 | 2 | 2 |
| Constipation | 2 | 2 | 2 | 2 | 2 | 2 | 2 | 2 | 2 | 2 |
| GI hemorrhage | 3 | 3 | 3 | 3 | 3 | 3 | 3 | 3 | 3 | 3 |
| Biliary | 3 | 3 | 3 | 3 | 3 | 3 | 3 | 3 | 3 | 3 |
| Gastrointestinal infections | 3 | 3 | 3 | 3 | 3 | 4 | 4 | 4 | 3 | 3 |
| Appendicitis | 2 | 2 | 2 | 2 | 2 | 2 | 2 | 2 | 2 | 2 |
| Pancreatitis | 3 | 3 | 3 | 3 | 3 | 4 | 4 | 4 | 3 | 3 |
| Functional/motility disorders | 3 | 3 | 3 | 3 | 3 | 3 | 3 | 3 | 3 | 3 |
| Liver disease | 4 | 4 | 4 | 4 | 4 | 4 | 4 | 4 | 4 | 4 |
| Inflammatory Bowel Disease | 4 | 4 | 4 | 4 | 4 | 4 | 4 | 4 | 4 | 4 |
| GI Malignancies | 6 | 6 | 6 | 6 | 5 | 7 | 6 | 6 | 6 | 6 |
Median length of hospital stay for these GI, pancreatic and liver diseases remained stable over the same time-period (2013–2014) in Florida (Table 2).
Charges associated with Hospitalization
Total hospitalization charges for GI diagnostic categories in California and Florida varied by year and by diagnostic category from 2009 to 2013. Following Medicaid expansion in California in 2014, hospitalization charges associated with constipation decreased, whereas it had been substantially increasing for each of the previous 5-years (Table 3). Similarly, charges associated with hospitalizations for abdominal pain, primary gastrointestinal infections and nausea/vomiting diagnoses decreased in California from 2012–2014. Total hospitalization charges for these GI diagnostic categories in Florida exhibit yearly variation and fluctuations, but a dramatic shift was not observed from 2013–2014 (Table 3).
Table 3:
Hospitalization-associated charges by GI diagnostic category
| California | Florida | |||||||||||
|---|---|---|---|---|---|---|---|---|---|---|---|---|
| Diagnosis | 2009 | 2010 | 2011 | 2012 | 2013 | 2014 | 2009 | 2010 | 2011 | 2012 | 2013 | 2014 |
| Abdominal pain | 399,400,000 | 437,920,000 | 427,840,000 | 418,330,000 | 384,160,000 | 379,990,000 | 350,240,000 | 390,080,000 | 407,750,000 | 395,940,000 | 407,510,000 | 440,350,000 |
| Nausea and vomiting | 88,890,799 | 105,760,000 | 116,460,000 | 112,670,000 | 104,450,000 | 96,174,000 | 60,287,709 | 83,582,609 | 90,903,403 | 99,379,146 | 90,523,359 | 95,361,286 |
| Constipation | 87,822,926 | 128,770,000 | 190,140,000 | 201,350,000 | 204,920,000 | 199,150,000 | 60,991,363 | 91,301,389 | 159,730,000 | 173,390,000 | 180,440,000 | 213,770,000 |
| GI hemorrhage | 1,502,600,000 | 1,609,100,000 | 1,734,100,000 | 1,802,700,000 | 1,863,200,000 | 1,982,100,000 | 1,023,600,000 | 1,093,400,000 | 1,204,800,000 | 1,315,500,000 | 1,414,100,000 | 1,530,100,000 |
| Biliary | 2,399,800,000 | 2,576,900,000 | 2,661,000,000 | 2,812,000,000 | 2,792,000,000 | 2,872,000,000 | 1,655,100,000 | 1,785,900,000 | 1,856,900,000 | 1,961,100,000 | 2,036,600,000 | 2,124,700,000 |
| Gastrointestinal infections | 689,770,000 | 754,680,000 | 837,480,000 | 917,000,000 | 847,330,000 | 806,490,000 | 563,400,000 | 623,920,000 | 676,950,000 | 699,420,000 | 712,530,000 | 724,900,000 |
| Appendicitis | 1,594,600,000 | 1,692,700,000 | 1,750,000,000 | 1,774,300,000 | 1,750,900,000 | 1,755,500,000 | 773,390,000 | 790,610,000 | 822,740,000 | 822,100,000 | 807,120,000 | 797,800,000 |
| Pancreatitis | 1,324,500,000 | 1,398,300,000 | 1,427,200,000 | 1,426,200,000 | 1,438,200,000 | 1,424,600,000 | 813,170,000 | 861,770,000 | 866,200,000 | 901,760,000 | 927,050,000 | 1,035,800,000 |
| Functional/motility disorders | 180,990,000 | 198,960,000 | 209,200,000 | 221,520,000 | 219,260,000 | 231,670,000 | 141,690,000 | 158,270,000 | 165,940,000 | 183,320,000 | 181,760,000 | 199,200,000 |
| Liver disease | 1,754,800,000 | 1,854,700,000 | 2,178,400,000 | 2,331,600,000 | 2,363,800,000 | 2,553,900,000 | 816,840,000 | 839,160,000 | 987,980,000 | 1,040,700,000 | 1,076,400,000 | 1,197,900,000 |
| Inflammatory Bowel Disease | 388,400,000 | 403,320,000 | 420,960,000 | 425,800,000 | 456,750,000 | 468,250,000 | 300,940,000 | 333,360,000 | 362,300,000 | 388,630,000 | 424,020,000 | 435,740,000 |
| GI Malignancies | 2,251,800,000 | 2,376,700,000 | 2,521,100,000 | 2,587,500,000 | 2,631,200,000 | 2,748,700,000 | 1,286,400,000 | 1,327,500,000 | 1,437,400,000 | 1,518,000,000 | 1,585,100,000 | 1,690,300,000 |
DISCUSSION
The Medicaid expansion component of the ACA, implemented in 2014, extended health insurance coverage to over 20 million previously-uninsured individuals.3,4 Adults with Medicaid and those without health insurance are high ED utilizers, utilizing emergency medical care as their safety net.9 Studies indicate that many ED visits are unnecessary and can be managed in primary care and other outpatient settings.12 These ED visits for primary care-treatable conditions offer policymakers a potential target for cost savings. One goal of Medicaid expansion was to facilitate access to primary care physicians, thereby decreasing utilization of costly ED services for primary care-treatable conditions. In 2007, 12% of ED visits were for primary GI diagnoses.14 Our data indicate that a large proportion of patients, who present to the ED with GI, pancreatic and liver disease are discharged following evaluation, >75% in 2009 and close to 80% in 2014. This suggests that a substantial proportion of these ED visits represent GI conditions amenable to outpatient management.
Overall ED visits increased by 15.0% in California and 20.2% in Florida for GI, pancreatic and liver diagnoses from 2009–2013 (pre-Medicaid expansion) in both California and Florida. Although the proportion of patients admitted following an ED visit for these diagnoses progressively decreased by 3% in both California and Florida over the same period, total admission numbers decreased by 2.6% in California while rising 7.9% in Florida, as a consequence of the larger increase in ED visits in this state. Medicaid expansion in 2014 did not change these overall ED/admission trends as was its initial stated intent. However a dramatic payer shift was evident in California, with notably fewer self-pay/uninsured and significantly more Medicaid ED visits and Medicaid hospital admissions. Our data indicate that for former self-pay/uninsured individuals whose medical bills previously remained unpaid, enhanced insurance coverage following Medicaid expansion has shifted the burden of cost from treating hospitals to the government. For former self-pay/uninsured individuals who would have paid their medical bills, enhanced insurance coverage following Medicaid expansion has shifted the burden of reimbursement from patients to the government.
Although greater cost savings can be achieved by management of ED patients with primary care-treatable GI diagnoses in more appropriate outpatient settings, we were nevertheless able to demonstrate a trend toward lower total hospitalization charges for several primary care-treatable GI diagnoses, including abdominal pain, nausea/vomiting, constipation and GI infection in California from 2012–2014; such a trend was not evident in Florida over the same time frame. This, coupled with our data indicating no change in median length of hospital stay for these diagnoses, is consistent with the adoption of less costly workup or lower cost management approaches for these conditions. Taken in context with the new decrease in the prevalence of ED visits for nausea/vomiting and GI infections following Medicaid expansion in California, this suggests a trend toward lower hospital-based cost of gastroenterology care since implementation of the ACA.
There was speculation that following Medicaid expansion, the sudden inundation of the California healthcare system with 3.4 million newly-insured patients without a corresponding increase in primary care providers, might result in a significant increase in ED visits for non-emergent GI conditions.17–20 If such a trend had been noted, it might have indicated that individuals with inadequate/poor insurance coverage who now had insurance were seeking medical attention in the ED for lower acuity GI symptoms which could have been managed in primary care settings. However, the close alignment of predicted/actual overall ED visits for top GI, pancreatic and liver diagnoses may indicate that previously-uninsured individuals who needed care for GI diseases were already receiving this care in various outpatient settings prior to Medicaid expansion. Conversely, the lack of a decline in ED visits may indicate that previously-uninsured patients who utilized the ED for lower acuity symptoms continued this utilization pattern despite acquiring Medicaid insurance.
ED visits and hospitalizations also account for a large portion of the economic burden of GI diseases not uniformly classified as primary care-treatable. Hepatitis C-associated ED visit prevalence decreased by 2.4% in California following Medicaid expansion, but remained stable in Florida over the same period, perhaps indicating a shift toward outpatient management/treatment of Hepatitis C following Medicaid expansion. Between 1993–2012, ED visits and hospitalizations for inflammatory bowel diseases (IBD) in the U.S. had increased, with corresponding increases in associated cost of care.1 Our data from the past 6 years demonstrate a 4–5% yearly increase in IBD ED visit prevalence in California and a 4–10% yearly increase in Florida, with a 5–7% decrease in percentage of IBD patients admitted following ED presentations in both California and Florida. A similar 6-year period of relative stability in the number of ED visits and percentage of patients admitted from the ED was observed for GI malignancies and GI hemorrhage. The stability of ED utilization for these more severe GI diagnoses after Medicaid expansion may indicate that individuals with newly-obtained Medicaid insurance coverage utilize the ED for conditions of similar seriousness as those who were previously self-pay or uninsured.
A limitation of this study is that although we evaluated data for 5 years before Medicaid expansion, only a single year’s data following Medicaid expansion is currently available. While the single year of data following Medicaid expansion limits prevents us from discerning transient changes from persistent trends, this transition year is noteworthy, as it may help identify and highlight trends that could be addressed to optimize future functioning of the stated goals of the ACA, or of any replacement system should the ACA be repealed or dismantled. This study year is also unique due to its transiently high funding. Medicaid reimbursement rates are typically 56% and Medicare 80%, of private insurance reimbursement rates.21 However, Medicaid reimbursement was transiently federally supplemented to match Medicare rates for a defined set of primary care-related services from 2013–2014 (but ending in 2015 for most states), to enhance access to primary care for new Medicaid enrollees. It will be of interest to evaluate the impact of withdrawal of this rate increase over subsequent years.
In summary, this analysis of six-year data in ED and hospital utilization provides longitudinal support and a context for interpreting changes that followed Medicaid expansion. We demonstrate a striking shift in payer for GI, pancreatic and liver disease ED visits and hospitalizations after implementation of the ACA in California, with a pronounced increase in Medicaid patient ED visits and admissions, but stable trends for overall ED/hospital utilization for these diagnoses after Medicaid expansion in California. Our findings indicate a shift in the reimbursement burden for GI diagnoses in self-pay/uninsured patients, from patients and hospitals to the government. Following Medicaid expansion in California, a trend toward lower ED utilization relative to that predicted by our regression analysis was seen for two primary care-treatable conditions: GI infections and nausea/vomiting. Hospitalization charges for constipation dropped for the first time in five years following Medicaid expansion in California. These findings suggest a possible shift toward lower ED utilization and hospitalization cost for some primary care-treatable GI conditions—the stability and significance of these trends warrant further study. The future of the ACA remains uncertain given the current political climate, but our data highlight the early impact this legislation had on health care utilization for patients with GI, pancreatic and liver diseases and may be valuable in guiding development of future legislation. If the ACA survives, its long-term impact will warrant further study. If the ACA is successfully repealed, it will be of interest to analyze and compare future trends in ED and hospital utilization, length of stay and cost associated with GI diagnoses under the replacement system.
Supplementary Material
Figure 3:
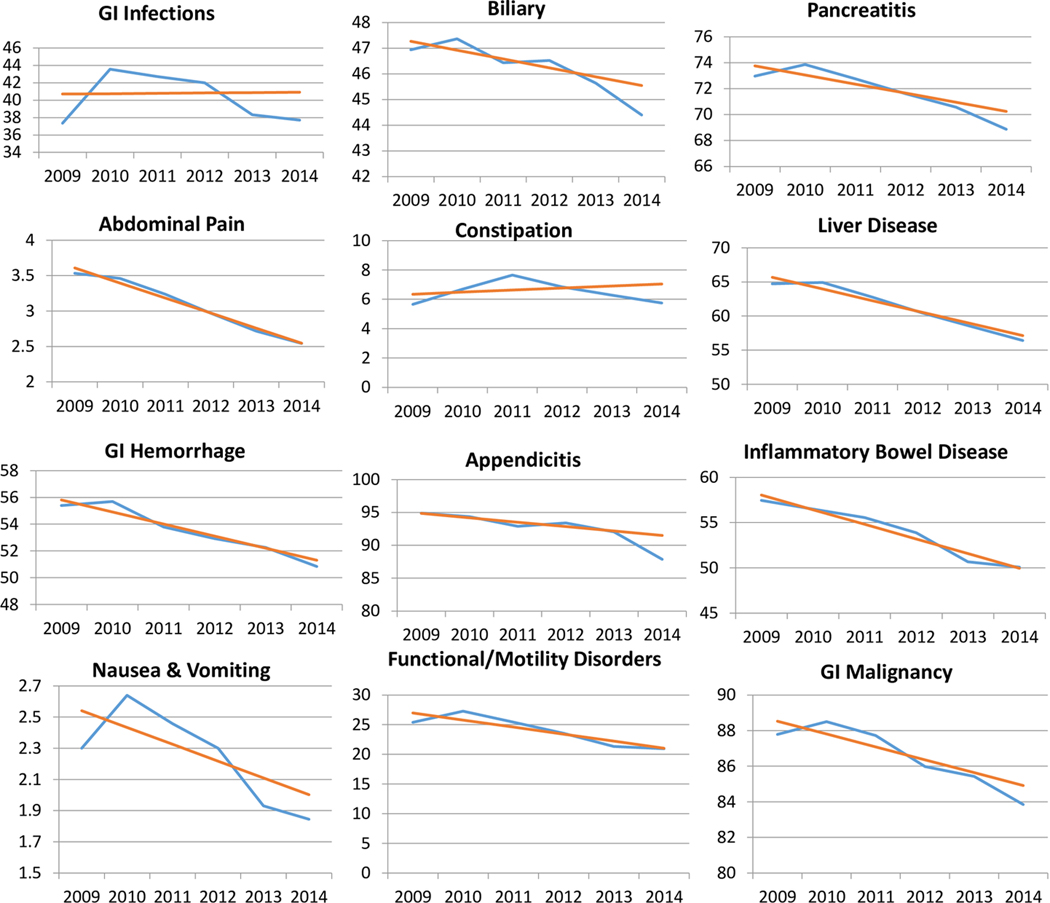

(A) Predicted (red) and Actual (blue) percentage of patients admitted to the Emergency Department for each studied GI Diagnostic Category in California from 2009–2014. (B) Predicted (red) and Actual (blue) percentage of patients admitted to the Emergency Department for each studied GI Diagnostic Category in Florida from 2009–2014.
Acknowledgement of Financial Support:
This work was supported by a NIH T32 Training Grant (DK007056) supporting MTB.
Footnotes
Conflict of Interest: The authors declare no conflict of interest pertaining to the study.
References
- 1.Peery AF, Crockett SD, Barritt AS, et al. Burden of Gastrointestinal, Liver, and Pancreatic Diseases in the United States. Gastroenterology 2015;149:1731–1741 e3. [DOI] [PMC free article] [PubMed] [Google Scholar]
- 2.Muir AJ, Naggie S. Hepatitis C Virus Treatment: Is It Possible To Cure All Hepatitis C Virus Patients? Clin Gastroenterol Hepatol 2015;13:2166–72. [DOI] [PMC free article] [PubMed] [Google Scholar]
- 3.Obama B. United States Health Care Reform: Progress to Date and Next Steps. JAMA 2016;316:525–32. [DOI] [PMC free article] [PubMed] [Google Scholar]
- 4.Garfield R. and Young K. AWRUatEoMP, Calif.: Henry J. Kaiser Family Foundation, 2015. [Google Scholar]
- 5.Bauchner H. The Affordable Care Act and the Future of US Health Care. JAMA 2016;316:492–3. [DOI] [PubMed] [Google Scholar]
- 6.Butler SM. The Future of the Affordable Care Act: Reassessment and Revision. JAMA 2016;316:495–7. [DOI] [PubMed] [Google Scholar]
- 7.Skinner J, Chandra A. The Past and Future of the Affordable Care Act. JAMA 2016;316:497–9. [DOI] [PubMed] [Google Scholar]
- 8.Barakat MT, Mithal A, Huang RJ, et al. Affordable Care Act and healthcare delivery: A comparison of California and Florida hospitals and emergency departments. PLoS One 2017;12:e0182346. [DOI] [PMC free article] [PubMed] [Google Scholar]
- 9.Tang N, Stein J, Hsia RY, et al. Trends and characteristics of US emergency department visits, 1997–2007. JAMA 2010;304:664–70. [DOI] [PMC free article] [PubMed] [Google Scholar]
- 10.Pukurdpol P, Wiler JL, Hsia RY, et al. Association of Medicare and Medicaid insurance with increasing primary care-treatable emergency department visits in the United States. Acad Emerg Med 2014;21:1135–42. [DOI] [PMC free article] [PubMed] [Google Scholar]
- 11.Gikas A, Triantafillidis JK. The role of primary care physicians in early diagnosis and treatment of chronic gastrointestinal diseases. Int J Gen Med 2014;7:159–73. [DOI] [PMC free article] [PubMed] [Google Scholar]
- 12.Weinick RM, Burns RM, Mehrotra A. Many emergency department visits could be managed at urgent care centers and retail clinics. Health Aff (Millwood) 2010;29:1630–6. [DOI] [PMC free article] [PubMed] [Google Scholar]
- 13.Jones R. Primary care research and clinical practice: gastroenterology. Postgrad Med J 2008;84:454–8. [DOI] [PubMed] [Google Scholar]
- 14.Myer PA, Mannalithara A, Singh G, et al. Clinical and economic burden of emergency department visits due to gastrointestinal diseases in the United States. Am J Gastroenterol 2013;108:1496–507. [DOI] [PubMed] [Google Scholar]
- 15.Healthcare Cost and Utilization Project Databases. Rockville, MD: Agency for Healthcare Research and Quality, 2009-2014.
- 16.Public Use Files Data Sets. Sacramento, CA: State of California, Office of Statewide Health Planning and Development, 2012-2014.
- 17.Chen C, Scheffler G, Chandra A. Massachusetts’ health care reform and emergency department utilization. N Engl J Med 2011;365:e25. [DOI] [PubMed] [Google Scholar]
- 18.Smulowitz PBOMJ, Yang X, Landon BE. Increased use of, Massachusetts tedahcri, [published online March 20 AEM. [Google Scholar]
- 19.DHCS. Characteristics of the Medi-Cal population as captured by the Medi-Cal Eligibility Data System. DHCS; 2016. [Google Scholar]
- 20.HealthInsurance.org. California and the ACA’s Medicaid Expansion. 2016. [Google Scholar]
- 21.Brunt CS, Jensen GA. Payment generosity and physician acceptance of Medicare and Medicaid patients. Int J Health Care Finance Econ 2014;14:289–310. [DOI] [PubMed] [Google Scholar]
Associated Data
This section collects any data citations, data availability statements, or supplementary materials included in this article.