

Abstract
The vast amount of experimental data from recent advances in the field of high-throughput biology begs for integration into more complex data structures such as genome-wide functional association networks. Such networks have been used for elucidation of the interplay of intra-cellular molecules to make advances ranging from the basic science understanding of evolutionary processes to the more translational field of precision medicine. The allure of the field has resulted in rapid growth of the number of available network resources, each with unique attributes exploitable to answer different biological questions. Unfortunately, the high volume of network resources makes it impossible for the intended user to select an appropriate tool for their particular research question. The aim of this paper is to provide an overview of the underlying data and representative network resources as well as to mention methods of integration, allowing a customized approach to resource selection. Additionally, this report will provide a primer for researchers venturing into the field of network integration.
Keywords: functional association networks, network inference, protein–protein interactions, Bayesian classification
Introduction
Modern experimental techniques in high-throughput biology e.g. next-generation sequencing (NGS), microarrays and yeast-2-hybrid (Y2H) [1] systems, etc. are generating astronomical 2–40 exabytes of data every year [2]. In these data lie potential keys to unlocking mechanisms behind many complex diseases. Unfortunately, the accuracy of the produced information is not improving at the same pace as its accelerated generation, resulting in high rates of false positives and technique-specific biases [3–5]. Additionally, current coverage of the genome, transcriptome or proteome varies greatly between the experimental approaches [6]. Coverage can be dramatically improved by integration of data from different experimental techniques [7, 8]. This approach has also the ability to minimize technique- and source-specific biases and increase signal to noise ratio, since the constant signal of true interactions is more likely to be enhanced [8] while the uniformly distributed noise is averaged out. Integration of data from heterogeneous types and sources is also required for mapping the underlying biological network responsible for the observed complex phenotypes like diseases [9]. The reason for this is that molecular interactions composing the underlying biological network stem from diverse modes of communication at genetic, genomic and proteomic levels such as genetic interactions, transcription factor (TF) binding, signaling cascades, etc.
To capture the complex interplay between molecules, networks of functional association can be used. Such networks, with nodes representing genes or proteins and links depicting interactions, present a flexible model for capturing the complexity of the underlying data [10]. A great number of network resources has been constructed and are being used for applications ranging from gene prioritization [11] and functional annotation [12] to comparative interactomics [13] and precision medicine [14]. A comprehensive, but incomplete database of network resources, pathguide.org [15], currently contains information about 702 resources. Although many of the resources are specialized, the volume of available resources makes it difficult to select the correct tool for the research question at hand. In order to make an informed decision it is important to know the underlying data and algorithms used in construction of the candidate tools. Knowledge about the inner workings of the resources allows for consideration of strengths and weaknesses of the different approaches from the perspective of the research question at hand. Additionally, the staggering number of resources, integration techniques and different types of data can make it overwhelming to get in to the growing field of genome-wide multi-omics networks. However, it is imperative that new researchers are able to understand and improve upon available resources, as well as develop new ones, to continue addressing the challenging questions of mechanisms behind complex phenotypes.
The aim of this paper is to describe the underlying data in functional association networks, as well as the most widely used integration algorithms. Techniques used in integration of sequencing data for construction of patient similarity networks are covered elsewhere [16]. There is also a review of two main algorithms used for patient data integration on a smaller scale [17], hence we will not cover those topics either. There is, however, no up-to-date report on genome-scale network integration that includes a comprehensive description of underlying data types and sources—a shortage we aim to address. Our main focus will therefore be the genome-wide functional association networks of genes and proteins. There are other intra-cellular molecules, e.g. metabolites and non-coding RNA, with important roles in the underlying biological networks [18]. Similar integration techniques could potentially be applied to these other molecules, but this and the description of the data to be used remain outside of the scope of this work.
This review will start by presenting the most widely used types and sources of data, as well as explaining their strengths and weaknesses. In the following section different types of genome-wide data integration techniques will be introduced. The final section, before Discussion, will describe a selection of representative examples of network resources.
Data types for network integration
Data stemming from different levels of biological organization e.g. DNA, RNA, protein and different experiments such as DNA sequencing, RNA-seq, Y2H, etc. needs to be evaluated prior to integration. A metric tailored to the specifics of each data type is therefore necessary to assess the strengths of the discovered interactions. The information content and the quality of individual data sets also need to be assessed and accounted for. Below is an overview of the majority of the most common data types and how they can be evaluated prior to integration (Figure 1; Table 1).
Figure 1.
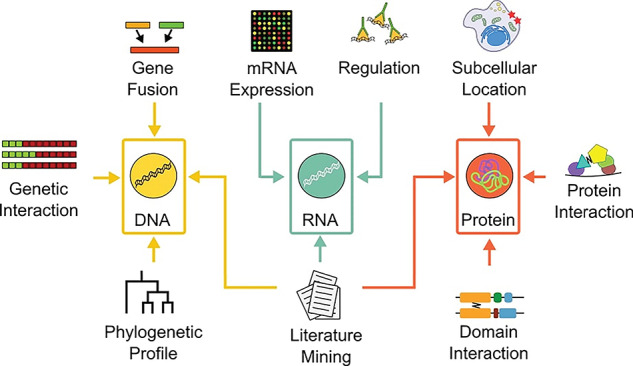
Typical evidence types. The evidence typ es’ data are generated using different experiments or computational techniques for different levels of biological information, i.e. DNA (yellow), RNA (turquoise) or proteins (red). There are different techniques for evaluating the information content of each data type e.g. correlation measures such as MI and Pearson correlation for mRNA co-expression.
Table 1.
Overview of strengths, weaknesses and scoring approaches of different data types for network construction
| Data type | Strengths | Weaknesses | Evaluation metric |
|---|---|---|---|
| Co-citation | High coverage and availability | High rate of false positives and false negatives | Term co-occurrence |
| Co-evolution | Flexible version of gene neighborhood with higher coverage | Noise due to e.g. gene duplications; influenced by the number and distribution of available complete genomes; cannot be used on essential proteins | Phylogenetic profile* similarity |
| Co-expression | High coverage and availability of mRNA co-expression data; protein co-expression is more reliable and direct | A proxy for co-regulation; low coverage for protein co-expression | Correlation-based |
| Co-localization | High coverage | Can miss inter-compartmental interactions. | Localization profile* similarity |
| Genetic interaction | Valuable source of indirect interactions | Lack of coverage. | Mutation profile* similarity |
| Gene neighborhood | High accuracy; available for all complete genomes | Not always robust due to complex structure of genomes; challenging with promiscuous domains and interactions of distantly located genes; fusion events are scarce | Constant score for gene fusion, distance & order of genes |
| Co-regulation | Provides indirect evidence of association | Lack of coverage and availability. | TF or miRNA profile* similarity |
| DDI | Lower false positive rate than PPI | Lack of coverage | Domain profile correlation |
| PPI | Direct evidence | High FPR and varied quality of evidence. | Correlation-based |
*‘Profile’ is defined as a binary vector indicating the presence or absence of a trait.
Co-citation
Co-citation is based on the idea that two proteins mentioned in the same scientific text likely stem from an experiment demonstrating a functional association. Instead of direct experimental evidence, co-citation-based evidence uses the scientific literature, describing protein interaction findings. Scientific literature can be mined using natural language processing and other techniques [19]. Such text mining involves finding gene or protein names, in abstracts or full texts of scientific literature databases such as Medline, and determining if an interaction between these genes or proteins exists. Gene or protein name pair co-occurrence, i.e. how often the terms are present in the same text, contrasted with frequency distributions of individual gene or protein names can be used for scoring of this data type.
Despite a clear advantage in coverage, co-citation data bring challenges diluting the true signal. The abundance of different identifier sources and gene synonyms increases the risk of false positives. If only abstracts are screened for co-occurrence, instead of full texts, the risk of false negatives may increase. Although most of the scientific literature is focused on positive interactions, distinguishing between positive and negative interactions purely by studying co-occurrence is impossible and may be another source of false positives. Finally, identifying the species of the detected gene or protein pair is nontrivial and may add additional false positives to the results.
Co-evolution
During the process of species evolution, molecular changes in interacting proteins tend to occur in concert [20]. Co-evolution can therefore be used to identify functionally associated proteins. Co-evolution of a protein pair can be scored using the ‘mirror tree’ [21] method that relies on the Pearson correlation of distance matrices for the studied proteins. Another scoring technique is to first construct binary vectors showing presence and absence of a protein across a collection of species i.e. a phylogenetic profile [20] and then compare the similarity of such profiles for different proteins. A more elaborate but still computationally efficient method relies on identification of present and absent sub-trees in the species trees of studied proteins [22]. The species trees can be constructed using orthologs from an orthology database such as InParanoid [23]. Other more complex and computationally expensive techniques are also available. The size of phylogenetic profiles grows larger with the number of available sequenced genomes. This increases the sensitivity and robustness of this data type. However, noise is unavoidable due to gene duplications and other genomic events [24].
Co-expression
Since regulation affects expression, co-expression can be viewed as a proxy for co-regulation, making it suitable for prediction of functional association between proteins coding for the co-expressed genes. Two co-expressed genes are assumed to be functionally associated if they have similar expression profiles across various conditions. This feature is supported by the fact that genes with similar co-expression profiles have been observed to interact more frequently than would be expected by chance [25–27]. Similarity of co-expression profiles across multiple experimental conditions and time points assessed by Pearson correlation, Spearman’s rank correlation or mutual information (MI) can be used as a measure of association between genes.
The most common experimental technique to obtain gene expression data is microarray technology that relies on the hybridization ability of complementary nucleotide strands. Microarrays are chips of short, unique DNA fragments—so-called ‘probes’— attached, in a predetermined arrangement, to a surface of glass or silica. mRNA from cells, fluorescently marked and often transcribed to complementary DNA (cDNA), is applied to the chip for hybridization with complimentary strands. All unbound fragments are washed away. The competitive binding produces signal strengths proportional to the levels of the available fragments. The raw signal strengths need to be normalized and preprocessed before the intensities of the different probes can be presented. The cross-hybridization of transcripts to probes for genes of high similarity can inflate expression values and poses a particular concern mitigated by removing genes of high sequence similarity. The most comprehensive sources of microarray data are the gene expression omnibus (GEO) [28] and ArrayExpress [29].
When shotgun sequencing is applied to RNA in order to determine its quantity in a sample, it is called ‘RNA sequencing’ (RNA-seq). RNA-seq is another promising source of gene expression data that has evolved tremendously during the recent years [30]. RNA-seq usually involves a step where RNA is extracted from the sample, then either fragmented directly or converted to cDNA before the fragments are sequenced. The reads produced by shotgun sequencing are then either first aligned to a reference genome before assembly or assembled into de novo transcripts and then aligned to a reference genome. All these steps involve sophisticated statistical techniques due to the short read lengths and combinatorial complexity of read alignment. A more detailed description of this process can be found in [31], but RNA-seq technology is evolving so rapidly that many of the analysis steps are constantly updated. Since RNA-seq is not constrained by specifically synthesized probes limited to certain sequences, it provides a more unbiased and complete coverage of the genome than microarrays. This can be seen in its superior ability to detect post-translational modifications, alternative splicing, gene fusions, single-nucleotide variants (SNPs) and small RNAs such as micro-RNA (miRNA), ncRNA, tRNA, etc. [32]. It also lacks the cross-hybridization issues inherent to the microarray technology. Besides the inherent limitations common to all NGS techniques, like variation in read depth across the genome [33], RNA-seq is still a relatively expensive technique that has some additional biases e.g. the short read lengths produce a high uncertainty of read assignment for sequences of low complexity or high similarity.
Due to post-translational modifications and regulation, the levels of mRNA expression do not always correlate with the levels of protein expression [34]. Studying protein expression directly can therefore be a more reliable way of detecting functional association. mRNA expression data have much higher coverage and are therefore still necessary for completeness. Protein expression can be assessed by various proteomic techniques such as quantitative mass spectrometry (MS) [35] or antibody-based protein microarrays [36]. Two relatively comprehensive data source containing protein expression is the PRIDE Archive [37] and the human protein atlas (HPA) [38]. The latter one covers in 32 human tissues and 36 human cell lines. Another large collection of protein abundance data for several species in various tissues and cell types is stored in PaxDB [39]. As with mRNA expression data, protein expression data can be used to construct protein profiles based on tissues, cell types and experimental conditions. Pairwise similarity between such profiles of different proteins can be assessed using MI or adapted Jaccard index [22], providing a score for this data type.
Co-localization
In order for proteins to interact physically they need to co-localize to the same sub-cellular compartment at the time of interaction. This trait can be utilized to determine functional association of proteins [40]. Both experimentally determined and predicted sub-cellular localization of proteins is available through various resources [38, 41–43] with the Gene Ontology (GO) being one of the largest (Table 2).
Table 2.
Primary data sources for network construction
| Short name | Description | Reference |
|---|---|---|
| BioGRID | A database of PPIs and genetic interactions for all major model organisms and Homo sapiens. Consists of manually curated interactions retrieved from peer-reviewed medical literature. Version 3.5.166 contains 1 623 645 protein and genetic interactions among 69 440 unique proteins/genes. | [102] |
| GO | GO aims to provide a controlled vocabulary for consistent, species-agnostic descriptions of proteins. The GO consists of three ontologies: molecular function (MF), biological process (BP) and cellular compartment (CC) each with hierarchically structured protein annotating terms. The MF ontology describes protein or protein complex activities at the molecular level without providing the context in which an activity takes place e.g. adenylate cyclase activity or Toll receptor binding. The BP ontology contains terms describing grouped series of activities at the molecular level e.g. histone phosphorylation. The CC ontology contains terms describing sub-cellular location of proteins. | [105] |
| KEGG | KEGG is a collection of 15 manually curated databases of pathways, chemical reactions and drugs. The information in KEGG is divided into four categories: ‘system’ e.g. pathways, ‘genomic’ e.g. orthology, ‘chemical’ e.g. reaction and enzyme and ‘health’ e.g. disease. KEGG performs functional annotation of genes, constructs pathways based on literature mining and biological networks based in interaction data. | [106] |
| Pathway Commons | A database of biological concepts including biochemical reactions, GRNs, genetic interactions, transport and catalysis events and physical interactions involving proteins, DNA, RNA, small molecules and complexes. Data are gathered from 22 partner databases including WikiPathways, Reactome, KEGG, etc. The data are mapped, normalized and merged using the BioPAX format. The current version (November 2018) contains over 37 600 pathways in multiple species. | [107] |
| Reactome | An ordered network of biological processes with GO-like hierarchical structure. Reactions e.g. classical biochemical, bindings, etc. with experimental evidence are mined from literature, grouped into pathways based on temporal and other connections, curated and peer-reviewed. The current version (62) annotates pathways in 19 species including human with 2244 human pathways incorporating 10 719 genes, small molecules and 11 823 complexes. | [108] |
| Wiki-Pathways | WikiPedia-style community-curated and dynamically updated resource for models of biological pathways. The current version (November 2018) consists of pathways in 29 different species. | [109] |
In order to increase reliability of scoring of co-localization it is prudent to consider as many cellular compartments as possible. The size of each compartment i.e. the number of proteins annotated with it, is also of importance since larger compartment increases the chance of spurious co-localization of any proteins in that compartment. A profile based on presence/absence of a protein in all sub-cellular compartments can be constructed for each protein. MI between profiles or co-occurrence across different compartments, for a protein pair, weighted by the compartment size can be a suitable metric for this data type [44].
Co-regulation
To facilitate regulation of genes involved in the same cellular processes their transcription may be linked via TFs. Patterns of TF binding can therefore be used as evidence of functional association. This data type is often referred to as co-regulation and means that functionally associated proteins will likely be regulated in the similar fashion yielding similar TF patterns.
Chromatin immunoprecipitation-on-chip (ChIP-chip) and chromatin immunoprecipitation sequencing (ChIP-seq) are two of the most widely used techniques for elucidating patterns of TF binding. Both techniques start by cross-linking the DNA-bound proteins with their DNA targets. The DNA is then shredded and the proteins of interest are tagged with antibodies, which are used to separate out the protein-bound DNA fragments. After this step, the cross-linking is reversed, and the DNA fragments are purified and amplified. Finally, the DNA fragments can either be sequenced directly (ChIP-seq) or denatured, fluorescently labeled and applied to a microarray for sequence identification (ChIP-chip) [45].
Changes in gene expression as a result of changes in expression of TFs can be analyzed to get more indirect evidence of TF regulation. Both the direct binding detected by ChIP-chip and ChIP-seq and the indirect analysis are stored in databases [45–47].
Regulatory control within the cell is also excreted by various non-coding RNA, e.g. miRNA, small interfering RNA, etc. Regulatory patterns for these molecules can also be utilized for prediction of functional association. Owing to a large number of specific targets and its ability to completely alter protein expression, miRNA has been the more utilized molecule in this field. It is a short (23 nucleotides) RNA that folds into hairpin-like structures, which can base pair to the mRNA of its targets, affecting post-transcriptional levels of targeted genes [48]. It is still challenging to determine regulatory relationships for miRNA and its targets using experimental techniques so most of the data come from sequence complementarity predictions of miRNA and target mRNA [49].
Scoring for both TF and miRNA co-regulation can be done by comparing of regulation profiles (TF or miRNA) for a gene pair using some measure of similarity e.g. shared fraction of target sites of a gene pair in relation to all target sites of the two genes, or Pearson correlation of profiles, etc.
Domain-domain interaction
A structurally and functionally well-defined section of a protein is referred to as a protein domain. It is able to demonstrate a distinct folding independent from the folding of other parts of the protein. Due to their functional independence, protein domains exhibit higher conservation over time compared to full length proteins, making domain–domain interactions (DDIs) more reliable for inference of functional association than protein–protein interactions (PPIs) [50, 51]. Unfortunately, the amount of experimental DDI data is vastly surpassed by that of PPI, and computational DDI prediction techniques are usually involved to increase coverage. Both experimentally determined and computationally predicted DDIs are available from databases like InterPro [52] and can be mapped to their corresponding proteins using databases such as Pfam [53].
One approach to evaluating DDIs compares the observed and the expected co-occurrence of a domain pair, where the latter is calculated from the individual frequencies of domains [54]. Another approach calculates the MI [55] between domain profiles based on domain occurrence in the genome [27].
Genetic interaction
The term ‘genetic interaction’ was first discussed in detail in 2008 by Ramamurthy et al. [56]. However, genetic interaction, in the context of functional association networks, indicates that two mutated genes with known phenotype can produce an unexpected phenotype when the mutations happen at the same time. The mechanism behind this phenomenon is often described as genetic interaction and it can sometimes be as extreme as two, on their own benign mutations causing cell death when inflicted at the same time [57, 58]. The ‘synthetic genetic array’ analysis [59] is an automated technique to systematically test pairwise mutations in Saccharomyces cerevisiae [60]. Scoring of this data type is based on similarity of mutation profiles of two genes, calculated using Pearson correlation.
Gene neighborhood
Genes giving rise to interacting proteins or domains can sometimes fuse in a process called ‘gene fusion’ [61]. The discovery of fused genes has therefore been used as so-called gene neighborhood evidence of functional association [62]. Naturally, not all interacting proteins or domains will give rise to fused genes, limiting the coverage of this data type. Some false positives can also be produced since protein or domain interaction is not the only reason leading to gene fusion. Therefore, a constant score reflecting the limitations of this data type can be assigned to the interactions identified through gene fusion.
Organization into jointly transcribed regions, i.e. operons is another way that functionally associated genes stay in proximity. This feature facilitates transcriptional regulation in prokaryotes since all the genes in the operon can be regulated by a single promotor. Thus, membership in the same operon can be utilized as evidence for functional association [63]. Due to recombination events in eukaryots, operons are not commonly observed there. However, regulation at the chromatin level forces clustering of genes with similar expression patterns [64] enabling the use of gene neighborhood as evidence of functional association. Scoring is usually based on both the intergenic distance and the gene order.
Whole-genome comparisons give rise to information about spatial organization of genes e.g. gene fusion and order, with results stored in the previously mentioned protein domain databases.
Protein-protein interaction
A plethora of automated experimental techniques e.g. Y2H, affinity purification (AP) or tandem AP (TAP) followed by MS i.e. AP or TAP-MS, co-immunoprecipitation (coIP), can be utilized to produce large-scale PPI data [65]. The output of these high-throughput experiments is captured in databases such as biomolecular interaction network database (BIND) [66] and database of interacting proteins [67]. Such primary databases can in turn be combined into more comprehensive databases aggregating resources e.g. iRefIndex [68].
The Y2H system is intended to study PPIs in vivo, where one of the interacting proteins is fused with the DNA-binding domain and the other with the activation domain of a TF for a reporter gene. If proteins interact, the reporter gene is successfully transcribed and the transcript can be detected. In coIP, antibodies for proteins of interest are added to a whole cell extract and the immune complex is precipitated. Any unbound proteins are washed away while the interacting partners of the antibody-tagged protein can be separated and analyzed. In the in vitro purification method AP-MS, the target protein, also known as ‘bait’, is immobilized on a surface and washed over by a mixture of proteins, referred to as ‘prey’, in a liquid phase. The interacting proteins are captured by the ‘bait’, digestedand identified using MS. TAP-MS is an in vivo technique where the ‘bait’ is double tagged and undergoes two consecutive steps of purification, followed by the separation and digestion of caught ‘prey’ and subsequent identification by MS.
There is certainly evidence of functional association in the form of direct physical binding between proteins, i.e. PPIs [69]. Such evidence is sometimes used directly, fully relying on the underlying experimental techniques [70] in PPI networks of model organisms e.g. S. cerevisiae [71], Drosophila melanogaster [72], etc. Unfortunately, all experimental techniques, especially the large-scale ones, have intrinsic biases, yielding high rates of false positives (e.g. 25–40% for Y2H [73]) and lacking coverage. Because AP-MS is done in vitro, it can falsely suggest an interaction between proteins never present in the same sub-cellular compartment or because of non-native protein folding [74]. TAP-MS can correct for this, but is unable to detect low-affinity or transient interactions as well as interactions sterically hindered by the tag or mediated by a 3rd protein. Another limitation of this type of evidence is the mixed quality of the tested interactions. Due to the use of different experimental techniques, e.g. Y2H producing only binary interactions or coIP with one-to-many interactions, the reliability of interactions with respect to functional association varies. One should therefore exercise caution when using PPI evidence from a single type of large-scale experiments.
Evaluation of PPI data is usually based on the observed number of interactions between a pair of proteins in relation to the number of interactions that each individual protein has in total. The studied, direct ‘bait–prey’ interactions have been shown to be more reliable than the indirect ‘prey–prey’ ones [75]. Because of this, the ‘prey–prey’ interactions are sometimes excluded or down-weighted.
Orthology transfer
Orthologs are genes in different species that stem from the same gene in an ancestral species. It has been shown that orthologs remain functionally conserved [76]. This feature can be utilized to map functional associations in one species to another via ‘orthology transfer’. This increases the genome coverage up to the point of reconstructing an entire interactome of a species without large-scale experimental evidence [44].
The 1st step in orthology transfer is the mapping of orthologs using orthology databases, e.g. InParanoid, eggNOG [77], HomoloGene [78], etc. The transfer of interactions can then be done either by only considering the reciprocal best hits or all orthologs above a certain threshold or by taking into account the entire clusters of orthologs. If something other than reciprocal best hit is considered, the scores associated with the links need to be combined either by averaging across all the scores or by only considering the ‘best’ values, e.g. maximum Pearson correlation, maximum MI, etc.
Other data types
Copy number variations [79], SNPs [80] and small Insertions/Deletions [81] are examples of genetic variations that are commonly used in cancer network integration and for other disorders. Additionally, epigenetic variations [82] in the form of DNA methylations are common for disease-specific data integration. Disease-specific variations are rarely used for genome-wide network integration and since they are already well covered in other reviews [16, 83, 84], we will not dwell on them here.
Network inference
Prediction of genome-scale biological networks from a single experiment or type of experiment is prone to biases and offers only partial view of the underlying complex network [85] (Figure 1). Both coverage and quality of the predicted network can be dramatically improved by integrating different types of data across multiple experiments [85–87]. The collected data are, however, not intended for integration, resulting in a number of challenges that need to be addressed before and during the integration. The pure volume of data intended for integration can be overwhelming. Different amount of data is generated by different experiments where one type of experimental data, if not properly managed, could overwhelm the network inference algorithm drowning out the signal from all the other data sources. Heterogeneity in terms of quality, sparsity and biases e.g. toward more studied genes also needs to be accounted for [24].
Following data collection, the integration into one cohesive network can be accomplished by producing networks from individual data sets and using e.g. the unweighted sum of individual inferred networks [88]. Another approach is to perform integration at the data level, inferring a cohesive network after all the collected data are integrated.
The ways to infer networks and integrate the data has evolved during the past decades (Figure 2). One of the earlier attempts used a simple majority-voting approach, retaining only the interactions seen in the majority of the data sets [89]. More sophisticated machine learning techniques e.g. linear [57] or non-linear regression models [90], random forest [91], support vector machines [92] and Gaussian random fields [93] performed weighted integration of the underlying data. Most state-of-the-art network resources rely on a naïve Bayesian classification approach (see Box 1) [94–99]. This is mainly due to the fact that it is essential to know where the evidence of an association originated, which can be easily tracked down using Bayes. One assumption of Bayes is the conditional independence of the data. This is rarely valid because many of the studied interactions reoccur in different data sets and increases the risk of false positives. Therefore, it is necessary to correct for the redundant evidence decreasing the risk of false positives [22, 99, 100].
Figure 2.
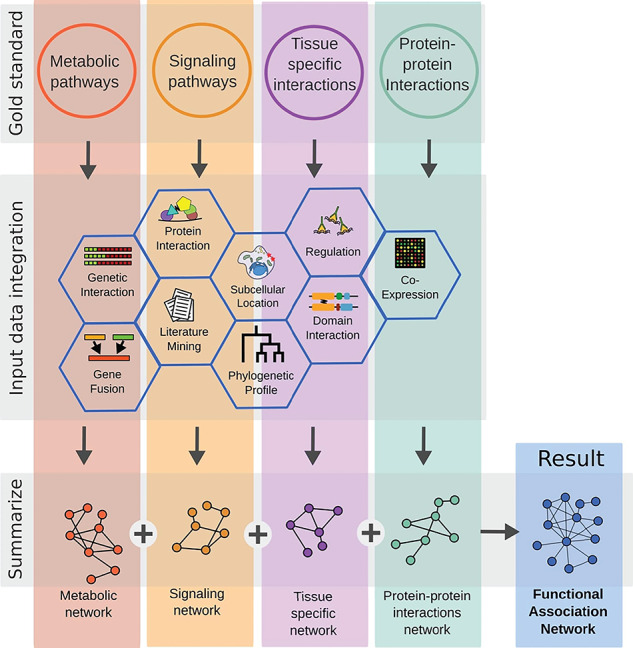
Example workflow to infer a functional association network. All supervised inference methods use a diverse collection of gold standard set. These sets represent known interactions between genes or protein. For example, proteins that physically interact or genes that are present in the same tissue or pathway. Once these homogeneous sets are defined, they can be applied separately as labels to an assemblage of input data spanning from co-expression over domain interaction to phylogenetic profiles. The labeled data are further used to train supervised methods and predict interactions between genes that have been not known so far. Each prediction is still specific to the gold standard used for labeling the data to begin with. To increase the power and coverage most methods summarize all networks in a ensemble network, incorporating all interaction types. Since the interaction loses its gold standard specific meaning it is newly defined as functional association.
Box 1: Naïve Bayesian classification
The most popular approach for integration of multiple heterogeneous types of data is naïve Bayesian classification. For genome-sized networks it has been demonstrated to outperform other statistical classifier-based techniques [54]. It is also practically unbiased and tolerant to missing values and noise. Bayesian classification in the context of data integration for construction of genome-wide association networks applies Bayes’ factor (1) to determine if an association A is present or absent given the observed experimental data E.
 |
(1) |
The Bayes’ factor provides the odds of the posterior of an association and its complement, i.e.  . From
  data sets, multiple pieces of evidence
  can be combined for an association using the likelihood ratios between the marginal probabilities for each piece of evidence (2). Assuming that each piece of evidence is unrelated to all the other pieces constitutes a naïve Bayesian classifier.
 |
(2) |
When naïve Bayesian classification is used for network integration in network resources such as FunCoup [101] a more convenient form of the classifier is obtained by taking the logarithm of both sides resulting in the log-posterior odds being equal to the sum of log-prior odds and the natural logarithm of the likelihood ratios (LLRs) (3).
 |
(3) |
Example: In a 1st step, each piece of evidence,  , is scored using the evidence type-specific metric e.g. Pearson correlation for mRNA expression or MI for DDI. In the following training step, all scores of a data set
  are used to generate two score distributions, representing all positive and negative gold standard associations. During a prediction step these distributions are used to estimate
  of a new score
  . Finally, the sum of LLRs represents a measure of strength of the predicted association.
Gold standards
All of the above mentioned data integration approaches rely on the availability of positive and sometimes negative training examples, so-called gold standards. Suitable positive gold standards consist of verifiable aka ‘true’ functionally associated gene pairs of different classes, e.g. physical protein interactions, membership in the same protein complex or the same operon, etc. Training on each of these classes produces a network enriched for that class of interaction. Combination of networks produced using training on different gold standards allows for detection of a wider definition of functional association. [24]
Typical sources of positive gold standard training sets are BioGrid [102] or iRefIndex for PPIs, Kyoto Encyclopaedia of Genes and Genomes (KEGG) (Table 2) or GO for co-membership in curated pathways and OperonDB [103] for co-membership in operons.
Ideally, also the negative gold standard examples should be verifiable and of high quality. However, it is challenging to find anything, but small sets of experimentally validated non-interacting proteins [104]. This exemplifies how challenging it is to find reliable evidence of absence of interactions forcing researchers to use other approaches. One such approach is assigning protein pairs with different locations in the cell e.g. nucleus and mitochondria, to the negative gold standard class. Another way is to look for lack of co-citation in pathways or terms of either KEGG or GO [54, 70]. Neither of these is a guarantee that a functional association is truly absent, which may result in a negative gold standard set potentially polluted by positive examples. Hence, techniques utilizing sets of randomly selected genes from the network can be used to simulate a base level of random interaction in the data [44].
Unsupervised approaches
There are unsupervised network prediction methods that do not require gold standards. Instead they may use some of the topological properties of the network, such as modularity, to assign a confidence score to an interaction [110]. Such techniques present a good alternative whenever gold standard data are scarce or biased. However, they are unable to represent the full range of complexity of functional associations and depend heavily on the underlying module discovery algorithms [111] and are therefore not commonly used for prediction of genome-scale networks.
Other popular unsupervised techniques include non-negative matrix factorization (NMF) [112]. NMF is readily used for dimensionality reduction and clustering [17], but belongs to a class of matrix completion methods with many other applications. NMF in data integration uses the raw data adjacency matrix representing the sparse interaction network to find two (or three) low-rank non-negative factor matrices that approximate the input. The factors can then be multiplied to predict network links from the initial, incomplete and noisy input [113]. NMF is mostly used for clustering of heterogeneous networks, such as gene-patient networks in cancer [114] or for gene prioritization [115]. Since NMF is rarely used for data integration of genome-scaled networks and due to the fact that it has been covered in other reviews e.g. [17], we will not go into its details.
Network resources
The selection of up-to-date widely used resources described below provides examples of how data can be integrated to predict genome-sized networks of functional association (Table 3). A more comprehensive collection can be accessed at pathguide.org.
Table 3.
Network resources.
| Resource | Data types | Attributes | Reference | ||||||||
|---|---|---|---|---|---|---|---|---|---|---|---|
| Co-annotation | Co-evolution | Co-expression | Co-localization | Genetic interaction | Gene neighborhood | Co-regulation | DDI | PPI | |||
| FunCoup | X | X | X | X | X | X | X | Focus on experimental data and comparative interactomics | [101] | ||
| GeneMANIA | X | X | X | X | Integration at the network level and gene function prediction | [97] | |||||
| GIANT | X | X | Tissue- and cell line-specific networks for H. sapiens | [124] | |||||||
| HumanNet | X | X | X | X | X | X | Built-in gene prioritization and advanced GUI | [98] | |||
| IID | X | X | Tissue-specific networks for six species | [129] | |||||||
| IMP | X | X | X | X | Developmental time points of H. sapiens | [99] | |||||
| STRING | X | X | X | Xa | X | X1 | X | X | Exhaustive collection of prokaryotes; major contribution from co-annotation | [70] | |
aEvidence imported from other resources.
FunCoup (http://funcoup.sbc.su.se) The framework of Functional Couplings (FunCoup) [12, 13, 22, 44] is a resource of genome-wide functional association networks of H. sapiens and 17 model organisms containing 49122943 interactions. FunCoup uses naïve Bayesian integration of various types of data. Furthermore, InParanoid is used for orthology transfer of interaction data between species. The FunCoup framework applies a unique scoring function for each data source producing raw metric scores that are mapped to LLRs for functional association of each data set, species and type. Mapping is done using gold standard data of following types: metabolic and signaling pathways, confirmed protein interactions pairwise and in complex, as well as co-transcriptional regulation using operons. The summed LLRs from individual data sets are converted into a confidence score for each link in the network.
Since the FunCoup resource is based exclusively on data from experimental evidence the use of FunCoup can be of particular interest to users wanting to avoid text mining-related data types. The resource forms the base for different network analysis tools [11, 101] and for understanding the function or neighborhood of gene targets of interest [116, 117].
GeneMANIA (https://genemania.org) Multiple association network integration algorithm (GeneMANIA) provides functional association networks for H. sapiens and 8 model organisms and covers almost 600 million interactions between 164 000 genes [97]. PPI and genetic interactions from iRefIndex and BioGRID together with interactions predicted using DDI from InterPro, co-expression from selected GEO data sets and manually curated data sets are used to create weighted, data set-specific networks. Regularized ridge regression [118] is applied for weighting and co-annotation in GO is used as the gold standard. Links from the data set-based networks are normalized by degree and multiplied to produce a weighted composite network. GeneMANIA also supports a user-friendly Cytoscape add-on [119] and furthermore focuses on single gene and gene set function prediction [120–122].
GIANT (giant.princeton.edu) Genome-scale Integrated Analysis of gene Networks in Tissues (GIANT) [123] uses a Bayesian approach to integrate data from BioGRID, IntAct, GEO, etc. into 144 tissue and cell line-specific networks. The tissue-specific gold standards are based on experimentally produced GO terms selected by expert as well as BRENDA Tissue Ontology [124]. This naturally qualifies the resource for identification of tissue specific H. sapiens sub-networks for a gene of interest [125, 126].
HumanNet (http://www.functionalnet.org/humannet/) The human gene functional interaction network (HumanNet) [98] employs a naïve Bayesian approach with redundancy reduction to integrate a collection of co-expression, PPI, genetic interaction and DDI data sets with co-citation into a network for H. sapiens with orthology transfer using three model organisms, i.e. fly, worm and yeast. Co-annotation in an expert curated set of GO terms from the Biological Process ontology are used as the gold standard. The network harbors 476 399 links between 16 243 protein coding genes and offers an advanced graphical interface with built-in gene prioritization capabilities. It has been used for prediction of cancer driver genes [127] and as the starting point for network structure optimization [128].
IID (http://iid.ophid.utoronto.ca/iid) Integrated Interactions Database (IID) [129] incorporates PPI networks of 30 different tissues and six species. The database discriminates between three different kind of protein interactions, experimental validated, high-confidence predicted interactions and orthologous interactions. The orthologous interactions are transferred interactions between orthologous proteins. Tissue specificity is assigned to the interactions by mapping the proteins to data obtained from the HHPA [130] and PaxDb [39].
IMP (imp.princeton.edu) Integrative Multi species Predictions database [131], contains networks of H. sapiens and six model organisms. The networks are inferred via integrating data of several experiments covering various developmental time points and tissues. Therefore, the authors used a regularized Bayesian method [132]. The web service utilizes orthology information to provide functional annotation with cross-species annotation terms.
STRING (https://string-db.org) The Search Tool for the Retrival of Interacting Genes/Proteins (STRING) is one of the most widely used resources of genome-wide functional associations [70]. It combines interactions from primary databases such as BIND and PID as well as data from curated databases e.g. GO, KEGG, etc. together with predicted interactions using conserved gene neighborhood, phylogenetic co-occurrence, co-citation and mRNA co-expression. KEGG pathways are used as a source of gold standard data where each data set gets a score that represents the probability of finding the tested interacting partners within the same KEGG pathway. Orthology transfer is performed and adjusted by the evolutionary distance between species in a phylogeny. Scores for each interaction in different data sets are combined into a final score assuming independence between data sets. STRING has an application programming interface access and incorporates all GEO microarray platforms and experiments. It contains networks for over species. However, the vast majority of species are prokaryotic where species definitions are not always clear, which may increase the number of false positive interactions. Additional source of false positives is the fact that some data sets are added without benchmarking against a gold standard, thereby propagating the FPRs of the underlying experimental methods. Since the most dominant data type incorporated into the network is co-citation, additional noise and unintentional bias stemming from text mining [133] may be included in the database.
Discussion
The vast amount of interactional data is being combined into networks of functional association. Here we have explored the most common data types and methods used in the construction of such networks, to help researchers make informed decisions about which of the many network resources would fit their particular research question. Additionally, this report can serve as a primer for new researchers in the domain of data integration and allow them to penetrate this comprehensive field.
It is apparent that none of the currently available data types can serve as a universal input data for generating reliable genome-wide association networks with sufficient coverage. A data type can usually either contribute to high accuracy e.g. DDI, but lacks in coverage or have a great coverage e.g. co-expression, but is less reliable. The upside is that integrating several datatypes balances out the individual biases providing networks with high coverage and higher reliability. This integration, at least at the moment and for the genome-wide networks is preferably done using Bayesian techniques. Such approaches present a flexible model able to cope with missing data and provide probabilistic scoring for predicted interactions.
As is evident in the network resource section, there are many ways to construct a genome-wide network. Some key steps can, however, be identified in most approaches. One such step is the selection of a collection of reliable datasets, preferably pertaining to orthogonal datatypes including high coverage ones e.g. co-expression from GEO and more direct evidence, e.g. DDI from InterPro. The orthogonality of data types can increase the network coverage, capture a more diverse type of functional associations and increase the true signal in the data. Another important aspect is the generation of high-quality, curated gold standards both positive, using e.g. KEGG metabolic pathways, and negative where the negative ones can be substituted for a baseline of random interactions. The type of gold standard will determine the type of interactions for which the resulting network will be enriched. Using different types of gold standards will therefore make the resulting association network more rich in types of functional annotations that can be captured thereby uncovering a larger part of the underlying cellular biological network. Sticking with one type of gold standard will, on the other hand, purify the network for just one type of functional association, e.g. pure PPI networks, which can be suitable if the research question involves direct physical interactions.
Many networks are constructed for multiple species either just the common model organisms as in IMP (7 species) or an extended set of model organisms as in GeneMANIA (9 species) and FunCoup (18 species) or most of the sequenced species like in STRING. The species specific networks are excellent for researchers with research questions in a particular species, but also as a source of additional evidence of interactions harnessed by orthology transfer. The transfer of data across species can be viewed as a coverage increasing data type and an additional source of evidence and involves selection of a reliable orthology database e.g. InParanoid, for identification of orthologs.
Variations of nav̈e Bayesian integration techniques used in the most comprehensive association networks e.g. STRING, FunCoup, etc. require scoring techniques tailored to the individual datatypes, e.g. profile similarity or correlation-based. Additionally, the integration process needs a way to account for the violation of independence assumption in the  Bayesian techniques. Different redundancy weighting approaches based on MI or correlation between datasets have been successfully applied for this purpose [22, 98].
One of the limitations of the current network inference approaches is the failure to account for the dynamical aspects of interactions. These aspects involve the distinction between stable interactions in a protein complex versus the transient events in a signaling pathway or different time-dependent aspects of an interaction [134]. The simple cause of this limitation is the lack of coverage, but novel experimental techniques e.g. time-resolved MS [135] are trying to address this.
A strive for high coverage is apparent in the fact that data used for inference can stem both from normal tissues at different experimental conditions and from diseases and other pathologies. Separating the data from healthy tissue, from that of diseased one into distinct networks, could strengthen the true interactions important for the different conditions in the respective network.
Another potential limitation is not restricted to the field of data integration, but concerns machine learning in general and stems from the use of supervised learning techniques. Accuracy of network prediction is tightly coupled to the quality and coverage of the underlying gold standards. The unsupervised approaches such as ‘multiple dataset integration’ [136] are still lacking genome-wide applications. Additionally, also the unsupervised techniques are subject to annotation bias resulting from over-representation of some genes and phenotypes in different experiments.
A more practical aspect of network resources is that in addition to there being many of them present (pathguide.org), a substantial part are neither relevant nor appropriately maintained. This is unfortunate and stresses the need for a more updated repository of information about the available network resources.
As of Today, there is no good way to compare different network resources. A naïve approach of studying the number of links for e.g. the whole H. sapiens network or taken at a specific confidence threshold in order to compare only the most reliable links is not particularly useful, since the approach for assigning confidence to a link can differ significantly between the networks. Slightly more information could potentially be gained by looking at the distributions of confidence scores in different networks. However, this comparison also suffers from lack of consistency in the assignment of confidence scores. An external source such as GO has been used for validation as for HAPPI-2 [137], but data cross contamination may bias the results. Other experimentally attained sources may be useful, but run the risk of being too small or if large enough, they are soon incorporated directly or indirectly into the studied networks.
In conclusion, despite current challenges and limitations in the field of functional network inference, it has produced many useful tools to uncover fundamental questions from the biological domain.
Key Points
Data from different levels of biological organization, e.g. DNA, RNA and protein, can be integrated into functional association networks that are used to increase the understanding of the intra-cellular processes leading to complex diseases.
Key steps of construction of functional association networks are collection of reliable data pertaining to independent data types, scoring and evaluation of the collected data and use of high-quality gold standards for training of the network model using a robust network integration technique.
All data types used for integration have unique strengths and weaknesses, many of which can be overcome by integration with other data, orthogonal data types.
Naïve Bayesian classification is the most popular approach for integration of multiple heterogeneous data types and its performance relies heavily on the quality of gold standards used for training.
Many functional association networks are already available to the research community. The large volume of such resources and the lack of a standardized way to compare them makes the selection of the proper tool for the research question at hand a considerable challenge.
Funding
Swedish Research Council (VR 2015-05342); German Federal Ministry of Education and Research (031L0047 to N.S.M., 02NUK045A to C.O.)
Dimitri Guala has a PhD in Bioinformatics from Stockholm University where he currently holds a PostDoc position in the field of network biology, specializing in applications of functional association networks.
Christoph Ogris holds a PostDoc postition at the Computational Cell Maps (CCM). His research focuses on exploiting biological networks to identify disease specific cross omic interations.
Nikola Müller is head of the research group CCM at the Institute of Computational Biology, Helmholtz Center Munich, specialized on data integration in the context of biomedicine.
Erik L L Sonnhammer is the head of the Stockholm Bioinformatics Center focusing on development of new algorithms in orthology, network inference, and domain architecture analysis.
References
- 1. Fields S, Song O. A novel genetic system to detect protein–protein interactions. Nature 1989;340:245–6. doi: 10.1038/340245a0. [DOI] [PubMed] [Google Scholar]
- 2. Stephens ZD, Lee SY, Faghri F, et al. Big data: astronomical or genomical. PLoS Biol 2015;13:e1002195. doi: 10.1371/journal.pbio.1002195. [DOI] [PMC free article] [PubMed] [Google Scholar]
- 3. Yu H, Braun P, Yildirim MA, et al. High-quality binary protein interaction map of the yeast interactome network. Science 2008;322:104–10. doi: 10.1126/science.1158684. [DOI] [PMC free article] [PubMed] [Google Scholar]
- 4. Yu CL, Louie TM, Summers R, et al. Two distinct pathways for metabolism of theophylline and caffeine are coexpressed in pseudomonas putida CBB5. J Bacteriol 2009;191:4624–32. doi: 10.1128/JB.00409-09. [DOI] [PMC free article] [PubMed] [Google Scholar]
- 5. Piro RM, Di Cunto F. Computational approaches to disease-gene prediction: rationale, classification and successes. FEBS J 2012;279:678–96. doi: 10.1111/j.1742-4658.2012.08471.x. [DOI] [PubMed] [Google Scholar]
- 6. Menche J, Sharma A, Kitsak M, et al. Disease networks. Uncovering disease–disease relationships through the incomplete interactome. Science 2015;347:1257601. doi: 10.1126/science.1257601. [DOI] [PMC free article] [PubMed] [Google Scholar]
- 7. Zhang W, Sun F, Jiang R. Integrating multiple protein–protein interaction networks to prioritize disease genes: a Bayesian regression approach. BMC Bioinformatics 2011;12:S11. doi: 10.1186/1471-2105-12-s1-s11. [DOI] [PMC free article] [PubMed] [Google Scholar]
- 8. Yang S, Lee I, Hwang S, et al. HumanNet v2: human gene networks for disease research. Nucleic Acids Res 2018;47:D573–80. doi: 10.1093/nar/gky1126. [DOI] [PMC free article] [PubMed] [Google Scholar]
- 9. Pržulj N, Malod-Dognin N. Network analytics in the age of big data. Science 2016; 353:123–4. doi: 10.1126/science.aah3449. [DOI] [PubMed] [Google Scholar]
- 10. Hassani-Pak K, Rawlings C. Knowledge discovery in biological databases for revealing candidate genes linked to complex phenotypes. J Integr Bioinform 2017;14(1). Retrieved 3 July 2017, doi: 10.1515/jib-2016-0002. [DOI] [PMC free article] [PubMed] [Google Scholar]
- 11. Guala D, Sjölund E, Sonnhammer ELLE. Maxlink: network-based prioritization of genes tightly linked to a disease seed set. Bioinformatics 2014;30:2689–90. doi: 10.1093/bioinformatics/btu344. [DOI] [PubMed] [Google Scholar]
- 12. Ogris C, Guala D, Helleday T, et al. A novel method for crosstalk analysis of biological networks: improving accuracy of pathway annotation. Nucleic Acids Res 2017;45:e8. doi: 10.1093/nar/gkw849. [DOI] [PMC free article] [PubMed] [Google Scholar]
- 13. Alexeyenko A, Schmitt T, Tjärnberg A, et al. Comparative interactomics with Funcoup 2.0. Nucleic Acids Res 2011;40:821–8. doi: 10.1093/nar/gkr1062. [DOI] [PMC free article] [PubMed] [Google Scholar]
- 14. Sevimoglu T, Arga KY. The role of protein interaction networks in systems biomedicine. Comput Struct Biotechnol J 2014;11:22–7. doi: 10.1016/j.csbj.2014.08.008. [DOI] [PMC free article] [PubMed] [Google Scholar]
- 15. Bader GD. Pathguide: a pathway resource list. Nucleic Acids Res 2006;34:D504–6. doi: 10.1093/nar/gkj126. [DOI] [PMC free article] [PubMed] [Google Scholar]
- 16. Huang S, Chaudhary K, Garmire LX. More is better: recent progress in multi-omics data integration methods. 2017;8:84. doi: 10.3389/fgene.2017.00084. [DOI] [PMC free article] [PubMed] [Google Scholar]
- 17. Gligorijević V, Przulj N. Methods for biological data integration: perspectives and challenges. J R Society Interface 2015; 12:20150571. doi: 10.1098/rsif.2015.0571. [DOI] [PMC free article] [PubMed] [Google Scholar]
- 18. Esteller M. Non-coding RNAs in human disease. Nat Rev Genet 2011;12:861–74. doi: 10.1038/nrg3074. [DOI] [PubMed] [Google Scholar]
- 19. Marcotte EM, Xenarios I, Eisenberg D. Mining literature for protein–protein interactions. Bioinformatics 2001;17:359–63. doi: 10.1093/bioinformatics/17.4.359. [DOI] [PubMed] [Google Scholar]
- 20. Pellegrini M, Marcotte EM, Thompson MJ, et al. Assigning protein functions by comparative genome analysis: protein phylogenetic profiles. Biochemistry 1999;96:4285–8. doi: 10.1073/pnas.96.8.4285. [DOI] [PMC free article] [PubMed] [Google Scholar]
- 21. Sato T, Yamanishi Y, Kanehisa M, et al. The inference of protein–protein interactions by co-evolutionary analysis is improved by excluding the information about the phylogenetic relationships. Bioinformatics 2005;21:3482–9. doi: 10.1093/bioinformatics/bti564. [DOI] [PubMed] [Google Scholar]
- 22. Schmitt T, Ogris C, Sonnhammer ELL. FunCoup 3.0: database of genome-wide functional coupling networks. Nucleic Acids Res 2014;42:D380–8. doi: 10.1093/nar/gkt984. [DOI] [PMC free article] [PubMed] [Google Scholar]
- 23. Sonnhammer ELL, Östlund G. InParanoid 8: orthology analysis between 273 proteomes, mostly eukaryotic. Nucleic Acids Res 2015;43:D234–9. doi: 10.1093/nar/gku1203. [DOI] [PMC free article] [PubMed] [Google Scholar]
- 24. Guala D. Functional association networks for disease gene prediction. PhD diss., Stockholm University, 2017. http://urn.kb.se/resolve?urn=urn:nbn:se:su:diva-147217. [Google Scholar]
- 25. Grigoriev A. A relationship between gene expression and protein interactions on the proteome scale: analysis of the bacteriophage T7 and the yeast Saccharomyces cerevisiae. Nucleic Acids Res 2001;29:3513–9. doi: 10.1093/nar/29.17.3513. [DOI] [PMC free article] [PubMed] [Google Scholar]
- 26. Ge H, Liu Z, Church GM, et al. Correlation between transcriptome and interactome mapping data from Saccharomyces cerevisiae. Nat Genet 2001;29:482–6. doi: 10.1038/ng776. [DOI] [PubMed] [Google Scholar]
- 27. Lee I, Ambaru B, Thakkar P, et al. Rational association of genes with traits using a genome-scale gene network for Arabidopsis thaliana. Nat Biotechnol 2010;28:149–56. doi: 10.1038/nbt.1603. [DOI] [PMC free article] [PubMed] [Google Scholar]
- 28. Barrett T, Wilhite SE, Ledoux P, et al. NCBI GEO: archive for functional genomics data sets—update. Nucleic Acids Res 2013;41:D991–5. doi: 10.1093/nar/gks1193. [DOI] [PMC free article] [PubMed] [Google Scholar]
- 29. Kolesnikov N, Hastings E, Keays M, et al. ArrayExpress update-simplifying data submissions. Nucleic Acids Res 2015;43:D1113–6. doi: 10.1093/nar/gku1057. [DOI] [PMC free article] [PubMed] [Google Scholar]
- 30. Hong S, Chen X, Jin L, et al. Canonical correlation analysis for RNA-seq co-expression networks. Nucleic Acids Res 2013;41:e95. doi: 10.1093/nar/gkt145. [DOI] [PMC free article] [PubMed] [Google Scholar]
- 31. Conesa A, Madrigal P, Tarazona S, et al. A survey of best practices for RNA-seq data analysis. Genome Biol 2016;17:13. doi: 10.1186/s13059-016-0881-8. [DOI] [PMC free article] [PubMed] [Google Scholar]
- 32. Morin RD, Bainbridge M, Fejes A, et al. Profiling the HeLa S3 transcriptome using randomly primed cDNA and massively parallel short-read sequencing. Biotechniques 2008;45:81–94. doi: 10.2144/000112900. [DOI] [PubMed] [Google Scholar]
- 33. Zhao S, Fung-Leung WP, Bittner A, et al. Comparison of RNA-Seq and microarray in transcriptome profiling of activated T cells. PLoS One 2014;9:e78644. doi: 10.1371/journal.pone.0078644. [DOI] [PMC free article] [PubMed] [Google Scholar]
- 34. Katagiri F, Glazebrook J. Overview of mRNA expression profiling using DNA microarrays. Curr Protoc Mol Biol 2009;85(1):22.4.1–22.4.13. doi: 10.1002/0471142727.mb2204s85. [DOI] [PubMed] [Google Scholar]
- 35. Deutsch EW, Lam H, Aebersold R. PeptideAtlas: a resource for target selection for emerging targeted proteomics workflows. EMBO Rep 2008;9:429–34. doi: 10.1038/embor.2008.56. [DOI] [PMC free article] [PubMed] [Google Scholar]
- 36. Uhlén M, Björling E, Agaton C, et al. A human protein atlas for normal and cancer tissues based on antibody proteomics. Mol Cell Proteomics 2005;4:1920–32. doi: 10.1074/mcp.M500279-MCP200. [DOI] [PubMed] [Google Scholar]
- 37. Vizcaíno JA, Csordas A, Del-Toro N, et al. 2016 update of the pride database and its related tools. Nucleic Acids Res 2015;44:D447–56. [DOI] [PMC free article] [PubMed] [Google Scholar]
- 38. Uhlen M, Fagerberg L, Hallstrom BM, et al. Tissue-based map of the human proteome. Science 2015;347:1260419–9. doi: 10.1126/science.1260419. [DOI] [PubMed] [Google Scholar]
- 39. Wang M, Herrmann CJ, Simonovic M, et al. Version 4.0 of PaxDb: protein abundance data, integrated across model organisms, tissues, and cell-lines. Proteomics 2015;15:3163–8. doi: 10.1002/pmic.201400441. [DOI] [PMC free article] [PubMed] [Google Scholar]
- 40. Huh W-K, Falvo JV, Gerke LC, et al. Global analysis of protein localization in budding yeast. Nature 2003;425:686–91. doi: 10.1038/nature02026. [DOI] [PubMed] [Google Scholar]
- 41. Orfanoudaki G, Economou A. Proteome-wide subcellular topologies of E. coli polypeptides database (STEPdb). Mol Cell Proteomics 2014;13:3674–87. doi: 10.1074/mcp.O114.041137. [DOI] [PMC free article] [PubMed] [Google Scholar]
- 42. Negi S, Pandey S, Srinivasan SM, et al. LocSigDB: a database of protein localization signals. Database (Oxford) 2015;2015:bav003. doi: 10.1093/database/bav003. [DOI] [PMC free article] [PubMed] [Google Scholar]
- 43. Rastogi S, Rost B. LocDB: experimental annotations of localization for homo sapiens and arabidopsis thaliana. Nucleic Acids Res 2011;39:D230–4. doi: 10.1093/nar/gkq927. [DOI] [PMC free article] [PubMed] [Google Scholar]
- 44. Alexeyenko A, Sonnhammer ELL. Global networks of functional coupling in eukaryotes from comprehensive data integration. Genome Res 2009;19:1107–16. doi: 10.1101/gr.087528.108. [DOI] [PMC free article] [PubMed] [Google Scholar]
- 45. Brown JB, Celniker SE. Lessons from modENCODE. Annu Rev Genomics Hum Genet 2015;16:31–53. doi: 10.1146/annurev-genom-090413-025448. [DOI] [PubMed] [Google Scholar]
- 46. Abdulrehman D, Monteiro PT, Teixeira MC, et al. YEASTRACT: providing a programmatic access to curated transcriptional regulatory associations in Saccharomyces cerevisiae through a web services interface. Nucleic Acids Res 2011;39:D136–40. doi: 10.1093/nar/gkq964. [DOI] [PMC free article] [PubMed] [Google Scholar]
- 47. Myers RM, Stamatoyannopoulos J, Snyder M, et al. A user’s guide to the Encyclopedia of DNA elements (ENCODE). PLoS Biol 2011; 9:e1001046. doi: 10.1371/journal.pbio.1001046. [DOI] [PMC free article] [PubMed] [Google Scholar]
- 48. Bartel DP. MicroRNAs: target recognition and regulatory functions. Cell 2009;136:215–33. doi: 10.1016/j.cell.2009.01.002. [DOI] [PMC free article] [PubMed] [Google Scholar]
- 49. Betel D, Wilson M, Gabow A, et al. The microRNA.org resource: targets and expression. Nucleic Acids Res 2008;36:D149–53. doi: 10.1093/nar/gkm995. [DOI] [PMC free article] [PubMed] [Google Scholar]
- 50. Mrowka R, Patzak A, Herzel H. Is there a bias in proteome research? Genome Res 2001; 11:1971–3. doi: 10.1101/gr.206701. [DOI] [PubMed] [Google Scholar]
- 51. Björkholm P, Sonnhammer EL. Comparative analysis and unification of domain–domain interaction networks. Bioinformatics 2009;25:3020–5. [DOI] [PubMed] [Google Scholar]
- 52. Finn RD, Attwood TK, Babbitt PC, et al. InterPro in 2017—beyond protein family and domain annotations. Nucleic Acids Res 2017;45:D190–9. doi: 10.1093/nar/gkw1107. [DOI] [PMC free article] [PubMed] [Google Scholar]
- 53. Punta M, Coggill P, Eberhardt R, et al. The Pfam protein families databases. Nucleic Acids Res 2012;30:1–12. doi: 10.1093/nar/gkp985. [DOI] [Google Scholar]
- 54. Rhodes DR, Tomlins SA, Varambally S, et al. Probabilistic model of the human protein–protein interaction network. Nat Biotechnol 2005;23:951–9. doi: 10.1038/nbt1103. [DOI] [PubMed] [Google Scholar]
- 55. Cover TM, Thomas JA. Elements of Information Theory. New York, NY: Wiley-Interscience, 2005, ISBN 0-471-06259-6. [Google Scholar]
- 56. Mani R, Onge RPS, Hartman JL, et al. Defining genetic interaction. Proc Natl Acad Sci U S A 2008;105:3461–6. [DOI] [PMC free article] [PubMed] [Google Scholar]
- 57. Costanzo M, Baryshnikova A, Bellay J, et al. The genetic landscape of a cell. Science 2010;327:425–31. [DOI] [PMC free article] [PubMed] [Google Scholar]
- 58. Costanzo M, VanderSluis B, Koch EN, et al. A global genetic interaction network maps a wiring diagram of cellular function. Science 2016;353:1381–96. doi: 10.1126/science.aaf1420. [DOI] [PMC free article] [PubMed] [Google Scholar]
- 59. Tong AHY. Systematic genetic analysis with ordered arrays of yeast deletion mutants. Science 2001;294:2364–8. doi: 10.1126/science.1065810. [DOI] [PubMed] [Google Scholar]
- 60. Boone C, Bussey H, Andrews BJ. Exploring genetic interactions and networks with yeast. Nat Rev Genet 2007;8:437–49. doi: 10.1038/nrg2085. [DOI] [PubMed] [Google Scholar]
- 61. Enright AJ, Iliopoulos I, Kyrpides NC, et al. Protein interaction maps for complete genomes based on gene fusion events. Nature 1999;402:86–90. doi: 10.1038/47056. [DOI] [PubMed] [Google Scholar]
- 62. Marcotte EM. Detecting protein function and protein–protein interactions from genome sequences. Science 1999;285:751–3. doi: 10.1126/science.285.5428.751. [DOI] [PubMed] [Google Scholar]
- 63. Dandekar T, Snel B, Huynen M, et al. Conservation of gene order: a fingerprint of proteins that physically interact. Trends Biochem Sci 1998;23:324–8. [DOI] [PubMed] [Google Scholar]
- 64. Ghanbarian AT, Hurst LD. Neighboring genes show correlated evolution in gene expression. Mol Biol Evol 2015;32:1748–66. doi: 10.1093/molbev/msv053. [DOI] [PMC free article] [PubMed] [Google Scholar]
- 65. Gavin A-C, Bösche M, Krause R, et al. Functional organization of the yeast proteome by systematic analysis of protein complexes. Nature 2002;415:141–7. doi: 10.1038/415141a. [DOI] [PubMed] [Google Scholar]
- 66. Alfarano C, Andrade CE, Anthony K, et al. The biomolecular interaction network database and related tools 2005 update. Nucleic Acids Res 2005;33:D418–24. doi: 10.1093/nar/gki051. [DOI] [PMC free article] [PubMed] [Google Scholar]
- 67. Salwinski L, Miller CS, Smith AJ, et al. The database of interacting proteins: 2004 update. Nucleic Acids Res 2004;32:D449–51. doi: 10.1093/nar/gkh086. [DOI] [PMC free article] [PubMed] [Google Scholar]
- 68. Razick S, Magklaras G, Donaldson IM. iRefIndex: a consolidated protein interaction database with provenance. BMC Bioinformatics 2008;9:405. doi: 10.1186/1471-2105-9-405. [DOI] [PMC free article] [PubMed] [Google Scholar]
- 69. von Mering C, Krause R, Snel B, et al. Comparative assessment of large-scale data sets of protein–protein interactions. Nature 2002;417:399–403. doi: 10.1038/nature750. [DOI] [PubMed] [Google Scholar]
- 70. Szklarczyk D, Morris JH, Cook H, et al. The STRING database in 2017: quality-controlled protein–protein association networks, made broadly accessible. Nucleic Acids Res 2017; 45:D362–8. doi: 10.1093/nar/gkw937. [DOI] [PMC free article] [PubMed] [Google Scholar]
- 71. Schwikowski B, Uetz P, Fields S. A network of protein–protein interactions in yeast. Nat Biotechnol 2000;18:1257–61. doi: 10.1038/82360. [DOI] [PubMed] [Google Scholar]
- 72. Giot L, Bader JS, Brouwer C, et al. A protein interaction map of Drosophila melanogaster. Science 2003;302:1727–36. doi: 10.1126/science.1090289. [DOI] [PubMed] [Google Scholar]
- 73. Huang H, Jedynak BM, Bader JS. Where have all the interactions gone? Estimating the coverage of two-hybrid protein interaction maps. PLoS Comput Biol 2007;3:2155–74. doi: 10.1371/journal.pcbi.0030214. [DOI] [PMC free article] [PubMed] [Google Scholar]
- 74. Snider J, Kotlyar M, Saraon P, et al. Fundamentals of protein interaction network mapping. Mol Syst Biol 2015;11:848. doi: 10.15252/msb.20156351. [DOI] [PMC free article] [PubMed] [Google Scholar]
- 75. Krogan NJ, Cagney G, Yu H, et al. Global landscape of protein complexes in the yeast Saccharomyces cerevisiae. Nature 2006;440:637–43. doi: 10.1038/nature04670. [DOI] [PubMed] [Google Scholar]
- 76. Matthews LR, Vaglio P, Reboul J, et al. Identification of potential interaction networks using sequence-based searches for conserved protein–protein interactions or “interologs”. Genome Res 2001;11:2120–6. doi: 10.1101/gr.205301. [DOI] [PMC free article] [PubMed] [Google Scholar]
- 77. Powell S, Forslund K, Szklarczyk D, et al. EggNOG v4.0: nested orthology inference across 3686 organisms. Nucleic Acids Res 2014;42:D231–9. doi: 10.1093/nar/gkt1253. [DOI] [PMC free article] [PubMed] [Google Scholar]
- 78. Acland A, Agarwala R, Barrett T, et al. Database resources of the National Center for biotechnology information. Nucleic Acids Res 2014;42:D7–D17. doi: 10.1093/nar/gkt1146. [DOI] [PMC free article] [PubMed] [Google Scholar]
- 79. McCarroll SA, Altshuler DM. Copy-number variation and association studies of human disease. Nat Genet 2007;39:S37–42. doi: 10.1038/ng2080. [DOI] [PubMed] [Google Scholar]
- 80. Nachman MW. Single nucleotide polymorphisms and recombination rate in humans. Trends Genet 2001;17:481–5. doi: 10.1016/S0168-9525(01)02409-X. [DOI] [PubMed] [Google Scholar]
- 81. Larsson P, Svensson K, Karlsson L, et al. Canonical insertion–deletion markers for rapid DNA typing of Francisella tularensis. Emerg Infect Dis 2007;13:1725–32. doi: 10.3201/eid1311.070603. [DOI] [PMC free article] [PubMed] [Google Scholar]
- 82. Dupont C, Armant DR, Brenner CA. Epigenetics: definition, mechanisms and clinical perspective. Semin Reprod Med 2009;27:351–7. doi: 10.1055/s-0029-1237423. [DOI] [PMC free article] [PubMed] [Google Scholar]
- 83. Thingholm L, Andersen L, Makalic E, et al. Strategies for integrated analysis of genetic, epigenetic, and gene expression variation in cancer: addressing the challenges. Front Genet 2016;7:2. doi: 10.3389/fgene.2016.00002. [DOI] [PMC free article] [PubMed] [Google Scholar]
- 84. Buescher JM, Driggers EM. Integration of omics: more than the sum of its parts. Cancer Metab 2016;4:4. doi: 10.1186/s40170-016-0143-y. [DOI] [PMC free article] [PubMed] [Google Scholar]
- 85. Lees J, Heriche J, Morilla I, et al. Systematic computational prediction of protein interaction networks. Phys Biol 2011; 8:035008. [DOI] [PubMed] [Google Scholar]
- 86. Gerstein M, Lan N, Jansen R. Integrating interactomes. Science 2002;295:284–7. [DOI] [PubMed] [Google Scholar]
- 87. Von Mering C, Krause R, Snel B, et al. Comparative assessment of large-scale data sets of protein–protein interactions. Nature 2002;417:399–403. [DOI] [PubMed] [Google Scholar]
- 88. Pavlidis P, Weston J, Cai J, et al. Learning gene functional classifications from multiple data types. J Comput Biol 2002; 9:401–11. doi: 10.1089/10665270252935539. [DOI] [PubMed] [Google Scholar]
- 89. Marcotte EM, Pellegrini M, Thompson MJ, et al. A combined algorithm for genome-wide prediction of protein function. Nature 1999;402:83–6. doi: 10.1038/47048. [DOI] [PubMed] [Google Scholar]
- 90. Szklarczyk D, Franceschini A, Wyder S, et al. String v10: protein–protein interaction networks, integrated over the tree of life. Nucleic Acids Res 2015;43(D1):D447–52. [DOI] [PMC free article] [PubMed] [Google Scholar]
- 91. Elefsinioti A, Sarac ÖS, Hegele A, et al. Large-scale de novo prediction of physical protein–protein association. Mol Cell Proteomics 2011;10:M111–010629. [DOI] [PMC free article] [PubMed] [Google Scholar]
- 92. Lin M, Hu B, Chen L, et al. Computational identification of potential molecular interactions in arabidopsis. Plant Physiol 2009;151:34–46. [DOI] [PMC free article] [PubMed] [Google Scholar]
- 93. Tsuda K, Shin H, Schölkopf B. Fast protein classification with multiple networks. Bioinformatics 2005;21(Suppl 2):ii59–65. doi: 10.1093/bioinformatics/bti1110. [DOI] [PubMed] [Google Scholar]
- 94. Myers CL, Troyanskaya OG. Context-sensitive data integration and prediction of biological networks. Bioinformatics 2007;23:2322–30. doi: 10.1093/bioinformatics/btm332. [DOI] [PubMed] [Google Scholar]
- 95. Lee I, Lehner B, Crombie C, et al. A single gene network accurately predicts phenotypic effects of gene perturbation in caenorhabditis elegans. Nat Genet 2008;40:181–8. [DOI] [PubMed] [Google Scholar]
- 96. Alexeyenko A, Sonnhammer EL. Global networks of functional coupling in eukaryotes from comprehensive data integration. Genome Res 2009;19:1107–16. [DOI] [PMC free article] [PubMed] [Google Scholar]
- 97. Franz M, Rodriguez H, Lopes C, et al. GeneMANIA update 2018. Nucleic Acids Res 2018;46:1–5. doi: 10.1093/nar/gky311. [DOI] [PMC free article] [PubMed] [Google Scholar]
- 98. Lee I, Blom UM, Wang PI, et al. Prioritizing candidate disease genes by network-based boosting of genome-wide association data. Genome Res 2011;21:1109–21. doi: 10.1101/gr.118992.110. [DOI] [PMC free article] [PubMed] [Google Scholar]
- 99. Wong AK, Krishnan A, Yao V, et al. IMP 2.0: a multi-species functional genomics portal for integration, visualization and prediction of protein functions and networks. Nucleic Acids Res 2015;43:W128–33. doi: 10.1093/nar/gkv486. [DOI] [PMC free article] [PubMed] [Google Scholar]
- 100. Park CY, Wong AK, Greene CS, et al. Functional knowledge transfer for high-accuracy prediction of under-studied biological processes. PLoS Comput Biol 2013;9:e1002957. doi: 10.1371/journal.pcbi.1002957. [DOI] [PMC free article] [PubMed] [Google Scholar]
- 101. Ogris C, Guala D, Kaduk M, et al. FunCoup 4: new species, data, and visualization. Nucleic Acids Res 2017;46:D601–7. doi: 10.1093/nar/gkx1138. [DOI] [PMC free article] [PubMed] [Google Scholar]
- 102. Chatr-Aryamontri A, Oughtred R, Boucher L, et al. The BioGRID interaction database: 2017 update. Nucleic Acids Res 2017;45:D369–79. doi: 10.1093/nar/gkw1102. [DOI] [PMC free article] [PubMed] [Google Scholar]
- 103. Pertea M, Ayanbule K, Smedinghoff M, et al. OperonDB: a comprehensive database of predicted operons in microbial genomes. Nucleic Acids Res 2009;37:D479–82. doi: 10.1093/nar/gkn784. [DOI] [PMC free article] [PubMed] [Google Scholar]
- 104. Blohm P, Frishman G, Smialowski P, et al. Negatome 2.0: a database of non-interacting proteins derived by literature mining, manual annotation and protein structure analysis. Nucleic Acids Res 2013;42:D396–400. [DOI] [PMC free article] [PubMed] [Google Scholar]
- 105. Ashburner M, Ball CA, Blake JA, et al. Gene ontology: tool for the unification of biology. The gene ontology consortium. Nat Genet 2000;25:25–9. doi: 10.1038/75556. [DOI] [PMC free article] [PubMed] [Google Scholar]
- 106. Kanehisa M, Furumichi M, Tanabe M, et al. KEGG: new perspectives on genomes, pathways, diseases and drugs. Nucleic Acids Res 2017;45:D353–61. doi: 10.1093/nar/gkw1092. [DOI] [PMC free article] [PubMed] [Google Scholar]
- 107. Cerami EG, Gross BE, Demir E, et al. Pathway commons, a web resource for biological pathway data. Nucleic Acids Res 2011;39:D685–90. doi: 10.1093/nar/gkq1039. [DOI] [PMC free article] [PubMed] [Google Scholar]
- 108. Fabregat A, Jupe S, Matthews L, et al. The Reactome pathway knowledgebase. Nucleic Acids Res 2018;46:D649–55. doi: 10.1093/nar/gkx1132. [DOI] [PMC free article] [PubMed] [Google Scholar]
- 109. Kutmon M, Riutta A, Nunes N, et al. WikiPathways: capturing the full diversity of pathway knowledge. Nucleic Acids Res 2016; 44:D488–94. doi: 10.1093/nar/gkv1024. [DOI] [PMC free article] [PubMed] [Google Scholar]
- 110. Kamburov A, Grossmann A, Herwig R, et al. Cluster-based assessment of protein–protein interaction confidence. BMC Bioinformatics 2012;13:262. doi: 10.1186/1471-2105-13-262. [DOI] [PMC free article] [PubMed] [Google Scholar]
- 111. Yu J, Murali T, Finley RL. Assigning confidence scores to protein–protein interactions. Methods Mol Biol 2012;812:161–74. doi: 10.1007/978-1-61779-455-1_9. [DOI] [PubMed] [Google Scholar]
- 112. Lee DD, Seung HS. Learning the parts of objects by non-negative matrix factorization. Nature 1999;401:788–91. doi: 10.1038/44565. [DOI] [PubMed] [Google Scholar]
- 113. Wang H, Huang H, Ding C, et al. Predicting protein–protein interactions from multimodal biological data sources via nonnegative matrix tri-factorization. J Comput Biol 2013;20:344–58. doi: 10.1089/cmb.2012.0273. [DOI] [PubMed] [Google Scholar]
- 114. Kakushadze Z, Yu W. Factor models for cancer signatures. Physica A: Statistical Mechanics and its Applications 2016;462:527–59. [Google Scholar]
- 115. žitnik M, Nam EA, Dinh C, et al. Gene prioritization by compressive data fusion and chaining. PLoS Comput Biol 2015;11:e1004552. doi: 10.1371/journal.pcbi.1004552. [DOI] [PMC free article] [PubMed] [Google Scholar]
- 116. Eoh K, Kim H, Lee J-Y, et al. Upregulation of homeobox gene is correlated with poor survival outcomes in cervical cancer. Oncotarget 2017;8:84396–402. doi: 10.18632/oncotarget.21041. [DOI] [PMC free article] [PubMed] [Google Scholar]
- 117. Weng TY, Tsai SYA, Su TP. Roles of sigma-1 receptors on mitochondrial functions relevant to neurodegenerative diseases. J Biomed Sci 2017;24:74. doi: 10.1186/s12929-017-0380-6. [DOI] [PMC free article] [PubMed] [Google Scholar]
- 118. Hastie T, Tibshirani R, Friedman J. The Elements of Statistical Learning Elements. 233 Spring Street, New York, NY 10013, USA: Springer Science+Business Media, LLC. Vol. 1, 2009, 337–87. doi: 10.1007/b94608. [DOI]
- 119. Montojo J, Zuberi K, Rodriguez H, et al. Genemania cytoscape plugin: fast gene function predictions on the desktop. Bioinformatics 2010;26:2927–8. [DOI] [PMC free article] [PubMed] [Google Scholar]
- 120. Emilsson V, Ilkov M, Lamb JR, et al. Co-regulatory networks of human serum proteins link genetics to disease. Science 2018;361:769–73. [DOI] [PMC free article] [PubMed] [Google Scholar]
- 121. Himmels P, Paredes I, Adler H, et al. Motor neurons control blood vessel patterning in the developing spinal cord. Nat Commun 2017;8:14583. [DOI] [PMC free article] [PubMed] [Google Scholar]
- 122. Singh TP, Vieyra-Garcia PA, Wagner K, et al. Cbl-b deficiency provides protection against uvb-induced skin damage by modulating inflammatory gene signature. Cell Death Dis 2018;9:835. [DOI] [PMC free article] [PubMed] [Google Scholar]
- 123. Greene CS, Krishnan A, Wong AK, et al. Understanding multicellular function and disease with human tissue-specific networks. Nat Genet 2015;47:569–76. doi: 10.1038/ng.3259. [DOI] [PMC free article] [PubMed] [Google Scholar]
- 124. Gremse M, Chang A, Schomburg I, et al. The BRENDA tissue ontology (BTO): the first all-integrating ontology of all organisms for enzyme sources. Nucleic Acids Res 2011;39:D507–13. doi: 10.1093/nar/gkq968. [DOI] [PMC free article] [PubMed] [Google Scholar]
- 125. Musumeci G, Castrogiovanni P, Barbagallo I, et al. Expression of the OAS gene family is highly modulated in subjects affected by juvenile dermatomyositis, resembling an immune response to a dsRNA virus infection. Int J Mol Sci 2018;19:2786. doi: 10.3390/ijms19092786. [DOI] [PMC free article] [PubMed] [Google Scholar]
- 126. Yu L, Zhao J, Gao L. Predicting potential drugs for breast cancer based on miRNA and tissue specificity. Int J Biol Sci 2018;14:971–80. doi: 10.7150/ijbs.23350. [DOI] [PMC free article] [PubMed] [Google Scholar]
- 127. Hou Y, Gao B, Li G, et al. MaxMIF: a new method for identifying cancer driver genes through effective data integration. Adv Sci 2018;5:1800640. doi: 10.1002/advs.201800640. [DOI] [PMC free article] [PubMed] [Google Scholar]
- 128. Gómez-Vela F, Rodriguez-Baena DS, Vázquez-Noguera JL. Structure optimization for large gene networks based on greedy strategy. Comput Math Methods Med 2018;2018:1–11. doi: 10.1155/2018/9674108. [DOI] [PMC free article] [PubMed] [Google Scholar]
- 129. Kotlyar M, Pastrello C, Sheahan N, et al. Integrated interactions database: tissue-specific view of the human and model organism interactomes. Nucleic Acids Res 2016; 44:D536–41. [DOI] [PMC free article] [PubMed] [Google Scholar]
- 130. Uhlén M, Fagerberg L, Hallström BM, et al. Tissue-based map of the human proteome. Science 2015;347:1260419. [DOI] [PubMed] [Google Scholar]
- 131. Wong AK, Park CY, Greene CS, et al. IMP: a multi-species functional genomics portal for integration, visualization and prediction of protein functions and networks. Nucleic Acids Res 2012;40:W484–90. [DOI] [PMC free article] [PubMed] [Google Scholar]
- 132. Guan Y, Myers CL, Lu R, et al. A genomewide functional network for the laboratory mouse. PLoS Comput Biol 2008;4:e1000165. doi: 10.1371/journal.pcbi.1000165. [DOI] [PMC free article] [PubMed] [Google Scholar]
- 133. Harmston N, Filsell W, Stumpf MPH. What the papers say: text mining for genomics and systems biology. Hum Genomics 2010;5:17–29. doi: 10.1186/1479-7364-5-1-17. [DOI] [PMC free article] [PubMed] [Google Scholar]
- 134. Hu JX, Thomas CE, Brunak S. Network biology concepts in complex disease comorbidities. Nat Rev Genet 2016;17:615–29. doi: 10.1038/nrg.2016.87. [DOI] [PubMed] [Google Scholar]
- 135. Chen YC, Urban PL. Time-resolved mass spectrometry. Trends Anal Chem 2013;44:106–20. doi: 10.1016/j.trac.2012.11.010. [DOI] [Google Scholar]
- 136. Kirk P, Griffin JE, Savage RS, et al. Bayesian correlated clustering to integrate multiple datasets. Bioinformatics 2012;28:3290–7. doi: 10.1093/bioinformatics/bts595. [DOI] [PMC free article] [PubMed] [Google Scholar]
- 137. Chen JY, Pandey R, Nguyen TM. HAPPI-2: a comprehensive and high-quality map of human annotated and predicted protein interactions. BMC Genomics 2017;18:182. doi: 10.1186/s12864-017-3512-1. [DOI] [PMC free article] [PubMed] [Google Scholar]