

Abstract
Transfer of care between multiple units or facilities is of significant importance for patient safety, care quality, and operation efficiency. Such transfers are often referred to as handoffs in hospitals, which need to be carried out timely, safely, and smoothly with accurate information. This paper introduces a Markov chain model to study the transients of handoff process in hospital emergency departments. The handoff process is modeled by a stochastic process with unavailability of service, which characterizes the constraints in bed capacity, staff shortage, and coordination issues, etc. For systems only allowing one transfer request waiting, the transient performance is obtained through Laplace transform and its inverse transform. Such a result is then used as a building block to study the systems allowing multiple requests waiting through an iteration process, which can reduce the computation complexity substantially. Numerical studies show that such a method can provide estimates of transient performance in the handoff process with acceptable accuracy.
Index Terms—: Emergency department, handoff process, transient analysis, Markov chain, waiting time
1. INTRODUCTION
TRANSITIONS of care between multiple units within a hospital play a significant role in ensuring patient safety, care quality, and operation efficiency. Within a hospital, patients may need to be transferred from one unit to another, such as from emergency department (ED) to intensive care unit (ICU) or inpatient ward (also referred to as hospital floor). Such transfers are often referred to as handoffs. The handoff process needs to move the responsibility for a patient’s care from one care provider team to another timely, safely, and smoothly, and to convey accurate information regarding the patient and his/her treatment, including the patient’s current condition and any recent or anticipated changes. Substantial research and implementation efforts have been devoted to studying and improving the handoff processes in hospitals [1].
Particularly, the handoff process in a hospital ED has received more attention because of its acute care setting and possible vulnerable events. Due to overwhelming crowding in the ED, capacity constraints in other units, staff shortage, communication and coordination issues, etc., delays in handoff processes are not uncommon, which may cause delayed treatment, increased mortality, poor patient outcomes, and other adverse events. For example, up to 25% of ED patients who are admitted to the medical units may experience more than four hours boarding time (waiting to be transferred) [2], which not only signifies crowding in the ED but may also lead to high risk of compromise in patient care.
Although patient transitions have been studied extensively, most of them are based on pilot studies or empirical data analysis. Only limited analytical work can be found, and all of them focus on planning or long-term analysis. However, patient transitions in hospitals are dynamic processes, which implies that the short-term or transient analysis is more critical. Although Markov chain and queueing models have been extensively used in studying healthcare deliveries (e.g., see reviews [3]–[5]), they typically focus on steady state analysis without addressing the transient behaviors. Therefore, there is a need to develop a transient analysis model to study patient transition process. To this end, in this paper, we develop a Markov chain model to study the transient behavior of handoff process in hospital EDs.
The remainder of the paper is structured as follows: The related literature is reviewed in Section II. Section III describes the handoff process and formulates the problem. Both Sections IV and V are devoted to performance analysis. Finally, conclusions and future work are summarized in Section VI.
II. Related literature
Numerous studies on ED handoffs have been carried out from the clinical perspectives [1]. These studies mostly focus on qualitative analysis, such as root causes of ineffective handoffs, miscommunication between transfer staffs, quality metric design for handoff performance. For example, paper [6] reports a cross-sectional survey in a 627-bed tertiary care academic medical center to assess physicians’ perceptions of ED admission handoff process to identify potential barriers for safe patient care. A pre- and post-test study using mixed-methods is described in [7] to evaluate the impact of a structured communication strategy on the quality of admission handoffs in a 560-bed academic health center. In addition, a two-year ethnographic study at a tertiary teaching and referral hospital is presented in [8] to examine the use of electronic health records (EHRs) from the perspective of receiving end clinicians in preparation for handoffs.
From the quantitative modeling perspective, both simulation and analytical models focus on congestion management and tend to measure steady state performance only (see, for instance, monographs [9]–[11]). Paper [12] provides a review of several key modeling methodologies presented in academic literature that attempt to analyze and forecast ED patient load and crowding. The methods include formula-based equations, regression modeling, time-series analysis, queueing theory–based models, and discrete-event (or process) simulation (DES) models. In paper [13], a DES model is developed to study the hospital bed management function at a mid-size hospital. Through reproducing the emergency and elective patient flows and multi-objective optimization, the model can help decision makers to select optimal solutions and quantify trade-offs among alternative conflicting objectives. Paper [14] also introduces a simulation model to study four strategies in solving ward capacity management problem, including an exact mixed integer programming approach, and three heuristic policies based on longest or shortest expected processing time, or random choice. However, only limited analytical studies can be found addressing patient transitions within hospitals. For instance, queueing models are used in [15] and [16] to analyze patient flow between units within obstetrics hospitals. Delays on transfers from ICU to general medical units are investigated through multivariate regression models in [17]. Papers [18] and [19] present efficient algorithms using Markov chain and queueing models, respectively, to study patient transitions among multiple units in hospitals by considering blocking due to capacity constraints. All these studies focus on planning or long-term analysis.
There is considerable research on transient queueing models (e.g., [20]–[24]). Most of the models, such as M/M/1, M/M/c, Mb/M/1, and M/G/1, study the transient probabilities without considering server availability. Among limited work addressing systems with unavailable servers, a transient solution for an M/M/1 queueing system with catastrophes and server failures is obtained in [25] using continued fractions for the system size. Similarly, a single server queue with disastrous break-downs and impatient customers is studied in [26] to derive the time-dependent system size probabilities using generating functions and continued fractions. Paper [27] also investigates a single server queue with impatient customers and multiple vacations, and models customers’ impatience as an absentee of servers upon arrival. Moreover, Paper [28] analyzes an M/M/1 queue with heterogeneous arrival and departure, and with provision of server vacations and breakdowns. In spite of these studies, there is no prior work on transient analysis of handoff processes. The above models can not characterize the features in handoff process, where unavailability of service due to capacity and staff constraints can simultaneously exist with patient transfers.
In summary, developing a transient analysis model to analyze the dynamic behavior of handoff process is of significant importance. The goal of our work is to contribute to this end by developing a Markov chain based transient model.
III. System Description and Problem Formulation
A. Description of Handoff Process
Through observations in the ED and interviewing with ED nurses and physicians, the handoff process can be categorized into the following four steps:
Step 1: An ED physician will send a bed request to an inpatient unit.
Step 2: An ED nurse coordinator will contact the inpatient unit Care Team Leader (CTL, also referred to as Bed Manager [29]) to discuss about the patient and get bed assignment. The information of bed assignment will be updated on ED tracking board. In the meantime, the ED nurse will document SBAR (Situation Background Assessment Recommendation) for the patient, which includes the ED contact information and phone number. Then a text page would be sent to the inpatient unit CTL to notify them that SBAR is ready for review. However, these two SBAR related activities will not delay bed assignment.
Step 3: After bed assignment, the inpatient unit nurse will need to review the ED SBAR within 15 minutes of receiving the text page. In some cases, additional communications between ED and inpatient unit may be needed.
Step 4: ED starts transferring the patient to the receiving unit.
Summarizing these steps, the ED handoff process is illustrated in Figure 1.
Fig. 1.

Steps in handoff process
B. Assumptions and Problem Formulation
The handoff process is a complex one involving capacity, coordination, and staffing issues in both ED and receiving units. Direct analysis for transient performance of such a process is difficult. Thus, in this paper, we focus on waiting times during the handoff process by simplifying the process into a waiting and service process, and using a Markov chain model to evaluate the performance. In future work, we plan to relax the limitation to address more detailed processes and interactions between units. Specifically, in this paper, Steps 2, 3, and 4 of handoff coordination and patient transfer processes, are aggregated into a single “handoff” service, while Step 1, requesting for transfer, is represented by an arrival process followed by a possible queue to characterize waiting for bed assignment or coordination. As either the bed capacity may be limited or both ED and receiving unit nurses may be busy, delays could occur during Steps 2 and 3. Thus, the handoff service is subject to unavailability. Figure 2 illustrates such a simplified model, where parameters λ, μ, α, β, and N are defined in assumptions (i)-(v) below.
Fig. 2.

Simplified handoff process model
The following assumptions are introduced to define the handoff process model:
The patient transfer requests from the ED are defined by a Poisson process with rate λ.
The duration of handoff service process is characterized by an exponential distribution with service rate μ. The service may not be available with rate α due to bed capacity constraint or staff work assignment. When the service is unavailable, it can be resumed with rate β. Both available and unavailable times follow exponential distributions.
Only one patient can be transferred at a time. If there are more than one patient requesting for service, a first-come-fist-serve policy is adopted. The latter requests will be waiting in the queue.
During a handoff process, the patient transfer cannot be interrupted, but bed or staff can become unavailable to the next request.
Due to safety issues, the maximum number of patients waiting in the queue is limited by N, to ensure that the patients could be transferred as soon as possible. If additional patients need transfers when the queue is full, they will not enter the queue and will be transferred to other facilities.
Remark 1.
In assumptions (ii) and (iii), the unavailability of handoff service refers to bed capacity constraint in the receiving unit, staff shortage, or other issues that will cause delays for the waiting transfer requests rather than the current one. In other words, once the patient handoff process is started (e.g., Step 1 is finished and a bed is assigned), it will continue until finishing.
Remark 2.
The Markovian assumption (i.e., exponential service, inter-arrival, available, and unavailable times) is introduced to make the analysis tractable. In future work, such an assumption will be relaxed to consider general distributions.
Remark 3.
Assumption (iii) introduces a first-come-first-serve policy when multiple requests exist. Such a policy is considered to simplify the analysis. In practice, such a policy may be adopted if there is no significant difference in priority of transfer requests. Otherwise, a priority policy could be used. To model the system with a priority policy, the state space introduced in next section will be expanded to include the request priority, and the transition matrix of the Markov chain and performance analysis formula will be re-developed to represent such a rule. The solution approaches introduced in Sections IV and V are still applicable but with more complex derivations, which will be studied in future work.
The above assumptions define a stochastic process with finite capacity. Let W (t) be the waiting time for a handoff process at time t, i.e., the expected delay time if a patient transfer is requested at time t from the current status. Then, W (t) is a function of all system parameters, i.e.,
| (1) |
In this paper, we seek analytical characterization of W (t). Therefore, the problem to be addressed is:
Given handoff process (i)-(v), develop a method to study the transient performance, i.e., calculate W (t) as a function of system parameters, and investigate system properties.
To solve the problem, we first consider the scenario of queue capacity N =1 in Section IV. Then, using the derived results, we extend to cases of N > 1 in Section V.
IV. Performance Analysis of N = 1-Systems
A. System States and Transitions
To study the dynamic behavior of the handoff process formulated above, we define the system states as (n, x, y), where n, n = 0, 1,...,N, represents the number of patient transfer requests waiting in the queue, x indicates whether there is a transfer in progress or not, i.e., if there is a patient (x = 1) or no patient (x = 0) in transferring, and y denotes whether the bed capacity or staff for handoff service is available (y = 1) or unavailable (y = 0) to future patients. For example, when N = 1, i.e., at most one patient transfer request can be in waiting, there exist seven states: (0, 0, 0), (0, 0, 1), (0, 1, 0), (0, 1, 1), (1, 0, 0), (1, 1, 0), and (1, 1, 1). Note that (1, 0, 1) is not a feasible state since a transfer request will be immediately handled if the service is available and there is no other patient being transferred. When N becomes larger, the number of states increases linearly. The total number of states, K, can be calculated by
| (2) |
The transitions between states are characterized by the request, service, unavailable, and resume rates. Figure 3 presents the transition diagram for the process of N = 1, where the transition rates are marked next to the arcs.
Fig. 3.
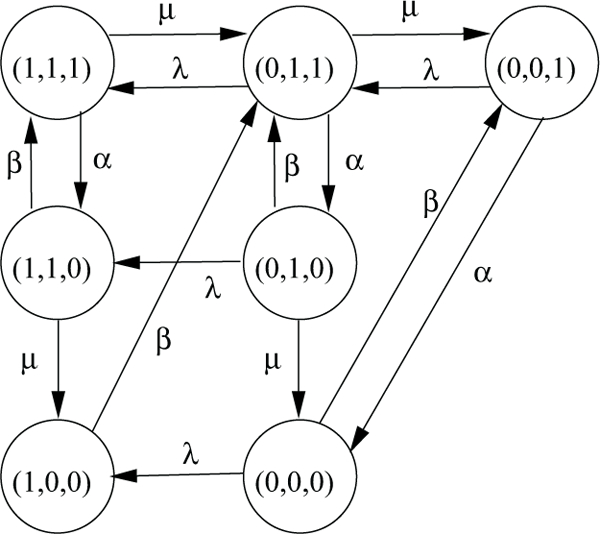
State transition diagram for systems with N =1
Remark 4.
The transition diagram in Figure 3 indicates that a patient transfer will be continued even if the service (e.g., bed capacity or staff) becomes unavailable for the next patient, i.e., there exists a transition from (n, 1, 1) to (n, 1, 0), n = 0, 1.
Let pnxy(t) represent the probability that the system is in state (n, x, y) at time t. Then, the balance equations characterizing the transitions at time t + h, where h is an infinitesimal time period, can be derived and are presented in (3) on next page. In addition, we have
| (4) |
These equations characterize the dynamic behavior of the system during transients. Solving these equations, we can obtain the transient performance as a function at time t.
B. Solution Approach
To evaluate system performance, the probabilities that the system is in each state at time t need to be calculated. However, such equations are difficult to solve directly. It is more convenient to transform the probabilities and equations from time domain to frequency domain using Laplace transform since it will be relatively easier to derive the necessary solutions in the frequency domain. After obtaining the solutions, the results can be transformed back to the time domain through inverse Laplace transform.
Specifically, let vector PN (t) denote all the state probabilities at time t, and QN represent the state transition matrix. When N = 1, the expression of P1 and Q1 can be obtained, which are shown in (5) on next page.
To derive the performance in frequency domain, introduce PN (s) as the Laplace transform of PN (t). Then, the transition equations can be represented as follows:
| (6) |
where, if we assume p001(0)= 1, we have
which represents the current or initial status at time t = 0.
However, even after Laplace transform, the solution procedure is complicated. Thus, Matlab Symbolic Math Toolbox is used to derive the solutions of pnxy(s), where n, x, y = 0, 1. Taking the inverse Laplace transform, pnxy(t) can be obtained. Since both pnxy(s) and pnxy(t) have very complex forms, we ignore their expression here. For illustration purpose, only p000(s) in (7) is presented on the subsequent page. Other pnxy(t), (nxy) ≠ (000), can be obtained analogously.
Remark 5.
To derive the inverse transform, closed form expressions are impossible to obtain, even with the Symbolic Math Toolbox. Thus, “MuPAD’s numeric::partfrac (numerical factorization and corresponding partial fraction expansion)” package in Matlab is used to calculate pnxy(t) numerically for given parameters λ, μ, α and β. This approach also ensures that all the inverses are real numbers.
C. Performance Evaluation
Using the obtained probabilities of the system in each state at time t (i.e., pnxy(t)’s), the transient performance of handoff process can be evaluated. When N = 1, the expected waiting time for a patient, whose transfer request is sent out by the ED physician at time t, can be approximated by:
| (8) |
where
| (9) |
Note that when N = 1, only when the queue is empty, a new request can wait in the queue. Thus W1 only includes states (0,1,1), (0,0,0), and (0,1,0). Particularly, for the latter two states, further waiting is possible if bed or staff is unavailable when the prior transfer is finished. In addition, since a transfer process will not be interrupted once it is started, the total handoff time only includes service time and possible waiting time W1(t), and the latter already includes the impacts from unavailability of bed capacity and staff. The conditions in ξ and γ represent whether there will be waiting or not due to this unavailability.
In summary, such an approach can be described as follows:
Procedure 1.
Waiting time calculation for N = 1.
Step 1: Set initial condition P1(0) = [0, 1, 0, 0, 0, 0, 0] by assuming p001(0) = 1. Derive transition matrix Q1 in equation (5).
Step 2: Solve P1(s) in equation (6) using Matlab Symbolic Math Toolbox.
Step 3: Take inverse Laplace transform of P1(s) to derive pnxy(t), n, x, y = 0, 1, using MuPAD’s numeric::partfrac package in Matlab.
Step 4: Calculate waiting time performance W1(t) in equation (8).
| (3) |
| (5) |
V. Performance Analysis of N > 1-Systems
A. Solution Approach
Although the approach presented in Section IV can be extended for N > 1 with larger state space, it will be infeasible since it may generate imaginary numbers in pnxy(t) solution, and also experience an increasing computation intensity, even with N = 2. To overcome this difficulty, an approximation method is introduced for systems with N > 1. The idea of the method is to use an N =1 case with its waiting as a building block, i.e., an aggregated server. Then an N = 2 system can be viewed as an aggregated server with a queue of capacity 1. Using Procedure 1, we can evaluate the performance of such a system. The same idea can be applied to N > 2 systems, i.e., consider the system with queue of capacity N as an aggregated server, then the system with queue capacity N + 1 can be viewed as the aggregated server with a queue of capacity 1, whose performance can be evaluated. Using such an iteration procedure, systems with larger N’s can be analyzed.
Specifically, define as the waiting time obtained by applying Procedure 1 for N = 1-system but with the following calculation formula:
| (10) |
where ξ and γ are defined in (9). Note that the second line in equation (10) characterizes the waiting time when queue size is 1 at time t, since the actual queue capacity is larger than 1.
Now, such a time is contributed to the aggregated service time of the system (i.e., the original N = 2-system). Assume the service time of the aggregated server still follows an exponential distribution with rate , i.e.,
Using this aggregated service time and still applying Procedure 1 for N = 1-system with equation (10), we obtain , which can be used to calculate for the original N = 3-system. Then the procedure is repeated. In each iteration, we analyze the aggregated system with queue capacity 1, and evaluate its waiting time and add it into service time, until the original system’s maximal queue capacity N is reached.
Note that in the last iteration, expression (8) will be used to calculate the waiting time when the queue capacity is reached. An illustration of this aggregation-based iteration method for N =3 is shown in Figure 4.
Fig. 4.
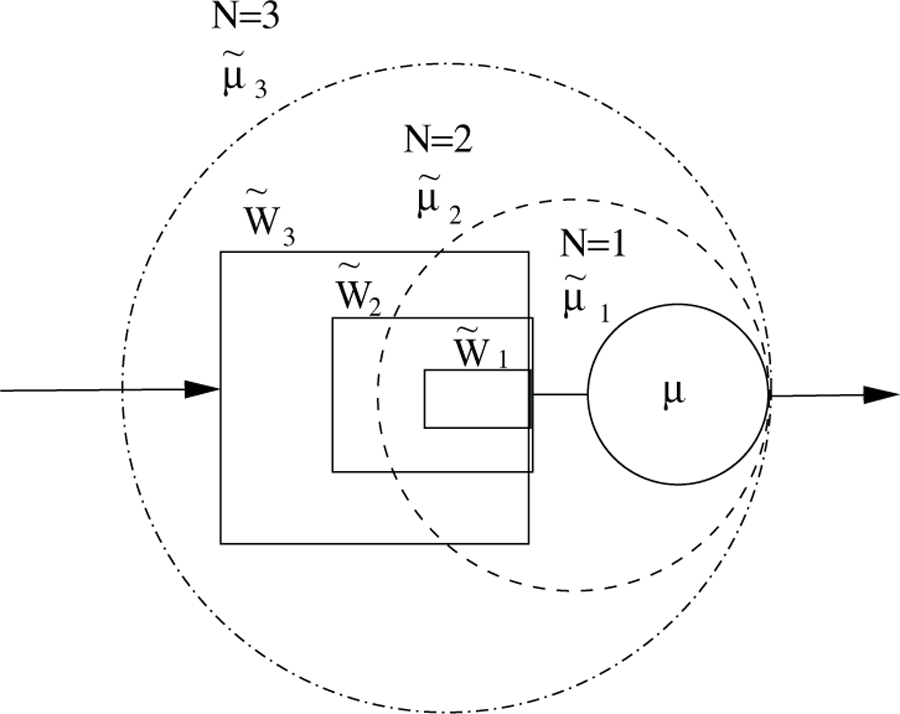
Iteration process for N =3
Formally, the procedure can be expressed as follows:
Procedure 2.
Iterations to calculate waiting times
Step 1: Initialization. Set k =1 and .
- Step 2: Analyze handoff process with N = 1 and initial state probability pnxy(t)= 1, and calculate waiting time through Laplace transform and inverse transform, i.e.,
where denotes the calculation of W1 using (10).(11)
where(7) - Step 3: Assign the aggregated service time by adding the waiting time, i.e.,
(12) - Step 4: Let k = k + 1. If k = N, stop and use (8) to calculate
(13)
Otherwise, go back to Step 2 and repeat the process.
Remark 6.
Note that (n, x, y) = (0, 0, 1) is typically selected as the initial state.
B. Accuracy
To evaluate the accuracy of such an approximation method, a Python simulation model is developed. Specifically, For each capacity, N = 2 and N = 3, 200 experiments are conducted by randomly selecting parameters of λ, μ, α, and β (per hour) from the following intervals, based on the ranges summarized from hospital ED data.
| (14) |
In the simulation setting, the time instant t is selected at 0.5, 1, 1.5 and 2 hours, and simulation continues until all waiting requests before or at t =2 can be served. For each experiment, 6,000 replications are carried out. The system performance measures with 95% confidence intervals (CIs) are recorded, which are consistently within 2% of the associated measures. Then the simulation results are compared with those obtained from Procedure 2. Define the absolute and relative errors as:
| (15) |
where M = 200 is the number of experiments, and represent the expected waiting time at time t obtained from Procedure 2 and simulation for data set k and queue capacity i, respectively. The comparison results are summarized in Table I.
TABLE I.
Accuracy of Procedure 2
| t (hour) | 0.5 | 1 | 1.5 | 2 | |
|---|---|---|---|---|---|
| δ2(t) (%) | Mean | 2.43 | 3.31 | 3.87 | 3.99 |
| Max | 9.09 | 10.93 | 10.77 | 10.81 | |
| Δ2(t) (min) | Mean | 0.17 | 0.25 | 0.31 | 0.32 |
| Max | 0.73 | 1.16 | 1.13 | 1.14 | |
| (a) N = 2 | |||||
| t (hour) | 0.5 | 1 | 1.5 | 2 | |
| δ3(t) (%) | Mean | 6.54 | 6.68 | 6.28 | 6.24 |
| Max | 15.37 | 15.99 | 15.15 | 15.51 | |
| Δ3(t) (min) | Mean | 0.52 | 0.65 | 0.66 | 0.69 |
| Max | 1.43 | 2.09 | 2.71 | 2.67 | |
| (b) N = 3 | |||||
Examining the results, we observe that the errors increase with capacity N but are still small, where the average errors are less than one minute. Even the maximal ones are less than three minutes, which are not significant. Therefore, Procedure 2 provides a method to evaluate transient performance of the handoff process with acceptable accuracy.
Note that Procedure 2 is computationally efficient. For example, for N = 3, the calculation takes a few seconds only. All these experiments are carried out in Matlab R2018b on a desktop with an Intel i5 3.10 GHz CPU and 12G RAM. However, it seldom happens in an hospital ED that a large amount of patients need to be transferred almost at the same time. If such a scenario occurs, the overflow patients are typically transferred to other units or intermediate area first. Thus, in this paper, we only investigate accuracy for N ≤ 3. Systems with larger N’s will be studied in future work.
C. System Properties
To investigate the monotonicity of the system with respect to its parameters, numerical experiments are carried out. As shown in Figure 5 as well as in other examples, the waiting times are monotonically increasing in α and λ and decreasing in β and μ. Thus, more transfer requests or possible unavailability will lead to longer waiting and handoff time, while faster service and quick resuming of availability can result in shorter time. In addition, the expected waiting time becomes longer when t become larger, since there could be more prior requests waiting for transfer. However, the increase in waiting time becomes saturate for longer t (e.g., t ≥ 1.5), which is due to the queue capacity limit that the overflow requests will be transferred to other units or hospitals. Then the waiting time performance starts to approximate to the steady state behavior. Moreover, it suggests that the waiting time is less sensitive to α and β. The reason could be due to that the unavailability could delay the later requests but does not affect the current transferring one. Meanwhile, changes in service rate could impact waiting time more significantly. As communications can be strongly correlated to service rate, enabling effective coordination to reduce delays is of critical importance.
Fig. 5.

Monotonic properties (N = 3)
VI. Conclusions and future work
This paper introduces a Markov chain model to study the transient performance of handoff process in hospital emergency departments. The handoff process is characterized by a stochastic process with unavailability of service and finite waiting capacity. Through Laplace transform of balance equations and inverse transform, the system performance for handoff process with at most one waiting request is evaluated. Using this result, an iteration method is introduced to study the process allowing more waiting requests. It is shown that such a method results in acceptable accuracy in performance evaluation, which provides a quantitative tool to study the dynamic behavior of handoff processes.
As a preliminary work in this area, there exist limitations and challenges, but also new opportunities. More in-depth research needs to be carried out in future work. Particularly, the following directions will be pursued: We will extend the study to consider systems with general distributions characterizing inter-arrival, service, available and unavailable times. In addition, more detailed handoff processes, including coordination, reviewing, and transfer activities, as well as different service rules (such as priority policy) and larger queue capacity, will be included in the model to better represent the scenarios on the hospital floor. Finally, validating and applying the methods in hospital EDs will be pursued.
Acknowledgement
This research was supported in part by the grant CMMI-1536987 from the National Science Foundation, grant 5R18HS026624 from the Agency for Healthcare Research and Quality (AHRQ), and grant UL1TR000427 from the Clinical and Translational Science Award (CTSA) program, through the NIH National Center for Advancing Translational Sciences (NCATS). The work was also supported in part by the University of Wisconsin School of Medicine and Public Health through Wisconsin Partnership Program funding to the Wisconsin Institute for Healthcare Engineering and the Health Innovation Program. The content is solely the responsibility of the authors and does not necessarily represent the official views of NSF, AHRQ and the NIH.
References
- [1].Clancy S, “Care transitions: a threat and an opportunity for patient safety,” American Journal of Medical Quality, vol. 21, no. 6, pp. 415–418, 2006. [DOI] [PubMed] [Google Scholar]
- [2].Handel D, Hilton J, Ward M, Rabin E, Zwemer F Jr, and Pines J, “Emergency department throughput, crowding, and financial outcomes for hospitals,” Academic Emergency Medicine, vol. 17, no. 8, pp. 840–847, 2010. [DOI] [PubMed] [Google Scholar]
- [3].Green L, “Queueing analysis in healthcare,” in Patient Flow: Reducing Delay in Healthcare Delivery (Hall RW, ed.), Springer, 2006. [Google Scholar]
- [4].Fomundam S and Herrmann J, “A survey of queuing theory applications in healthcare” Technical Report, University of Maryland, College Park, MD, 2007. [Google Scholar]
- [5].Bhattacharjee P and Ray P, “Patient flow modelling and performance analysis of healthcare delivery processes in hospitals: a review and reflections,” Computers & Industrial Engineering, vol. 78, pp. 299–312, 2014. [Google Scholar]
- [6].Smith C, “Interunit handoffs from emergency department to inpatient care: A cross-sectional survey of physicians at a university medical center,” Journal of Hospital Medicine, vol. 10, no. 11, pp. 711–717, 2015. [DOI] [PubMed] [Google Scholar]
- [7].Smith C, “Evaluation of a novel handoff communication strategy for patients admitted from the emergency department,” Western Journal of Emergency Medicine, vol. 19, no. 2, pp. 372–379, 2018. [DOI] [PMC free article] [PubMed] [Google Scholar]
- [8].Hilligoss B, “Chart biopsy: an emerging medical practice enabled by electronic health records and its impacts on emergency department–inpatient admission handoffs,” Journal of the American Medical Informatics Association, vol. 20, no. 2, pp. 260–267, 2013. [DOI] [PMC free article] [PubMed] [Google Scholar]
- [9].Brandeau ML, Sainfort F, and Pierskalla WP, Operations research and health care: a handbook of methods and applications. Springer Science & Business Media, 2004. [Google Scholar]
- [10].Hall R, Patient Flow: Reducing Delay in Healthcare Delivery. Spinger, 2006. [Google Scholar]
- [11].Li J, Kong N, and Xie X, Stochastic Modeling and Analytics in Healthcare Delivery Systems. World Scientific Publishing, 2017. [Google Scholar]
- [12].Wiler J, Griffey R, and Olsen T, “Review of modeling approaches for emergency department patient flow and crowding research,” Academic Emergency Medicine, vol. 18, no. 2, pp. 1371–1379, 2011. [DOI] [PubMed] [Google Scholar]
- [13].Landa P, Sonnessa M, Tànfani E, and Testi A, “Multiobjective bed management considering emergency and elective patient flows,” International Transactions in Operational Research, vol. 25, no. 1, pp. 91–110, 2018. [Google Scholar]
- [14].Schmidt R, Geisler S, and Spreckelsen C, “Decision support for hospital bed management using adaptable individual length of stay estimations and shared resources,” BMC Medical Informatics and Decision Making, vol. 13, no. 1, p. 3, 2013. [DOI] [PMC free article] [PubMed] [Google Scholar]
- [15].Takagi H, Kanai Y, and Misue K, “Queueing network model for obstetric patient flow in a hospital,” Health Care Management Science, vol. 20, no. 3, pp. 433–451, 2017. [DOI] [PubMed] [Google Scholar]
- [16].Cochran J and Bharti A, “Stochastic bed balancing of an obstetrics hospital,” Health Care Management Science, vol. 9, no. 1, pp. 31–45, 2006. [DOI] [PubMed] [Google Scholar]
- [17].Dolcetti S, Analyzing the Impact of Delays for Patient Transfers from the ICU to General Care Units. MS Thesis, Massachusetts Institute of Technology, 2007. [Google Scholar]
- [18].Lee H, Li J, Musa A, Bain P, and Nelson K III, “Modeling and analysis of patient transitions in community hospitals: a systems approach,” IEEE Transactions on Systems, Man, and Cybernetics - Systems, vol. 50, no. 2, pp. 686–699, 2020. [Google Scholar]
- [19].Lee H, Musa A, Bain P, Nelson K, Baker C, and Li J, “A queueing network model for analysis of patient transitions within hospitals,” IEEE Transactions on Automation Science and Engineering, vol. 16, no. 1, pp. 6–20, 2019. [Google Scholar]
- [20].Grassmann WK, “Transient solutions in markovian queueing systems,” Computers & Operations Research, vol. 4, no. 1, pp. 47–53, 1977. [Google Scholar]
- [21].Abate J and Whitt W, “Transient behavior of the m/m/1 queue via laplace transforms,” Advances in Applied Probability, vol. 20, no. 1, pp. 145–178, 1988. [Google Scholar]
- [22].Abate J and Whitt W, “Transient behavior of the m/g/1 workload process,” Operations Research, vol. 42, no. 4, pp. 750–764, 1994. [Google Scholar]
- [23].Joy M and Jones S, “Transient probabilities for queues with applications to hospital waiting list management,” Health care management science, vol. 8, no. 3, pp. 231–236, 2005. [DOI] [PubMed] [Google Scholar]
- [24].Kaczynski WH, Leemis LM, and Drew JH, “Transient queueing analysis,” INFORMS Journal on Computing, vol. 24, no. 1, pp. 10–28, 2012. [Google Scholar]
- [25].Kumar BK, Krishnamoorthy A, Madheswari SP, and Basha SS, “Transient analysis of a single server queue with catastrophes, failures and repairs,” Queueing systems, vol. 56, no. 3–4, pp. 133–141, 2007. [Google Scholar]
- [26].Sudhesh R, “Transient analysis of a queue with system disasters and customer impatience,” Queueing systems, vol. 66, no. 1, pp. 95–105, 2010. [Google Scholar]
- [27].Ammar S, “Transient analysis of an m/m/1 queue with impatient behavior and multiple vacations,” Applied Mathematics and Computation, vol. 260, pp. 97–105, 2015. [Google Scholar]
- [28].Ghimirel R, “Heterogeneous arrival and departure m/m/1 queue with vacation and service breakdown,” Management Science and Engineering, vol. 5, no. 3, pp. 61–67, 2011. [Google Scholar]
- [29].Proudlove N, Boaden R, and Jorgensen J, “Developing bed managers: the why and the how,” Journal of nursing management, vol. 15, no. 1, pp. 34–42, 2007. [DOI] [PubMed] [Google Scholar]