Abstract
Purpose
To explore the feasibility of using four-dimensional (4D) flow MRI to quantify blood flow and kinetic energy (KE) in the heart during strenuous exercise.
Materials and Methods
For this prospective study, cardiac 4D flow MRI was performed in 11 healthy young adult participants (eight men, three women; mean age, 26 years ± 1 [standard deviation]) at rest and during exercise with an MRI-compatible exercise stepper between March 2016 and July 2017. Flow was measured in the ascending aorta (AAo) and main pulmonary artery (MPA). KE was quantified in the left and right ventricle. Significant changes in flow and KE during exercise were identified by using t tests. Repeatability was assessed with inter- and intraobserver comparisons and an analysis of internal flow consistency.
Results
Nine participants successfully completed both rest and exercise imaging. Internal flow consistency analysis in systemic and pulmonary circulation showed average relative differences of 10% at rest and 16% during exercise. For flow measurements in the AAo and MPA, relative differences between observers never exceeded 6% in any vessel and showed excellent correlation, even during exercise. Relative differences were increased for KE, typically on the order of 30%, with poor interobserver correlation between measurements.
Conclusion
Four-dimensional flow MRI can quantify increases in flow in the AAo and MPA during strenuous exercise and is highly repeatable. KE had reduced repeatability because of suboptimal segmentation methods and requires further development before clinical implementation.
Supplemental material is available for this article.
© RSNA, 2020
See also the commentary by Markl and Lee in this issue.
Summary
Although free-breathing four-dimensional flow MRI can be used to quantify flow in the great vessels of the heart during strenuous exercise with high repeatability, ventricular kinetic energy measurements require further optimization to improve repeatability.
Key Points
■ Extended free-breathing cardiac four-dimensional flow MRI can be performed during strenuous exercise with retrospective respiratory and cardiac gating.
■ Flow measurements in the great vessels of the heart can be obtained during exercise with excellent repeatability and good internal consistency.
■ Although ventricular kinetic energy can be measured during exercise, these measurements have poor interobserver repeatability and require further optimization.
Introduction
Exercise cardiac MRI is an emerging technique with great clinical potential. Previous studies have used exercise either adjacent to or inside the bore of the MRI scanner to measure ventricular volumes (1,2), myocardial perfusion (3), and cardiac output (CO) (4–6) immediately after or during exercise. Exercise cardiac MRI has shown similar diagnostic capabilities to those of the clinical standards of stress echocardiography (7) and stress nuclear imaging (8) when monitoring for exercise-induced wall motion abnormalities and changes to myocardial perfusion. However, the potential of exercise cardiac MRI is largely untapped as there are many modalities that have not yet been explored.
One such modality is time-resolved volumetric three-directional velocity mapping, or four-dimensional (4D) flow MRI. Four-dimensional flow MRI allows for simultaneous measurement of flow in several vessels and hemodynamic derivatives of the velocity field, including ventricular kinetic energy (KE) (9,10). The work performed by the ventricles in each cardiac cycle can be broken into stroke work, which adjusts pressure in the ventricle, and kinetic work, which imparts velocity to the blood (11,12). Four-dimensional flow MRI has been used to quantify ventricular KE at rest, revealing altered ventricular KE in several cardiovascular diseases (13–15). Measurement of ventricular KE during exercise, in which the proportion of ventricular work converted to KE is theoretically increased (10,11), may provide useful insights into cardiac disease physiology.
Although the value of 4D flow MRI to simultaneously quantify CO and ventricular KE at rest has been demonstrated, the feasibility of this technique during exercise has not been explored. In this pilot study, we investigated the feasibility of performing free-breathing 4D flow MRI during continuous high-intensity exercise to quantify blood flow and ventricular KE in healthy adult participants. This allowed for a characterization of the physiologic response to exercise stress and prevented heart rate recovery during imaging. Interobserver repeatability of CO and KE was assessed in both the right and left sides of the heart. We hypothesized that while the overall image quality of 4D flow MRI may slightly decrease during exercise because of participant motion, a retrospectively gated approach should be able to help quantify flow and ventricular KE during exercise.
Materials and Methods
Participant Sample
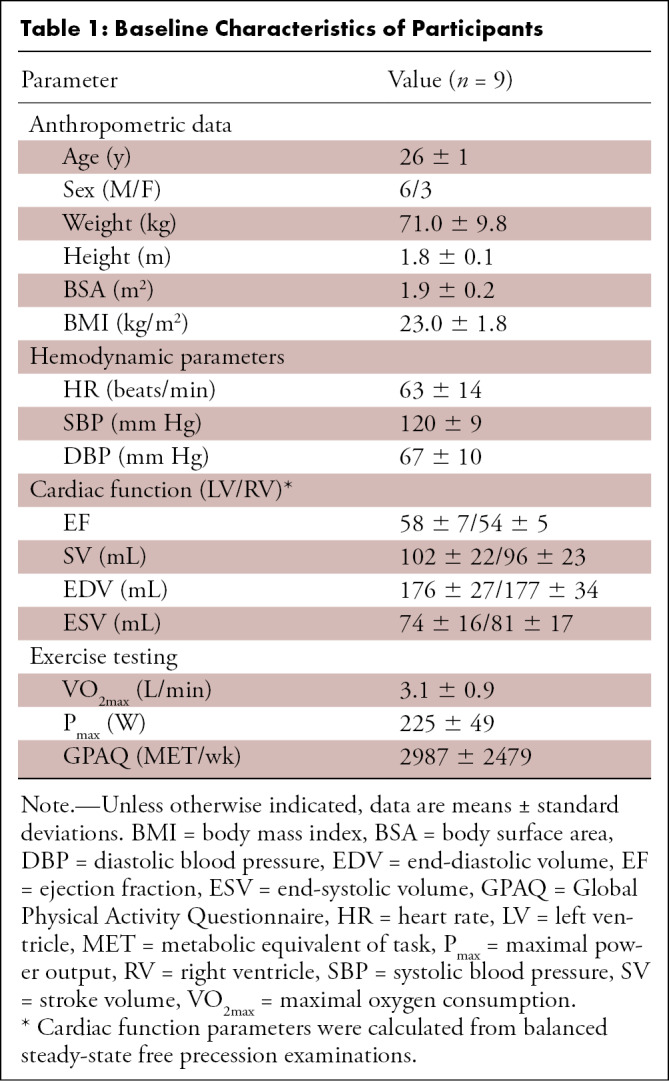
Eleven healthy adults at similar levels of fitness, as determined by the Global Physical Activity Questionnaire, were recruited for this prospective pilot study from March 2016 to July 2017. Baseline parameters for the participants who completed all imaging are provided in Table 1. All participants provided written informed consent. Exclusion criteria included a history of cardiovascular or cardiopulmonary disease, muscular or skeletal abnormalities, significant health problems requiring treatment with daily medication, height over 6’ 3” (the maximum height accommodated by the exercise stepper), and contraindications to MRI. This study was approved by the local institutional review board and was compliant with the Health Insurance Portability and Accountability Act.
Table 1:
Baseline Characteristics of Participants
Exercise Protocol
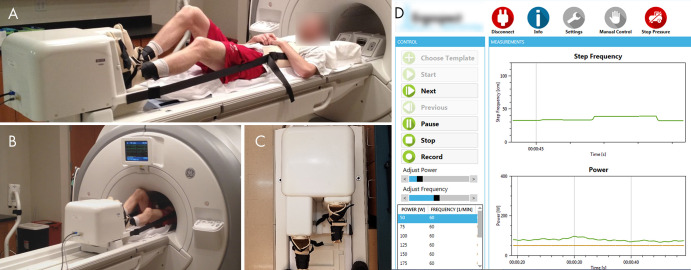
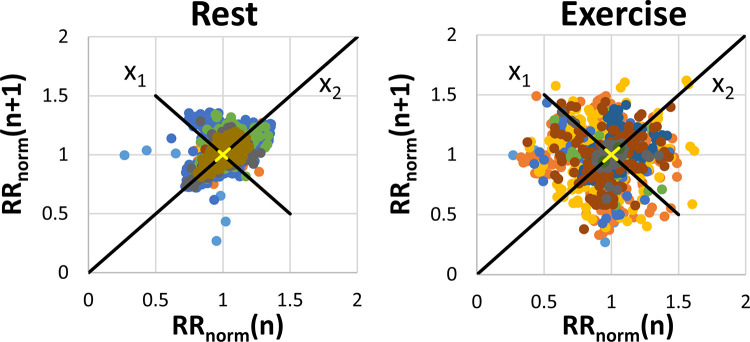
Exercise was performed in the magnet bore with a pneumatic MRI-compatible exercise stepper (Cardio Step Module; Ergospect, Innsbruck, Austria) (Fig 1). This equipment monitored step frequency and exercise power in real time and automatically adjusted stepping resistance to maintain the target exercise power. The target exercise power for each participant was 70% of the power, as defined by the stepper, corresponding to the maximal oxygen consumption of each participant, which was previously established on a bicycle ergometer in an exercise laboratory. Participants stepped in rhythm to a metronome beat at 60 steps per minute for the duration of exercise. During exercise, the heart rate of each participant was monitored with electrocardiographic gating conducted by an exercise physiologist. Exercise imaging was obtained when the physiologist determined the participant had achieved a steady-state heart rate. This was subjectively defined as when the heart rate plateaued and showed minimal change with continued exercise, typically 2–3 minutes after the start of exercise. Composite Poincaré plots (16) were constructed using R-R interval lengths normalized to each participant’s median value to characterize heart rate variability and determine whether steady-state heart rates were maintained during exercise.
Figure 1:
A, Photograph shows the participant set-up for the MRI-compatible exercise stepper. The participant is attached to the stepper with boots with hook and loop fastener straps. A chest harness connected to the stepper minimizes bulk motion during exercise. The strap lengths can be altered to adjust the participant’s positioning on the table. B, Photograph shows the participant exercising in MRI bore. C, Photograph of the frontal view of the stepper shows the dynamic range of stepper pedals. D, Screenshot of monitoring software shows the real-time measurements of step frequency and power during exercise.
4D Flow MRI Acquisition
Imaging was performed with a 3.0-T MRI scanner (Discovery 750; GE Healthcare, Waukesha, Wis) with an eight-channel cardiac coil. Four-dimensional flow MRI at rest and during exercise was performed with a radially undersampled 4D flow sequence (phase-contrast vastly undersampled isotropic projection imaging [PC VIPR]) (17,18), and the parameters are provided in Table 2. The acquisition was retrospectively gated for respiratory motion with an abdominal bellow to include only expiration (50% efficiency) and for cardiac motion using electrocardiography for cine reconstruction (19,20) with 15 cardiac phases.
Table 2:
Scan Parameters for 4D Flow Acquisitions during Rest and Exercise
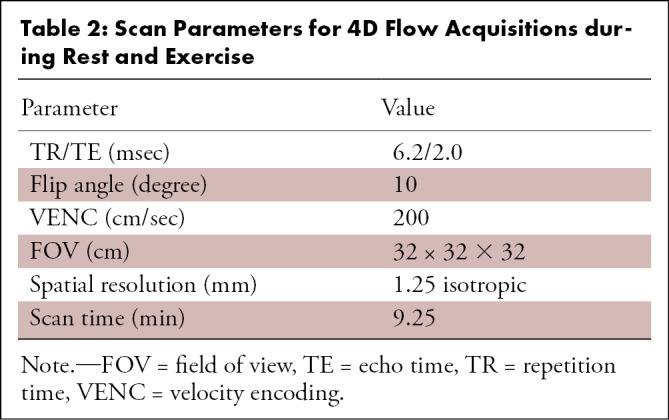
Image Quality Assessment
Two radiologists with 17 (C.J.F.) and 6 years of experience scored the image quality of the ascending aorta (AAo), aortic arch, descending aorta, main pulmonary artery (MPA), left ventricle (LV), and right ventricle (RV) on the reconstructed time-averaged complex difference MR images by using a magnitude scale with the following criteria: 0 = not visible, 1 = nondiagnostic, 2 = poor, 3 = average, 4 = very good, and 5 = excellent. The images were anonymized and randomized so the reader was blinded to the rest or exercise status. Relative signal-to-noise ratio (SNR) between the images obtained at rest and during exercise for each participant was compared using the SNRstdv method (21).
4D Flow Analysis
The AAo and MPA were segmented from time-averaged complex difference 4D flow MR images by using Mimics (version 17.0, Materialise, Leuven, Belgium). Flow quantification was performed by using Ensight (version 10.0, Ansys, Canonsburg, Pa) to generate time-resolved velocity cut-planes orthogonal to the vessels of interest and a custom MATLAB (MathWorks, Natick, Mass) tool (22) to quantify stroke volume (SV) and flows through the AAo (Qs) and MPA (Qp), as well as the Qp/Qs ratio. Conservation of flow was assessed by comparing Qp with combined flow in the left and right pulmonary arteries and Qs with combined flow in the descending aorta and superior vena cava. The KE within the LV and RV was calculated by segmenting each ventricle on time-averaged 4D flow magnitude MR images in Mimics and applying those segmentations to velocity data by using a MATLAB script (9). KE was quantified across the entire cardiac cycle, at peak systole, and at peak diastole.
Interobserver and intraobserver variability was assessed for flow measurements in the AAo and MPA and KE in the LV and RV during rest and exercise. Interobserver variability was assessed by comparing measurements from the original observer (J.A.M., 5 years of 4D flow postprocessing experience) with those from the second observer (P.A.C., 2 years of experience) blinded to the segmentations and results of the original observer. Mask volumetric agreement between observers was also quantified. To determine intraobserver variability, the original observer repeated all measurements in the AAo, MPA, LV, and RV.
Statistical Analysis
This study was a within-subjects design in which the participants at rest served as their own controls for measurements obtained during exercise. Statistically significant differences between rest and exercise distributions were determined with paired t tests by using MATLAB. A post-hoc power analysis was performed for a power level of 0.8 and to determine the sample sizes needed to detect exercise-induced differences at a significance level of .05, given the effect sizes measured in this study. A Cohen κ coefficient was used to assess interobserver agreement in image quality scores. A Bland-Altman analysis was used to quantify the mean difference and 95% limits of agreement for the interobserver and intraobserver comparisons. The intraclass correlation coefficient (ICC) (3,1) was computed for all repeated measurements. All tests used a P value threshold of .05 for statistical significance. Thresholds were unadjusted for multiple comparisons because there was a low penalty for increased type I error, given the nature of this work as a pilot study.
Results
Four-dimensional flow MRI was successfully performed at rest in 10 of 11 participants and during exercise in 10 of 11 participants. One participant was unable to complete the resting imaging examination because of claustrophobia, and another participant did not complete the exercise imaging examination because of general discomfort. The signal quality of cardiac and respiratory gating observed at exercise was comparable to that observed at rest. The average exercise power output during imaging was 158 W ± 37. This resulted in an average increase of 44% ± 16 in heart rate (rest: 63 beats per minute ± 14; exercise: 92 beats per minute ± 24) during exercise (P = .004). Figure 2 shows the composite Poincaré plots for all participants at rest and during exercise. These plots show similar long-term heart rate variability (change in heart rate across the entire imaging duration [x 2 axis]) across scans at rest and during exercise stress (σx2,rest = 0.095 and σx2,stress = 0.105, respectively). Increased short-term variability (change in heart rate beat-to-beat [x 1 axis]) in heart rate was observed during exercise (σx1,rest = 0.054, σx1,stress = 0.076).
Figure 2:
Composite Poincaré plots generated from normalized R-R interval length data in each participant at rest (left) and during exercise (right). Variation along the x1 axis represents short-term variability in heart rate, whereas variation along the x2 axis represents long-term variability. The different colored dots represent measurements from different participants.
Image Quality Assessment
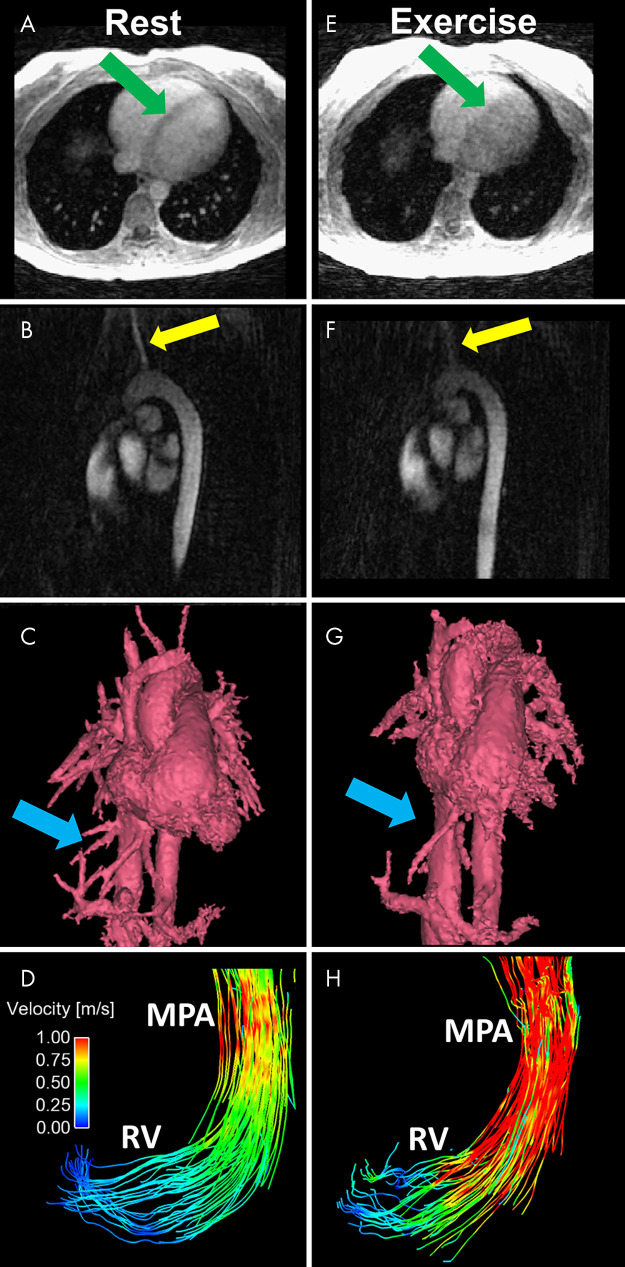
The image scores suggested no significant difference in image quality between rest and exercise for the vessel segments investigated. Mean scores for rest versus exercise were 4.3 ± 0.5 versus 4.4 ± 0.5 (P = .6) in the MPA, 4.0 ± 0.5 versus 3.9 ± 0.4 (P = .99) in the AAo, 3.8 ± 0.9 versus 3.4 ± 0.8 (P = .7) in the aortic arch, and 4.3 ± 0.6 versus 4.4 ± 0.5 (P = .5) in the descending aorta. The Cohen κ score was 0.26. For both rest and exercise images, scores were significantly lower in the AAo and aortic arch compared with those of the MPA (P = .001 and P < .001, respectively). Scores in the ventricles showed a nonsignificant drop with exercise. Mean scores for rest versus exercise were 3.8 ± 0.7 versus 3.4 ± 0.5 (P = .3) in the LV and 4.4 ± 0.5 versus 4.4 ± 0.5 (P = .99) in the RV. For both rest and exercise images, LV image quality was significantly lower than RV image quality (P = .04 and P = .02, respectively). Exercise 4D flow images showed an average decrease in SNR of 16% (maximum decrease, 35%) relative to that on the resting 4D flow images in the same participants, likely the result of increased motion blurring during exercise. Representative examples of the impact of exercise on image quality in magnitude images, complex difference images, and segmented phase-contrast angiograms are shown in Figure 3. Representative pathline animations at rest and during exercise in the LV and RV have been included as Movies 1 and 2 (supplement).
Figure 3:
A–D, Representative images obtained at rest include an A, axial magnitude image, B, sagittal PC angiogram, C, segmented volume-rendered PC angiogram reconstructed from a 4D flow MRI acquisition, and D, pathline visualization image in the RV and MPA. Images E–H show corresponding images obtained during exercise. Increased blurring and decreased conspicuity of regions with slow or complex flow are observed in the axial magnitude image (E, green arrows) and sagittal PC angiogram (F, yellow arrows). G, The volume-rendered angiogram obtained during exercise shows loss of fine vessel detail (blue arrows). H, The pathline visualization image shows increased velocities in the RV and MPA at peak systole. MPA = main pulmonary artery, PC = phase-contrast, RV = right ventricle.
Movie 1:
Representative pathline animations derived from 4D flow images in the left ventricle during rest (left) and exercise (right). Noticeably higher velocities are present in the left ventricle and ascending aorta during exercise.
Movie 2:
Representative pathline animations derived from 4D flow images in the right ventricle during rest (left) and exercise (right). Noticeably higher velocities are present in the right ventricle and main pulmonary artery during exercise.
4D Flow Analysis
Mean systemic SV was 75 mL ± 12 at rest and 81 mL ± 27 during exercise (P = .67), whereas pulmonary SV was 79 mL ± 13 at rest and 93 mL ± 29 during exercise (P = .03). CO showed highly significant increases with exercise, rising from 4.7 L/min ± 0.5 to 7.0 L/min ± 1.4 in the AAo (P = .004) and 4.9 L/min ± 0.8 to 8.0 L/min ± 1.4 in the MPA (P = .004). The average Qp/Qs ratio was 1.05 ± 0.17 at rest and 1.16 ± 0.10 during exercise (P = .10). The results of a post-hoc power analysis determined that minimum sample sizes of 127, 22, 10, 10, and 15 were required for LV SV, RV SV, left-sided heart CO, right-sided heart CO, and Qp/Qs, respectively, to adequately characterize changes in these parameters with exercise.
For internal flow consistency checks at rest, an average difference in flow of 12% was measured between the AAo and combined descending aorta and superior vena cava, whereas an average difference of 8% was observed when comparing flow in the MPA against the left and right pulmonary arteries. During exercise, these differences slightly increased to 15% and 17%, respectively.
On average, LV mask volumes were 152 mL ± 32 at rest and 126 mL ± 43 during exercise (P = .03), whereas RV mask volumes were 147 mL ± 34 at rest and 138 mL ± 47 during exercise (P = .4). The mask volumes evaluated by observer 1 were consistently larger than those evaluated by observer 2: 31% and 39% difference in the LV and RV at rest (P = .007 and P = .01), respectively, and 29% and 44% difference during exercise (P = .005 and P < .001). By using a simplified spherical model, this translated to a 9%–13% difference in the radius of the ventricle mask. Ninety-three percent of mask volumes evaluated by observer 2 intersected mask volumes evaluated by observer 1 at rest, and 89% intersected during exercise. A representative comparison of segmentations between the two observers is presented in Figure 4.
Figure 4:
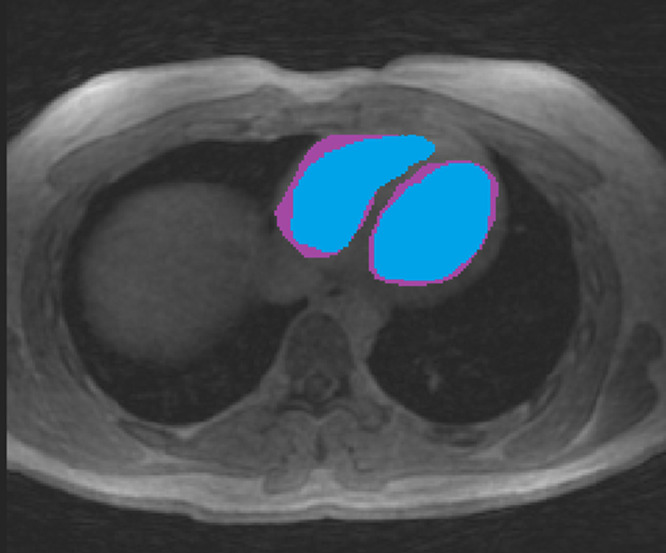
Comparison of segmented masks in the RV and LV between two observers. One observer (blue mask) was consistently more conservative in segmentation than the other observer (purple mask) owing to the poor contrast between the blood pool and myocardial wall. LV = left ventricle, RV = right ventricle.
KE in the RV (KERV) showed significant increases with exercise during both systole (8.3 mJ ± 2.3 at rest and 12.6 mJ ± 4.5 during exercise, P = .02) and diastole (5.7 mJ ± 1.2 at rest and 9.7 mJ ± 5.5 during exercise, P = .02). KE in the LV (KELV), on the other hand, demonstrated nonsignificant increases with exercise for both systole (4.3 mJ ± 1.8 at rest and 9.0 mJ ± 6.8 during exercise, P = .11) and diastole (6.9 mJ ± 2.1 at rest and 8.5 mJ ± 4.0 during exercise, P = .38). During systole, KERV was consistently greater than KELV, but minimal differences were observed during diastole. The results of a post-hoc power analysis suggested sample sizes of at least 10 participants were required to reliably detect increases in both right- and left-sided heart KE with exercise.
Intra- and Interobserver Variability
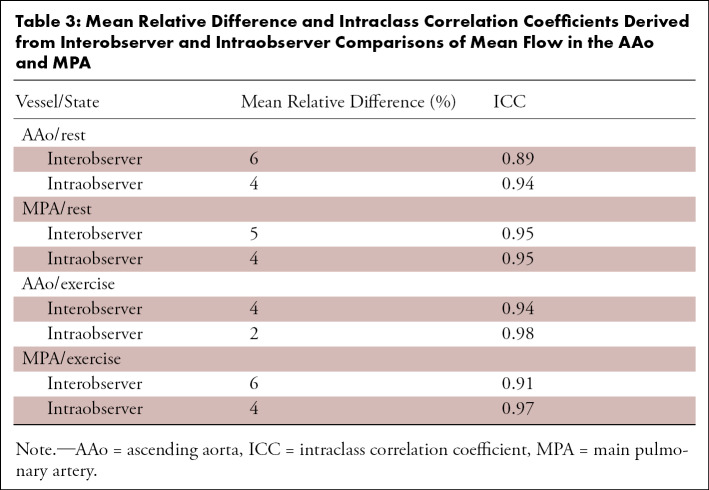
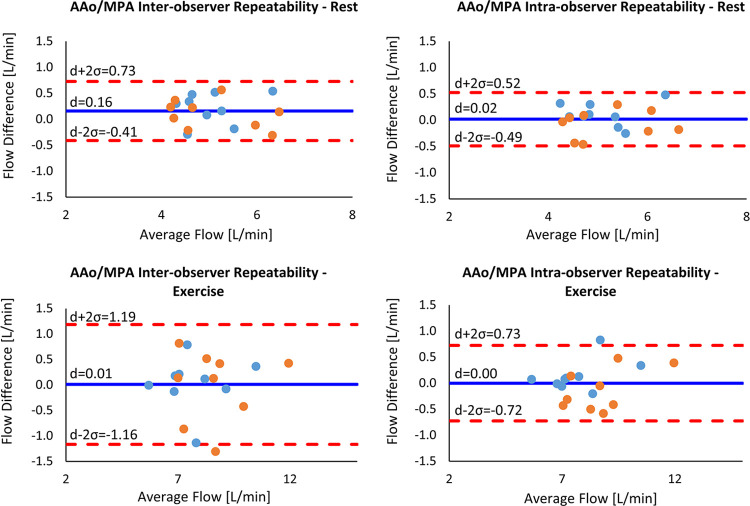
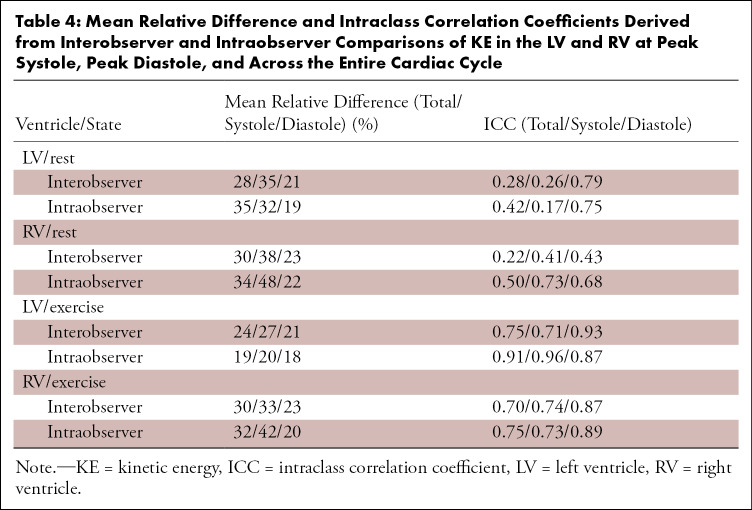
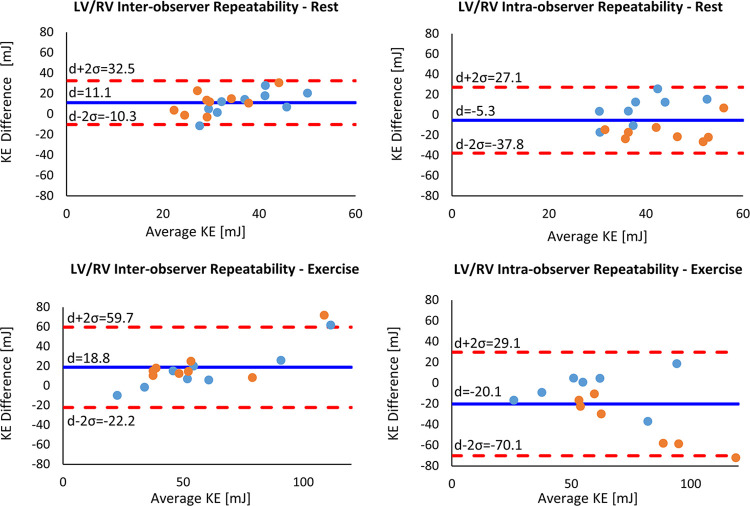
Interobserver and intraobserver comparisons showed excellent reliability (ICC > 0.9) at both rest and stress for flow measurements in the AAo and MPA. The mean relative difference and corresponding ICC between observers are provided in Table 3. Bland-Altman plots are presented in Figure 5 for these comparisons. Interobserver and intraobserver repeatability analysis for KE measurements showed dramatically reduced reliability when compared with flow measurements in the MPA and AAo. The mean relative difference and corresponding ICC between observers are provided in Table 4. Notably, the correlation between measurements was higher during exercise imaging. Bland-Altman plots for total KE are presented in Figure 6 for these comparisons.
Table 3:
Mean Relative Difference and Intraclass Correlation Coefficients Derived from Interobserver and Intraobserver Comparisons of Mean Flow in the AAo and MPA
Figure 5:
Bland-Altman plots for interobserver and intraobserver variability in mean flow in the AAo (blue dots) and MPA (orange dots) at rest and during exercise. The solid blue line indicates the mean difference (d), while the dashed red lines indicate the upper and lower bounds of the 95% limits of agreement. AAo = ascending aorta, MPA = main pulmonary artery.
Table 4:
Mean Relative Difference and Intraclass Correlation Coefficients Derived from Interobserver and Intraobserver Comparisons of KE in the LV and RV at Peak Systole, Peak Diastole, and Across the Entire Cardiac Cycle
Figure 6:
Bland-Altman plots for interobserver and intraobserver variability of total KE in the LV (blue dots) and RV (orange dots) at rest and during exercise. The solid blue line indicates the mean difference (d), while the dashed red lines indicate the upper and lower bounds of the 95% limits of agreement. KE = kinetic energy, LV = left ventricle, RV = right ventricle.
Discussion
This pilot study investigated the feasibility of free-breathing 4D flow MRI during high-power exercise to quantify cardiac blood flow and KE. Imaging during exercise with retrospectively gated 4D flow MRI allowed for quantification of exercise stress at a steady-state heart rate. Motion artifacts from bulk subject motion during exercise resulted in only a minor SNR loss on exercise images, likely because of the inherent motion robustness of the radial k-space trajectory (23). Although spiral acquisitions also would be fairly robust to motion, Cartesian sequences would have limited utility given their increased susceptibility to motion. Image scoring only noted above average noise and artifacts in one exercise acquisition. Scores of the AAo and aortic arch were slightly lower than those of the MPA and descending aorta, perhaps the result of turbulent flow in the AAo and aortic arch causing increased intravoxel dephasing and reducing image signal. Intraobserver and interobserver comparisons for flow in the AAo and MPA showed excellent repeatability (ICC > 0.9) at rest and during exercise, suggesting the observed minor decrease in SNR during exercise was not an impediment to vessel segmentation. Measurements of internal flow consistency also showed good continuity at rest and during exercise, with only minor decreases in continuity with exercise, suggesting the phase-contrast vastly undersampled isotropic projection imaging (PC VIPR) was viable for quantitative flow imaging in these vessels during strenuous exercise.
Post-hoc power calculations suggested that sample sizes on the order of those used in this pilot study were sufficient to capture changes in most of the investigated hemodynamic parameters with exercise stress. The exception was LV SV, as a result of the smaller reported effect size likely linked to the lower signal seen in the AAo.
Four-dimensional flow measurements of SV at rest were consistently 20%–25% lower for each participant than those performed on cine balanced steady-state free-precession images. This underestimation of 4D flow-based approaches has been reported by Frydrychowicz et al (24) and does not preclude meaningful comparisons between 4D flow examinations.
Increases in CO typically occur during exercise because of combined increases in both SV and heart rate. It was not unexpected, however, that this study did not find a significant increase in LV SV between rest and exercise because it has been previously demonstrated that supine exercise often does not have a measurable impact on SV (25). CO showed expected increases with exercise of similar magnitude to those reported in exercise cardiac MRI studies using separate two-dimensional phase-contrast MRI acquisitions (4,6). During exercise, AAo flow was consistently about 15% lower than MPA flow, perhaps the result of increased coronary flow with exercise (26–28).
Ventricular KE increased with exercise, consistent with results from a cardiac catheterization study (12). When compared at rest, KERV was higher than KELV during systole but lower during diastole, in agreement with findings from previous 4D flow studies (9,10). These relationships were preserved during exercise.
KE demonstrated poor repeatability (ICC < 0.5) in the interobserver and intraobserver comparisons. This was likely influenced by the KE calculation in which differences in segmentations were enhanced as a result of a squared velocity term (9). The relatively poor ventricular SNR led to highly subjective ventricular segmentations, not only between different observers but between the same observer on different days. This was apparent in the intraobserver KE Bland-Altman plots in which KELV was consistently underestimated and KERV was overestimated. With poor visibility of the interventricular septum, a decision to be more conservative in the LV led to overestimation of the RV. Comparisons of ventricle mask volumes between observers highlighted the limitations of the time-averaged segmentation approach on 4D flow magnitude images. Segmentations of the LV showed better observer agreement because the LV geometry is simpler to segment in an axial orientation and most observers have more experience segmenting the LV.
The poor KE repeatability suggested limited diagnostic value of this parameter without further optimization. Possible sources of variability in ventricular masks and flow measurements may include poor sequence optimization for this anatomy and the use of a time-averaged mask. Dual-velocity encoding acquisitions (29) are an alternative to improve ventricular SNR without aliasing AAo and MPA flow measurements, but the required increase in scan time would make this approach challenging. Alternative approaches to facilitate time-resolved ventricle segmentation include ferumoxytol administration to improve the contrast between the myocardium and blood pool (30) or the registration of segmented high-contrast cine balanced steady-state free-precession images to the 4D flow images (31).
In conclusion, this study explored the feasibility of free-breathing 4D flow MRI to quantify cardiac flow and KE during strenuous exercise in healthy controls. Minor decreases in SNR were associated with exercise, but exercise flow measurements were relatively observer-independent and repeatable, whereas KE measurements showed high observer dependence. With further development, biventricular 4D flow exercise cardiac MRI can fulfill a valuable clinical role in evaluating patients with right-sided heart dysfunction, a group not well-addressed by stress echocardiography.
Acknowledgments
Acknowledgments
We gratefully acknowledge funding from the NIH and research support from GE Healthcare.
Supported by the National Institutes of Health (R01 HL086897, R01 HL38149).
Disclosures of Conflicts of Interest: J.A.M. disclosed no relevant relationships. A.G.B. disclosed no relevant relationships. P.A.C. Activities related to the present article: supported by two National Institutes of Health awards (UL1TR000427 and TL1TR000429) as a predoctoral trainee. Activities not related to the present article: disclosed no relevant relationships. Other relationships: disclosed no relevant relationships. G.P.B. Activities related to the present article: employed by University of Wisconsin-Madison. Activities not related to the present article: disclosed no relevant relationships. Other relationships: disclosed no relevant relationships. K.N.G. disclosed no relevant relationships. M.W.E. Activities related to the present article: institution received a grant from the National Institutes of Health. Activities not related to the present article: disclosed no relevant relationships. Other relationships: disclosed no relevant relationships. C.J.F. Activities related to the present article: institution received grant from the National Institutes of Health. Activities not related to the present article: grant to institution from GE Healthcare. Other relationships: disclosed no relevant relationships. O.W. Activities related to the present article: disclosed no relevant relationships. Activities not related to the present article: institution received research support from GE Healthcare. Other relationships: disclosed no relevant relationships.
Abbreviations:
- AAo
- ascending aorta
- CO
- cardiac output
- 4D
- four-dimensional
- ICC
- intraclass correlation coefficient
- KE
- kinetic energy
- LV
- left ventricle
- MPA
- main pulmonary artery
- RV
- right ventricle
- SNR
- signal-to-noise ratio
- SV
- stroke volume
References
- 1. Roest AA , Kunz P , Lamb HJ , Helbing WA , van der Wall EE , de Roos A . Biventricular response to supine physical exercise in young adults assessed with ultrafast magnetic resonance imaging . Am J Cardiol 2001. ; 87 ( 5 ): 601 – 605 . [DOI] [PubMed] [Google Scholar]
- 2. La Gerche A , Claessen G , Van de Bruaene A , et al . Cardiac MRI: a new gold standard for ventricular volume quantification during high-intensity exercise . Circ Cardiovasc Imaging 2013. ; 6 ( 2 ): 329 – 338 . [DOI] [PubMed] [Google Scholar]
- 3. Foster EL , Arnold JW , Jekic M , et al . MR-compatible treadmill for exercise stress cardiac magnetic resonance imaging . Magn Reson Med 2012. ; 67 ( 3 ): 880 – 889 . [DOI] [PMC free article] [PubMed] [Google Scholar]
- 4. Weber TF , von Tengg-Kobligk H , Kopp-Schneider A , Ley-Zaporozhan J , Kauczor HU , Ley S . High-resolution phase-contrast MRI of aortic and pulmonary blood flow during rest and physical exercise using a MRI compatible bicycle ergometer . Eur J Radiol 2011. ; 80 ( 1 ): 103 – 108 . [DOI] [PubMed] [Google Scholar]
- 5. Cheng CP , Herfkens RJ , Taylor CA . Inferior vena caval hemodynamics quantified in vivo at rest and during cycling exercise using magnetic resonance imaging . Am J Physiol Heart Circ Physiol 2003. ; 284 ( 4 ): H1161 – H1167 . [DOI] [PubMed] [Google Scholar]
- 6. Habert P , Bentatou Z , Aldebert P , et al . Exercise stress CMR reveals reduced aortic distensibility and impaired right-ventricular adaptation to exercise in patients with repaired tetralogy of Fallot . PLoS One 2018. ; 13 ( 12 ): e0208749 . [DOI] [PMC free article] [PubMed] [Google Scholar]
- 7. Thavendiranathan P , Dickerson JA , Scandling D , et al . Comparison of treadmill exercise stress cardiac MRI to stress echocardiography in healthy volunteers for adequacy of left ventricular endocardial wall visualization: a pilot study . J Magn Reson Imaging 2014. ; 39 ( 5 ): 1146 – 1152 . [DOI] [PMC free article] [PubMed] [Google Scholar]
- 8. Raman SV , Dickerson JA , Mazur W , et al . Diagnostic performance of treadmill exercise cardiac magnetic resonance: the prospective, multicenter exercise CMR’s accuracy for cardiovascular stress testing (EXACT) trial . J Am Heart Assoc 2016. ; 5 ( 8 ): 1 – 11 . [DOI] [PMC free article] [PubMed] [Google Scholar]
- 9. Hussaini SF , Rutkowski DR , Roldán-Alzate A , François CJ . Left and right ventricular kinetic energy using time-resolved versus time-average ventricular volumes . J Magn Reson Imaging 2017. ; 45 ( 3 ): 821 – 828 . [DOI] [PubMed] [Google Scholar]
- 10. Carlsson M , Heiberg E , Toger J , Arheden H . Quantification of left and right ventricular kinetic energy using four-dimensional intracardiac magnetic resonance imaging flow measurements . Am J Physiol Heart Circ Physiol 2012. ; 302 ( 4 ): H893 – H900 . [DOI] [PubMed] [Google Scholar]
- 11. Herring N , Paterson DJ . Levick’s Introduction to Cardiovascular Physiology . 6th ed. Boca Raton, Fla: : CRC; , 2018. . [Google Scholar]
- 12. Prec O , Katz LN , Sennett L , Rosenman R , Fishman A , Hwang W . Determination of kinetic energy of the heart in man . Am J Physiol 1949. ; 159 ( 3 ): 483 – 491 . [DOI] [PubMed] [Google Scholar]
- 13. Kanski M , Arvidsson PM , Töger J , et al . Left ventricular fluid kinetic energy time curves in heart failure from cardiovascular magnetic resonance 4D flow data . J Cardiovasc Magn Reson 2015. ; 17 ( 1 ): 111 . [DOI] [PMC free article] [PubMed] [Google Scholar]
- 14. Jeong D , Anagnostopoulos PV , Roldan-Alzate A , et al . Ventricular kinetic energy may provide a novel noninvasive way to assess ventricular performance in patients with repaired tetralogy of Fallot . J Thorac Cardiovasc Surg 2015. ; 149 ( 5 ): 1339 – 1347 . [DOI] [PMC free article] [PubMed] [Google Scholar]
- 15. Eriksson J , Bolger AF , Ebbers T , Carlhäll CJ . Four-dimensional blood flow-specific markers of LV dysfunction in dilated cardiomyopathy . Eur Heart J Cardiovasc Imaging 2013. ; 14 ( 5 ): 417 – 424 . [DOI] [PMC free article] [PubMed] [Google Scholar]
- 16. Singh B . ECG artifacts and Poincaré plot based heart rate variability . Int J Biol Med Res 2016. ; 7 ( 1 ): 5350 – 5353 . [Google Scholar]
- 17. Gu T , Korosec FR , Block WF , et al . PC VIPR: a high-speed 3D phase-contrast method for flow quantification and high-resolution angiography . AJNR Am J Neuroradiol 2005. ; 26 ( 4 ): 743 – 749 . [PMC free article] [PubMed] [Google Scholar]
- 18. Johnson KM , Lum DP , Turski PA , Block WF , Mistretta CA , Wieben O . Improved 3D phase contrast MRI with off-resonance corrected dual echo VIPR . Magn Reson Med 2008. ; 60 ( 6 ): 1329 – 1336 . [DOI] [PMC free article] [PubMed] [Google Scholar]
- 19. Schrauben EM , Anderson AG , Johnson KM , Wieben O . Respiratory-induced venous blood flow effects using flexible retrospective double-gating . J Magn Reson Imaging 2015. ; 42 ( 1 ): 211 – 216 . [DOI] [PubMed] [Google Scholar]
- 20. Liu J , Redmond MJ , Brodsky EK , et al . Generation and visualization of four-dimensional MR angiography data using an undersampled 3-D projection trajectory . IEEE Trans Med Imaging 2006. ; 25 ( 2 ): 148 – 157 . [DOI] [PubMed] [Google Scholar]
- 21. Dietrich O , Raya JG , Reeder SB , Reiser MF , Schoenberg SO . Measurement of signal-to-noise ratios in MR images: influence of multichannel coils, parallel imaging, and reconstruction filters . J Magn Reson Imaging 2007. ; 26 ( 2 ): 375 – 385 . [DOI] [PubMed] [Google Scholar]
- 22. Stalder AF , Russe MF , Frydrychowicz A , Bock J , Hennig J , Markl M . Quantitative 2D and 3D phase contrast MRI: optimized analysis of blood flow and vessel wall parameters . Magn Reson Med 2008. ; 60 ( 5 ): 1218 – 1231 . [DOI] [PubMed] [Google Scholar]
- 23. Glover GH , Pauly JM . Projection reconstruction techniques for reduction of motion effects in MRI . Magn Reson Med 1992. ; 28 ( 2 ): 275 – 289 . [DOI] [PubMed] [Google Scholar]
- 24. Frydrychowicz A , Wieben O , Niespodzany E , Reeder SB , Johnson KM , François CJ . Quantification of thoracic blood flow using volumetric magnetic resonance imaging with radial velocity encoding: in vivo validation . Invest Radiol 2013. ; 48 ( 12 ): 819 – 825 . [DOI] [PMC free article] [PubMed] [Google Scholar]
- 25. Spodick DH , Quarry-Pigott VM . Effects of posture on exercise performance: measurement by systolic time intervals . Circulation 1973. ; 48 ( 1 ): 74 – 78 . [DOI] [PubMed] [Google Scholar]
- 26. Jorgensen CR , Gobel FL , Taylor HL , Wang Y . Myocardial blood flow and oxygen consumption during exercise . Ann N Y Acad Sci 1977. ; 301 : 213 – 223 . [DOI] [PubMed] [Google Scholar]
- 27. Holmberg S , Serzysko W , Varnauskas E . Coronary circulation during heavy exercise in control subjects and patients with coronary heart disease . Acta Med Scand 1971. ; 190 ( 6 ): 465 – 480 . [DOI] [PubMed] [Google Scholar]
- 28. Wyss CA , Koepfli P , Mikolajczyk K , Burger C , von Schulthess GK , Kaufmann PA . Bicycle exercise stress in PET for assessment of coronary flow reserve: repeatability and comparison with adenosine stress . J Nucl Med 2003. ; 44 ( 2 ): 146 – 154 . [PubMed] [Google Scholar]
- 29. Nett EJ , Johnson KM , Frydrychowicz A , et al . Four-dimensional phase contrast MRI with accelerated dual velocity encoding . J Magn Reson Imaging 2012. ; 35 ( 6 ): 1462 – 1471 . [DOI] [PMC free article] [PubMed] [Google Scholar]
- 30. Hanneman K , Kino A , Cheng JY , Alley MT , Vasanawala SS . Assessment of the precision and reproducibility of ventricular volume, function, and mass measurements with ferumoxytol-enhanced 4D flow MRI . J Magn Reson Imaging 2016. ; 44 ( 2 ): 383 – 392 . [DOI] [PMC free article] [PubMed] [Google Scholar]
- 31. Gupta V , Bustamante M , Fredriksson A , Carlhäll CJ , Ebbers T . Improving left ventricular segmentation in four-dimensional flow MRI using intramodality image registration for cardiac blood flow analysis . Magn Reson Med 2018. ; 79 ( 1 ): 554 – 560 . [DOI] [PubMed] [Google Scholar]


