Abstract
The potential association between the prognosis of the pancreatic adenocarcinoma (PAAD) and its microenvironment is unclear. This study aims to construct a prognostic index (PI) model of the PAAD microenvironment to predict PAAD patient survival outcomes.
The mRNA sequencing and the clinical parameters data were obtained from The Cancer Genome Atlas. Immune and stromal scores were computed using the expression data algorithm to capture infiltration of immune and stromal cells in the PAAD tissue, where patients were categorized as high and low score groups according to these scores. Differentially expressed genes were identified using the R package LIMMA. Univariate and multivariate Cox regression analysis were conducted to select candidate survival-correlated gene signatures from the tumor microenvironment for constructing a model. The Kaplan-Meier method was used to access overall survival of the primary and validation cohorts. The immunological features of the PI model was explored using the Tumor Immune Estimation Resource (TIMER) database. Bioinformatic analyses were conducted based on the DAVID database.
A total of 1266 overlapping differentially expressed genes and 49 prognosis-associated genes were identified. A 7-mRNA signature (GBP5, BICC1, SLC7A14, CYSLTR1, P2RY6, VENTX, and RAB39B) was screened for the construction of a PI model (area under the curve = 0.791). In both the primary and validation cohorts, Kaplan Meier analysis revealed that the overall survival of the high-risk group was significantly worse compared to the low-risk group (P < .0001, P = .0028 respectively). The TIMER database described that the 7 signature genes were correlated with immune infiltrating cells and tumor purity. Bioinformatic analyses revealed that these prognosis-associated genes were significantly enriched during inflammation, the defense response, would response, calcium ion transport, and plasma membrane part.
A list of the prognosis-correlated genes was generated based on the PAAD microenvironment. A 7-mRNA PI model may be used for predicting the prognosis of PAAD patients.
Keywords: microenvironment, pancreatic adenocarcinoma, prognosis, survival, the cancer genome atlas
1. Introduction
Pancreatic adenocarcinoma (PAAD) is a malignant cancer that ranked as the seventh cause of cancer associated deaths (n = 432,000) with a new diagnosis rate of n = 459,000 in 2018.[1] Among all pancreatic malignancies, pancreatic ductal adenocarcinoma (PDAC) accounts for a 95% mortality rate with a 5-year survival rate of only 5%.[2] To achieve a better prognosis, immunotherapy treatments, along with conventional methods including surgery and adjuvant therapies, were added to the therapy regimen for PAAD patients.
The development and progression of cancer is complex and is regulated by an intricate network of both intrinsic and extrinsic factors. The genetic compositions of the tumor determine its initiation, progression, and evolution.[3] Extrinsically, the tumor microenvironment that consists of surrounding blood vessels, immune cells, signaling molecules, fibroblasts and the extracellular matrix (ECM)[4,5] interacts with cancer tissues and affects tumor cell behavior.[6,7] Amongst the tumor microenvironment constituents, the immune and the stromal cells play crucial roles in the diagnostic, efficacy and prognostic assessment of the tumors.[8,9] Estimation of the Stromal and Immune cells in Malignant Tumors using Expression data (ESTIMATE), is a reliable algorithm designed by Yoshihara et al. that enables the prediction of tumor purity using gene expression data.[10] In this algorithm, the infiltration of immune cells and the content of stromal cells in the cancerous tissues are determined according to specific gene signatures of immune and stromal cells. The ESTIMATE algorithm has been utilized in the breast cancer, melanoma, prostate cancer, colon cancer, glioblastoma and others.[11–15] However, to date, the potential relationship between the prognosis of the PAAD and its microenvironment remains unclear.
In this study, the ESTIMATE algorithm-derived immune and stromal scores as well as PAAD RNA-seq data from The Cancer Genome Atlas (TCGA) were used to generate a list of the microenvironment-related genes with the goal of constructing an mRNA-based prognostic index (PI) model to predict adverse clinical outcomes for PAAD patients. This PI model can be further used to find potential immunotherapy biomarkers for PAAD.
2. Material and methods
2.1. Publicly available data sources
Level3 sets of sequence-based mRNA expression data (RNA-seq data) and clinical data for PAAD cases were obtained from TCGA database (https://tcga-data.nci.nih.gov/tcga/). Level3 RNA-seq data was normalized using the transcripts per kilobase million (TPM) algorithm to determine differentially expressed genes (DEGs) and analyze survival rates. The ESTIMATE algorithm was utilized to calculate the immune /stromal scores based on RNA-seq version 2 data that was quantified through RNA-seq using the Expectation Maximization (RSEM).[10] In order to identify the DEGs in the PAAD microenvironment, patients were categorized in low or high immune/ stromal scores groups based on the median immune/ stromal score. Patients with a survival time >30 days were included in further survival analysis. A total of 171 patients with survival information were enrolled as a primary cohort, where 86 patients were randomized to the validation cohort using a random number sequence. This study was approved by the Institutional Medical Ethics Committee of the First Affiliated Hospital of Guangxi Medical University.
2.2. Detection of DEGs
The R package LIMMA was used to identify DEGs.[16] Fold change (FC) > 2 and adj. P < .05 were set as the cutoffs.
2.3. Identification and validation of the prognosis index model
Univariate Cox regression survival analysis was performed to assess whether DEGs correlated with the survival of PAAD patients. Then, statistically significant DEGs (P < .05) were used in the construction of the PI model. Furthermore, the multivariate Cox regression analysis was conducted for PI model component genes to evaluate the prognostic value of the DEGs in PAAD patients. PI was calculated using the following formula: (xi indicates the expression value of corresponding gene and βi refers to the coefficient). To validate the prognostic effect of the PI model, the coefficients of the component genes of the PI model in the primary cohort were utilized to evaluate the PI value of the validation cohort. The median PI value was utilized as the cutoff to determine the high/low-risk groups in the primary and validation cohorts. To access the efficiency of the PI model, a time-dependent receiver operating curve (tROC) and area under the curve (AUC) value were determined using the survival ROC package (version 1.0.3) in R (version 3.3.0). The Kaplan-Meier analysis was next performed to assess the overall survival of the primary and validation cohorts.
2.4. Investigation of the immunological feature of the PI model
Tumor Immune Estimation Resource (TIMER) database (https://cistrome.shinyapps.io/timer/), is an online open platform that integrates the gene expression profiles of over 10,000 samples across 32 cancer types from the TCGA. The TIMER calculates the abundance of the tumor-infiltrating immune cells (TIICs) with a deconvolution algorithm,[17,18] that enables investigators to explore and visualize the immunological feature of genes using correlation analysis between the level of gene expression and TIICs.[17] TIICs consisted of 6 types of cells including: B cells, CD4+ T cells, CD8+ T cells, neutrophils, macrophages, and dendritic cells. The correlation between TIICs and DEGs of the PI model were calculated from the TIMER database. Similarly, the correlation analysis between tumor purity and DEGs of the PI model was performed using the TIMER platform.
2.5. GO and KEGG clustering analysis of DEGs
TDEGs were transferred to the annotated portal of DAVID 6.7 (https://david-d.ncifcrf.gov/). Based on the DAVID 6.7 database, an enrichment annotation of the gene ontology (GO) and the Kyoto Encyclopedia of Genes and Genomes (KEGG) was conducted. The statistically significant GO and KEGG terms (P < .05) were selected.
2.6. Identification of expression of the signature genes in PI model
Gene Expression Profiling Interactive Analysis (GEPIA) is an online open platform which integrates the RNA-seq data from the Genotype-Tissue Expression (GTEx) project and TCGA database, delivering customizable functionalities including profiling plotting, differential expression analysis and so on.[19] Thus, we applied the GEPIA to compare the signature genes expression of PI model in PAAD and normal pancreatic tissues. FC > 1.5 and P < .05 were set as the cutoffs.
2.7. Detection of protein expression of the signature genes in the PI model
The protein expression of the signature genes in the PI model was identified using the human protein atlas database, which is an interactive open-access database providing numerous antibody-based images of tumor and healthy tissues.[20]
2.8. Statistical analysis
The analysis of variance (ANOVA) method was perforemed to compare immune/stromal scores between the subtype groups. The Mann-Whitney U test was applied to identify the difference in the immune/stromal score between the early and the advanced TNM stage. ANOVA, Mann-Whitney U test, Kaplan–Meier analysis and the log-rank test were conducted using GraphPad Prism (GraphPad Prism 7.04, Inc., La Jolla, CA). Multivariate Cox regression survival analysis and generating random number sequence were carried out using SPSS (Version 24, SPSS Inc. Chicago). The DEGs of the RNA-seq data (TPM) were identified using the R package “LIMMA”. Univariate Cox regression survival analysis was performed with the R package “Survival”. tROC curve and AUC value were generated using the survival ROC package in R (version 3.3.0). In the current study. A P-value of < .05 was considered as statistically significant.
3. Results
3.1. Correlation between stromal and immune scores clinical parameters
The RNA-seq and clinical data of all the 178 PAAD patients were downloaded from the TCGA database. Amongst them, 80 (44.9%) patients were female, while the rest 98 (55.1%) were male. The patients were divided into 5 subtypes on the basis of their pathological diagnosis - 147 (82.58%) pancreas-adenocarcinoma ductal type (PDAC), 4 (2.25%) pancreas-colloid (mucinous non-cystic) carcinoma (PCC), 25 (14.04%) other subtype, 1 (0.56%) case discrepancy, and 1 (0.56%) Pancreas-Undifferentiated Carcinoma. Subtype groups with more than 3 cases were included in our analysis. On the basis of the ESTIMATE algorithm, the stromal and/or immune scores were negatively associated with tumor purity. The immune scores were distributed between -1559.87 and 3037.78, respectively. As shown in Figure 1A, average immune scores arranged from the highest to the lowest as follows: pancreas-adenocarcinoma ductal type > pancreas-colloid (mucinous non-cystic) carcinoma > other subtype. Similarly, average stromal scores of the pancreas-adenocarcinoma ductal type were the highest of all the 3 subtypes, followed by pancreas-colloid (mucinous non-cystic) carcinoma, and other subtype (Fig. 1B), which indicated that both immune and stromal scores were significantly correlated with subtype classification. In addition, a Mann-Whitney U test revealed that the immune score was significantly increased in advanced TNM stage (stage IIA, stage IIB, stage III, and stage IV) compared to early TNM stage (stage I, stage IA and stage IB) (P = .0367, Fig. 1C), indicating that high immune infiltration was closely correlated with the advanced tumor stage of PAAD. Consistently, a higher stromal score was related to an advanced TNM stage (P = .1536, Fig. 1D), although no statistically significant differences were noted.
Figure 1.
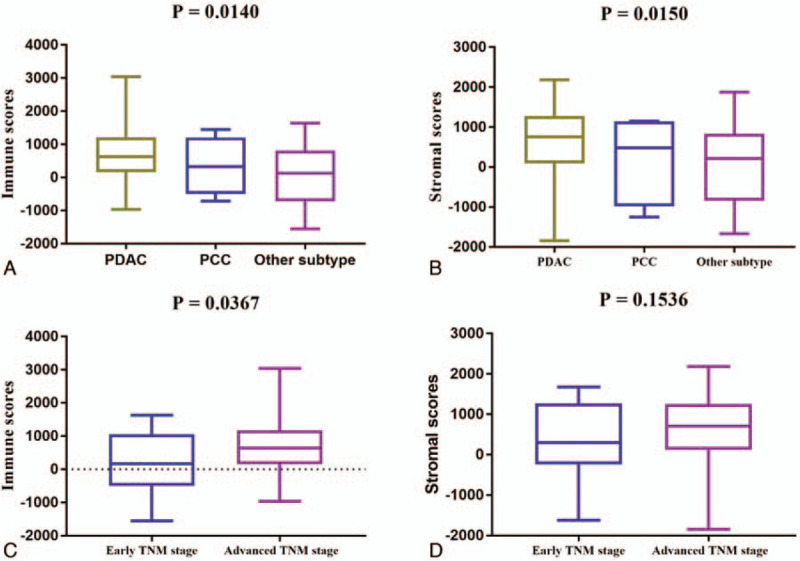
Immune and stromal scores correlate with PAAD subtypes and TNM stage. A. Distribution of immune scores for the PAAD subtypes. The boxplot graph shows a significant correlation between PAAD subtypes and immune scores (n = 176, P = .014). B. Distribution of stromal scores for the PAAD subtypes. The boxplot graph reveals a significant difference between PAAD subtypes and stromal scores (n = 176, P = .015). C. Distribution of the immune scores for early and advanced TNM stages for PAAD cases. The boxplot graph indicates a significantly higher immune score in advanced TNM stages (stage IIA, stage IIB, stage III, and stage IV) compared to early TNM stages (stage I, stage IA and stage IB) (n = 175, P = .0367). D. The boxplot graph shows no significant differences between TNM stage and stromal scores (n = 175, P = .1536).
3.2. Comparison of gene expression profile
To explore the relationship of overall gene expression profiles for immune/stromal scores, cases were divided into 2 groups (high and low score group) on the basis of their stromal and/or immune score. For the group of immune score, 1388 genes were up-regulated, and 35 genes were down-regulated in the high score group compared to the low score. Similarly, a total of 1925 genes expressions were increased, and 89 genes expressions were decreased in the high stromal score group compared to the low stromal score group. The heatmaps showed that the top 100 differential gene expression profiles of cases belong to the mmune score group (FC >2, P < .05, Fig. 2A) and stromal score group (FC >2, P < .05, Fig. 2B). Furthermore, Venn diagrams in Figure 3 revealed 1245 genes commonly up-regulated in the high scores groups and 21 genes that were commonly down-regulated. As the overlapping DEGs between the groups accounted for the majority of the DEGs in the high scores groups, these were further analyzed.
Figure 2.
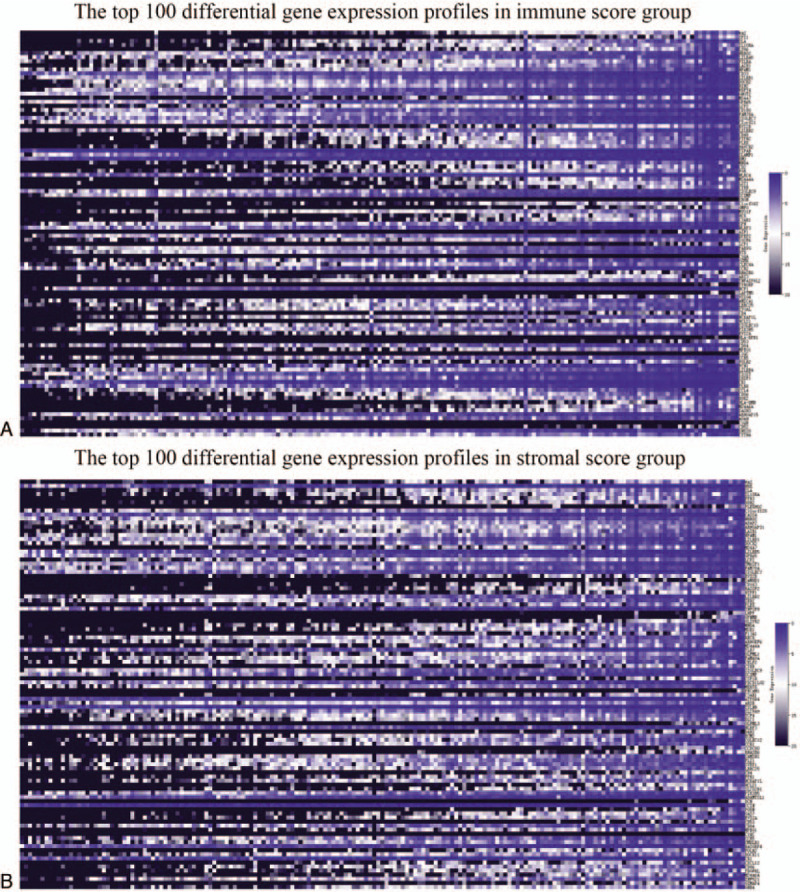
Comparison of the gene expression profile. A. A Heatmap displaying immune scores of the top 100 DEGs identified in the high score vs. low score groups (P < .05, fold change >2). B. A Heatmap displaying stromal scores of the top 100 DEGs in the high score vs. low score groups (P < .05, fold change >2).
Figure 3.
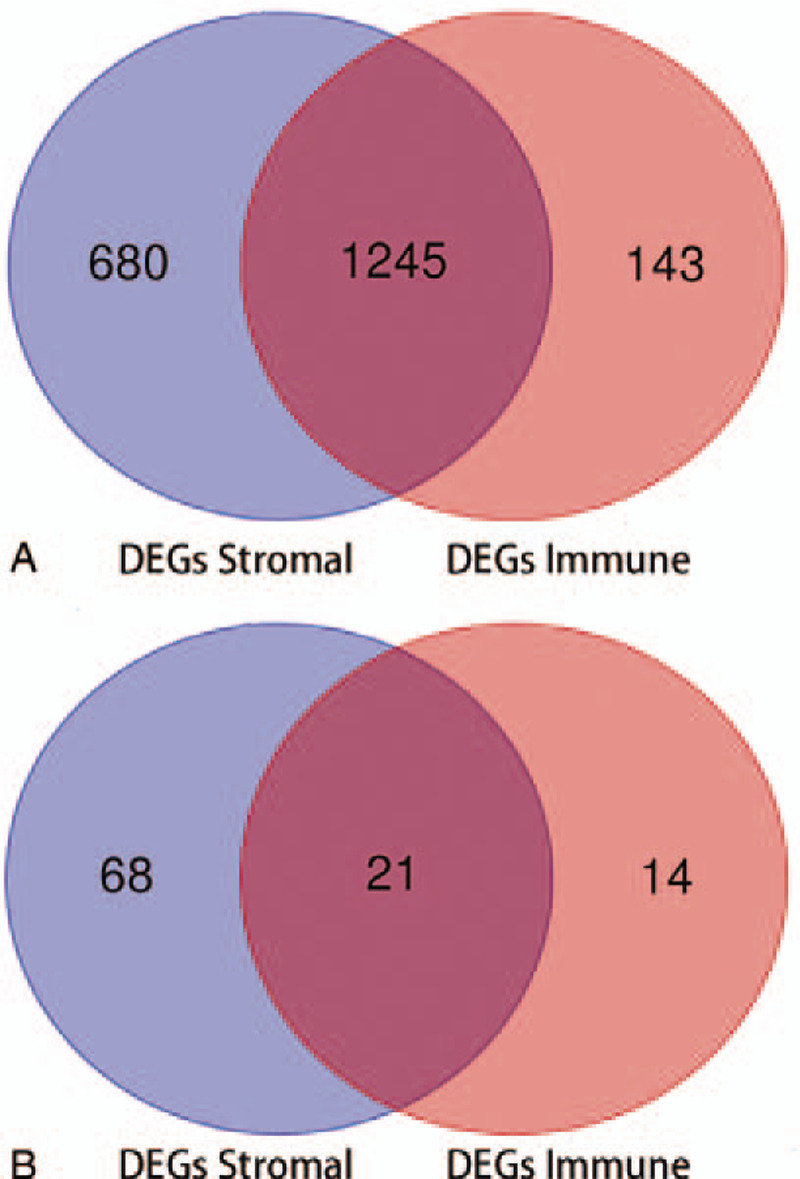
Overlapping DEGs for the high immune and stromal scores groups. A. Venn diagrams show that 1245 DEGs are up-regulated in the stromal and immune score groups. B. Venn diagrams show the 21 DEGs were down-regulated in the stromal and immune score groups.
3.3. Enrichment analysis of overlapping DEGs
To identify underlying function of overlapping DEGs, GO and KEGG analyses were carried out. The GO annotation verified that 403, 44 and 93 terms were significantly clustered (P < .05) by DEGs for biological processes (BPs), cellular components (CCs) and molecular functions (MFs), respectively, and the KEGG analysis demonstrated that 28 significant pathways were involved. The top 10 enriched GO terms and KEGG pathways were shown in Figure 4. The top three BP terms were immune response, defense response and inflammatory response. The top three CC terms are plasma membrane, integral to plasma membrane, and intrinsic to plasma membrane. For MF terms, cytokine binding, carbohydrate binding, and sugar binding were the three most significant terms. Moreover, the three most significant KEGG pathways included the cytokine-cytokine receptor interaction, hematopoietic cell lineage and cell adhesion molecules (CAMs).
Figure 4.
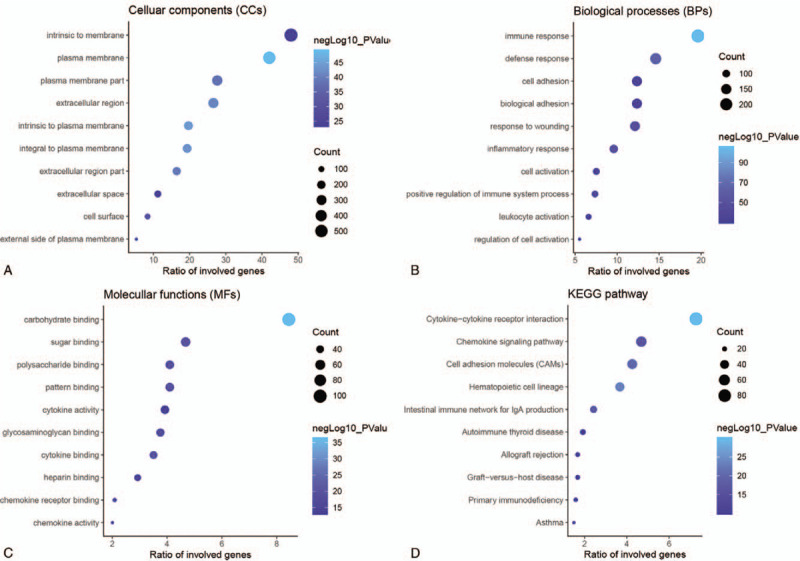
Enrichment analysis of overlapping DEGs. A. The top 10 significant cellular component terms. B. The top 10 significant biological process terms. C. The top 10 significant molecular function terms. D. The top 10 significant KEGG pathways (P < .05).
3.4. Identification and validation of the PI model
To investigate the prognostic value of the DEGs, a PI model of PAAD patients was constructed via univariate and multivariate Cox regression survival analysis of the TCGA database. Among 1245 overlapping up-regulated DEGs, a total of 49 DEGs were significantly correlated with overall survival of the PAAD patients (P < .05), based on the univariate Cox regression survival analysis (Table 1). Furthermore, multivariate Cox regression survival analysis revealed that 7 (GBP5, BICC1, SLC7A14, CYSLTR1, P2RY6, VENTX, and RAB39B) out of 49 DEGs were independent prognostic factors for overall survival and were selected as components of PI model (Table 2). Most of these genes are closely associated with the immune response or the systemic autoimmune diseases.[21–23] To promote the practicality of the PI model in clinical practice, the following formula was used to generate the PI value for each patient: PI = (0.031x expressionGBP5)+(0.020x expressionBICC1) + (0.121x expressionSLC7A14) + (0.052x expressionCYSLTR1) + (0.078x expressionP2RY6) + (−0.449x expressionVENTX) + (−0.322x expressionRAB39B). Thus, the patients were classified as low-risk or high-risk based on the median PI value as the cut-off point in primary and validation cohorts. The predicting ability of this PI model was estimated with the tROC curve. As displayed by the tROC curve in Figure 5A, the model demonstrated the high efficacy in assessing the survival outcome of PAAD patients with an AUC value of 0.791. Kaplan-Meier survival analysis suggests that the prognosis of PAAD patients in the high-risk group was significantly worse compared to the low-risk group both in the primary and validation cohorts ([P < .001 (Fig. 5B) and P = .0028 (Fig. 5C), respectively].
Table 1.
Univariate Cox regression analysis of 49 DEGs in the TCGA cohort of PAAD cases.
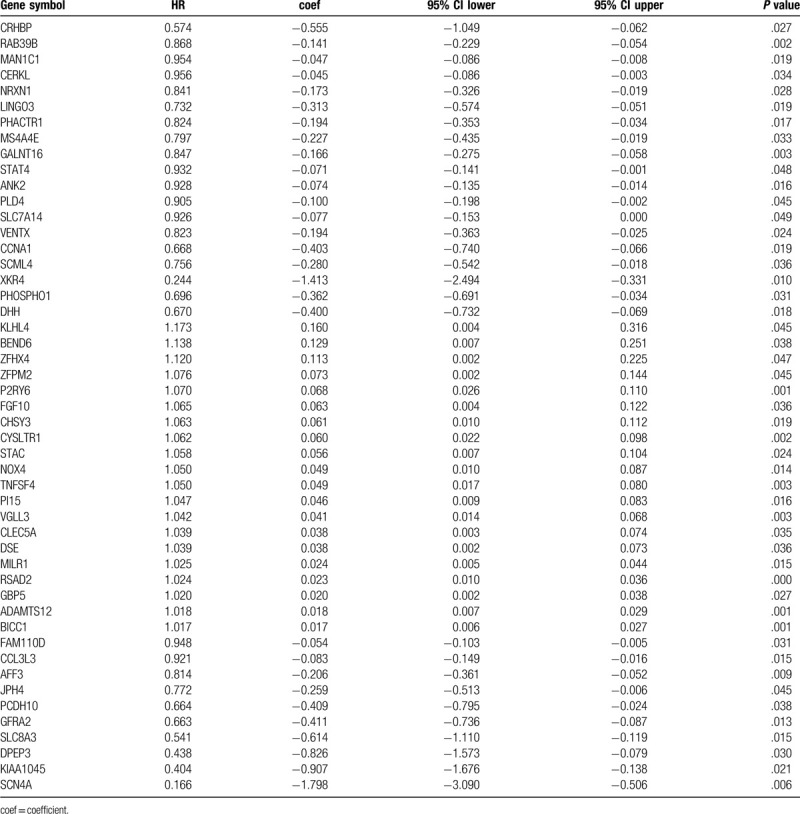
Table 2.
Components of prognostic index model.
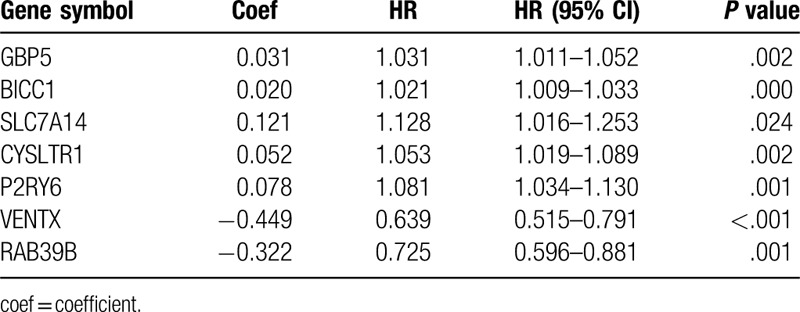
Figure 5.

tROC curves and Kaplan-Meier survival curves of the PI model. A. tROC curve for the PI model (AUC = 0.791). B. Kaplan-Meier survival curve of the primary cohort (P < .001). C. Kaplan-Meier survival curve of the validation cohort (P = .0028).
3.5. Immunological features of the PI model
Given the increasing correlation between the immunological characteristics of the tumor microenvironment and survival outcome in cancer cases, we further explored the association between the abundance of TIICs and gene signatures of the PI model obtained from the tumor microenvironment of PAAD using the TIMER database. As shown in Figure 6, the expression levels of GBP5 (cor = −0.25, P = 9.54 × 10⁻⁴), BICC1 (cor = −0.29, P = 1.14 × 10⁻⁴), CYSLTR1 (cor = −0.259, P = 6.02 × 10⁻⁴), and P2RY6 (cor = −0.183, P = 1.63 × 10⁻²) were significantly and negatively correlated with tumor purity, The expression levels of SLC7A14 (cor = −0.091 P = 2.36 × 10⁻¹), VENTX (cor = −0.08, P = 2.99 × 10⁻¹) and RAB39B (cor = −0.122, P = 1.11 × 10⁻¹) exhibited slight trends towards a negative correlation with tumor purity, although this trend was not statistically significant. The expression level of the GBP5 showed a significant positive correlation with all TIICs including B cells (partial.cor = 0.397, P = 7.84 × 10⁻⁸), CD8+ T cells (partial.cor = 0.396, P = 8.14 × 10⁻⁸), CD4+ T cells (partial.cor = 0.274, P = 3.18 × 10⁻⁴), macrophages (partial.cor = 0.451, P = 6.08 × 10⁻¹⁰), neutrophils (partial.cor = 0.584, P = 4.77 × 10⁻¹⁷) and dendritic cells (partial.cor = 0.676, P = 3.83 × 10⁻²⁴) (Fig. 6A). The expression levels of BICC1 were significantly positively correlated with B cells (partial. cor = 0.17, P = 2.59 × 10⁻²), CD8+ T cells (partial.cor = 0.47, P = 8.40 × 10⁻¹¹), macrophages (partial.cor = 0.478, P = 3.69 × 10⁻¹¹), neutrophils (partial.cor = 0.465, P = 1.55 × 10⁻¹⁰) and dendritic cells (partial.cor = 0.438, P = 2.02 × 10⁻⁹), while the association between BICC1 expression and CD4+ T cells was not statistically significant (partial.cor = 0.031, P = 6.85 × 10⁻¹) (Fig. 6B). For SLC7A14, there was a positive correlation with CD8+ T cells (partial.cor = 0.166, P = 3.01 × 10⁻²), CD4+ T cells (partial.cor = 0.206, P = 7.16 × 10⁻³) and macrophages (partial.cor = 0.318, P = 2.25 × 10⁻⁵), but there was not a statistically significant correlation with B cells (partial.cor = 0.033, P = 6.64 × 10⁻¹), neutrophils (partial.cor = 0.061, P = 4.31 × 10⁻¹) and dendritic cells (partial.cor = 0.102, P = 1.83 × 10⁻¹) (Fig. 6C). CYSLTR1 exhibited a positive correlation with the B cells, CD8+ T cells, CD4+ T cells, macrophages, neutrophils and dendritic cells with P = 9.12 × 10⁻⁹ (partial.cor = 0.422), P = 1.67 × 10⁻¹⁰ (partial.cor = 0.464), P = 3.75 × 10⁻⁴ (partial.cor = 0.271), P = 6.21 × 10⁻¹² (partial.cor = 0.495), P = 6.07 × 10⁻¹³ (partial.cor = 0.515), and P = 1.96 × 10⁻¹⁷ (partial.cor = 0.59), respectively (Fig. 6D). P2RY6 was positively associated with CD4+ T cells (partial.cor = 0.337, P = 7.52 × 10⁻⁶), neutrophils (partial.cor = 0.319, P = 2.16 × 10⁻⁵) and dendritic cells (partial.cor = 0.326, P = 1.38 × 10⁻⁵), while there was no significant correlations for B cells, CD8+ T cells and macrophages (P > .05, Fig. 6E). Figure 6F showed that VENTX is positively associated with CD4+ T cells (partial.cor = 0.535, P = 6.34 × 10⁻¹⁴), macrophages (partial.cor = 0.234, P = 2.08 × 10⁻³), neutrophils (partial.cor = 0.311, P = 3.54 × 10⁻⁵) and dendritic cells (partial.cor = 0.197, P = 9.71 × 10⁻³), while there was no significant correlation with B or CD8+ T cells (P > .05). Figure 6G demonstrate a significant positive correlation between RAB39B and B cells (partial.cor = 0.16, P = 3.71 × 10⁻²), CD8+ T cells (partial.cor = 0.163, P = 3.29 × 10⁻²), CD4+ T cells (partial.cor = 0.344, P = 4.57 × 10⁻⁶), macrophages (partial.cor = 0.364, P = 9.79 × 10⁻⁷), neutrophils (partial.cor = 0.162, P = 3.42 × 10⁻²) and dendritic cells (partial.cor = 0.203, P = 7.64 × 10⁻³).
Figure 6.
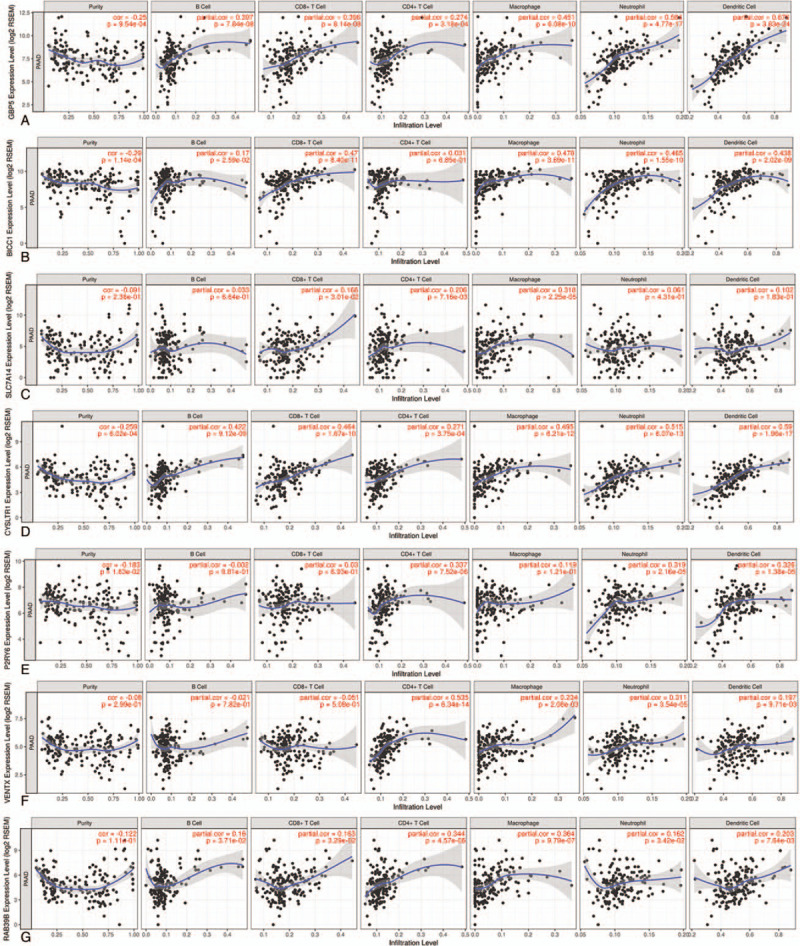
Immunological features of the PI model. A. The correlation between GBP5 and tumor purity/TIICs (B cells, CD8+ T cells, CD4+ T cells, macrophages, neutrophils and dendritic cells). B. The correlation between BICC1 and tumor purity/TIICs. C. The correlation between SLC7A14 and tumor purity/TIICs. D. The correlation between CYSLTR1 and tumor purity/TIICs. E. The correlation between P2RY6 and tumor purity/TIICs. F. The correlation between VENTX and tumor purity/TIICs. G. The correlation between RAB39B and tumor purity/TIICs.
3.6. Enrichment analysis of prognosis-related genes
The enrichment analysis of these genes also described a relationship with the immune response. The significant GO terms of the BPs and the CCs includes the defense response, inflammatory response, response to wounding, calcium ion transport and plasma membrane part (Fig. 7).
Figure 7.
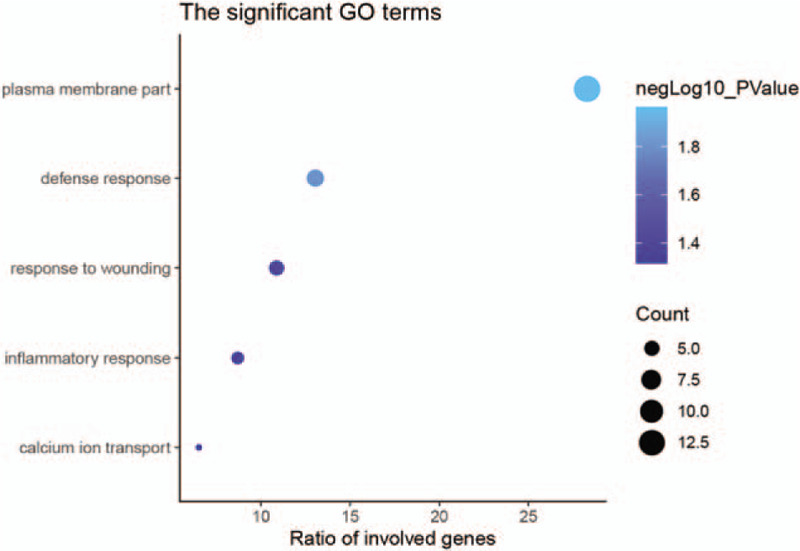
GO enrichment analysis. The significant GO terms for prognosis-related genes (P < .001).
3.7. Gene expression of the PI model
As shown in the boxplot graphs of Figure 8, 4 of the 7 signature genes (GBP5, BICC1, CYSLTR1 and P2RY6) were significantly up-regulated in 179 PAAD tissues compared to 171 normal tissues based on the GEPIA (FC > 1.5, P < .05).
Figure 8.
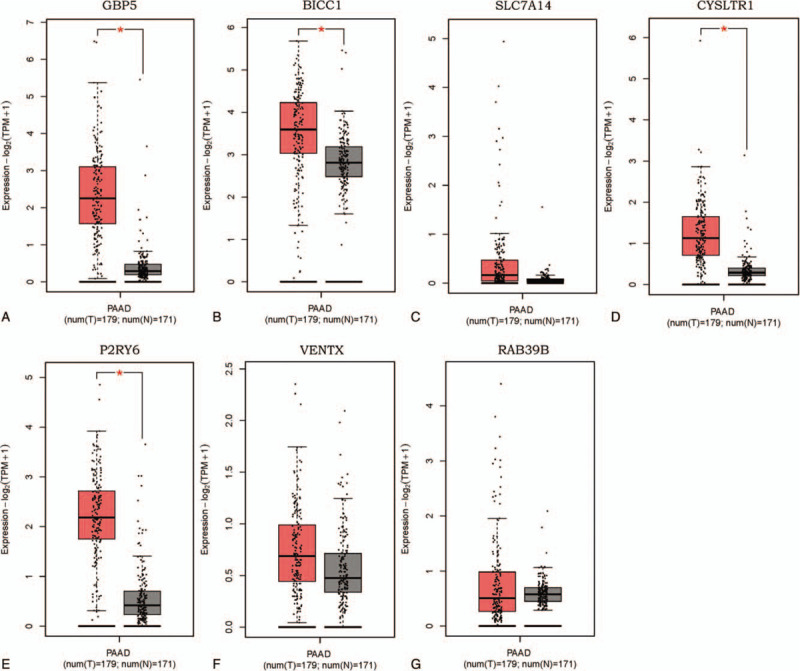
Expression of the genes in prognostic index model from GEPIA database (179 PAAD tissues and 171 normal pancreatic tissues). A. GBP5 was significantly up-regulated in PAAD compared with in normal tissues (FC > 1.5, P < .05). B. BICC1 was significantly up-regulated in PAAD tissues compared with in normal tissues (FC > 1.5, P < .05). C. The expression of SLC7A14 did not differ between PAAD and normal tissues. D. CYSLTR1 was significantly up-regulated in PAAD tissues compared with in normal tissues (FC > 1.5, P < .05). E. P2RY6 was significantly up-regulated in PAAD tissues compared with in normal tissues (FC > 1.5, P < .05). F. The expression of VENTX did not differ between PAAD and normal tissues. G. The expression of RAB39B did not differ between PAAD and normal tissues.
3.8. Protein expression of the PI model
The protein expression of the 7 genes (GBP5, BICC1, SLC7A14, CYSLTR1, P2RY6, VENTX, and RAB39B) were obtained from the human protein atlas database. Only the protein expression of GBP5 (antibody, HPA028656), SLC7A14 (antibody, HPA045929), CYSLTR1 (antibody, HPA010546), P2RY6 (antibody, CAB022740), VENTX (antibody, HPA050955), and RAB39B (antibody, HPA001114) were available in this database. The protein expression of GBP5, CYSLTR1 and VENTX seemed to be up-regulated in PAAD tissue compared to normal tissue. GBP5 had a medium antibody staining in PAAD, while it was deficient in normal pancreatic tissue (Fig. 9A and B). The staining of both CYSLTR1 and VENTX was medium in PAAD; however, the staining of them was low in normal pancreatic tissue (Fig. 9E, F, I, and J). The protein expression of SLC7A14 was deficient in both PAAD and normal pancreatic tissue (Fig. 9C, D). P2RY6 and RAB39B exhibited medium staining in both PAAD and normal pancreatic tissue (Fig. 9G, H, K, and L). Because of the small samples in the human protein atlas database, larger samples will be required to verify these findings in the future.
Figure 9.
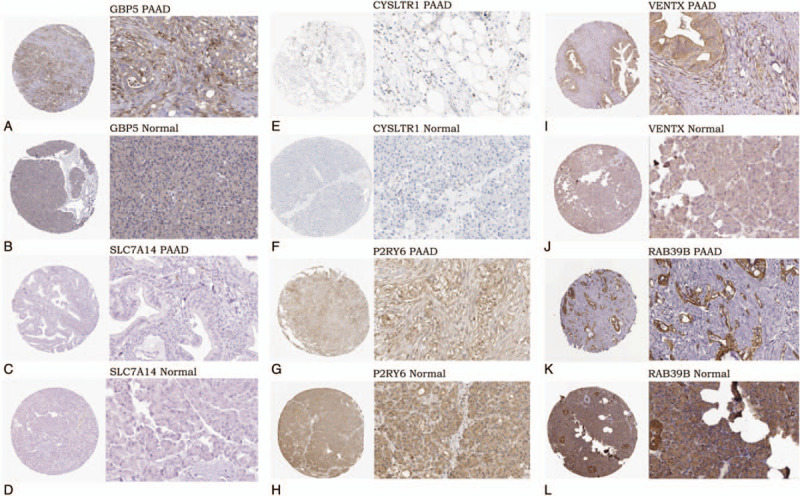
Protein expression of the genes in prognostic index model from the human protein atlas (magnification, x40 or x400). A. Medium staining of GBP5 in PAAD (antibody, HPA028656). B. Expression deficiency of GBP5 in normal pancreatic tissue (antibody, HPA028656). C. Expression deficiency of SLC7A14 in PAAD (antibody, HPA045929). D. Expression deficiency of SLC7A14 in normal pancreatic tissue (antibody, HPA045929). E. Medium staining of CYSLTR1 in PAAD (antibody, HPA010546). F. Low staining of CYSLTR1 in normal pancreatic tissue (antibody, HPA010546). G. Medium staining of P2RY6 in PAAD (antibody, CAB022740). H. Medium staining of P2RY6 in normal pancreatic tissue (antibody, CAB022740). I. Medium staining of VENTX in PAAD (antibody, HPA050955). J. Low staining of VENTX in normal pancreatic tissue (antibody, HPA050955). K. Medium staining of RAB39B in PAAD (antibody, HPA001114), L. Medium staining of RAB39B in normal pancreatic tissue (antibody, HPA001114).
4. Discussion
PAAD is a highly malignant cancer. Its high degree of malignancy, limitations in diagnosis and treatment led to the high mortality rates. Therefore, further work is urgently needed to find out more potential predictive biomarkers and novel therapeutic targets. In this study, we emphasize the genetic features of the tumor microenvironment, which may function in the development of PAAD and in turn influence patient overall survival. Our work might provide new insights into the biological interpretation of PAAD and its microenvironment, thereby offering additional potential targets to predict clinical outcomes of the PAAD patients.
First, a total of 1245 DEGs were ifound up-regulated in both high immune and high stromal scores groups. Meanwhile, we observed that these DEGs were up-regulated in the PAAD microenvironment. In order to explore the potential role of these genes in the tumor microenvironment, enrichment analysis was carried out. Most of these DEGs were closely correlated with the tumor microenvironment, as visualized by the GO and the KEGG analysis (Fig. 4). The 3 most statistically significant items of BPs included immune response, defense response and inflammatory response. In respect to CCs, the top three statistically significant terms were the plasma membrane, intrinsic to plasma membrane, and integral to plasma membrane. For MFs, DEGs were most closely enriched to carbohydrate binding, cytokine binding and sugar binding. In addition, the KEGG analysis revealed that these DEGs were significantly enriched in numerous immune-related pathways such as the intestinal immune network for IgA production, CAMs and cytokine-cytokine receptor interaction. Most of these biological process or pathways affects the tumor microenvironment, which in turn influences the development and progression of PAAD.[24–27]
Next, univariate and multivariate Cox regression survival analysis was conducted for 1245 genes. A total of 49 genes correlated with worse overall survival in PAAD patients and amongst these, 7 genes (GBP5, BICC1, SLC7A14, CYSLTR1, P2RY6, VENTX, and RAB39B) were considered as components of the PI model that would undergo multivariate Cox regression survival analysis. The PI model effectively distinguished the high-risk patients both in the primary and validation cohorts (P < .001, P = .0028, respectively).
Recently, more researchers is focusing on the association between PAAD and its microenvironment. A number of studies have shown that inflammation triggered infiltration of immune cells in the PAAD microenvironment was closely associated with pancreatic cancer cells growth, metastasis and poor clinical outcomes.[24,28,29] In this study, we found that a greater immune score was significantly correlated with advanced TNM stage (stage IIA, stage IIB, stage III, and stage IV) (P = .0367), which indicate that interactions of the surrounding microenvironment play an important role in the development and progression of PAAD.
Bioinformatic analysis of prognosis-associated genes in PAAD is a highlight of this study. The most important clinical value of this study was the development and validation of a 7-gene signature PI model predicting efficacy for accessing the prognosis of the PAAD patients (AUC = 0.791). Previously, other work constructed prognostic models for PAAD using other genomic signatures. The AUC values of a 3 hypomethylated gene signature proposed by Chen et al, and a 5 key lncRNAs prognostic model established by Song et al., achieved 0.69 and 0.742, respectively.[30,31] Wu et al. developed a 3-lncRNA signature from which 1 signature associates with tumor immune responses for survival prediction in PAAD (AUC = 0.742).[32] In this study, the AUC value of the 7-gene signature PI model was greater than observed in previous prognostic models,[30–32] which indicated that the 7-gene signature PI model achieved more efficient prognostic performance than the 3 previous prognostic models. On the other hand, several novel immune correlated signatures in the PI model were also observed, which might provide potential therapeutic targets contributing to immunity therapy. Several genes in our prognostic model have also been identified as immune correlated genes critically affecting tumor evolution. For example, GBP5 (guanylate-binding protein 5) is a member of the TRAFAC class dynamin-like GTPase superfamily. The protein encoded by this gene serves as an activator of the NLRP3 inflammasome assembly and play a critical role in innate immunity inflammation and macrophage activation.[21,33,34] Recently, Qian et al. reported that GBP5 might contribute to anti-PD-1/PD-L1 therapy in glioma by acting as an IFN-γ-induced gene in the tumor microenvironment.[35] Additionally, the immune modulator GBP5 was up-regulated in gastric adenocarcinoma, hinting an important role in tumor pathobiology.[36] Moreover, increased expression of CYSLTR1 (cysteinyl leukotriene receptor 1) was responsible for the production of leukotrienes (a type inflammatory eicosanoid) which play an important role in the development of various cancer and indicate poor survival of colorectal and breast cancer patients.[37–39] VENTX encoding a member of the Vent family of homeobox protein, affects the differentiation and proliferation of human immune cells and multipotent progenitor cells.[40,41] Le et al. demonstrated that VENTX regulates the tumor microenvironment in colon cancer tumorigenesis in a mouse model.[42] The roles of the remaining 4 genes (BICC1, SLC7A14, P2RY6, and RAB39B) were not yet reported in the tumor microenvironment. We are the first to report that these genes might be involved in the evolution of PAAD and act as independent factors influencing the prognosis of the PAAD patients. On 1 hand, GO and KEGG enrichment analysis revealed that 2 genes (GBP5 and CYSLTR1) were involved in immune-related biological processes such as the immune response, inflammatory response, defense response, and response to wounding. On the other hand, univariate and multivariate Cox regression analysis revealed that these were independent prognostic factors for PAAD patients. Thus, we infer that GBP5 and CYSLTR1 might have an impact on tumor immunity, thus affecting the prognosis of PAAD patients, which might provide novel immune-related targets.
The rapid development of cancer immunotherapy makes it necessary to understand the relationship between the tumor and host immune system. However, there are major computational and experimental challenges that need to be overcome to understand interactions of the tumor-immune system. Fortunately, TIMER provided a user-friendly web interface that allowed researchers to explore the associations between the immune infiltration and gene expression.[17] The immunological feature of each gene in the TIMER database was validated through many different ways, such as a comparison with silico simulation, orthogonal inferences and a pathological method.[18] Therefore, in this study, the immunological features of gene signatures involved in the PI model were revealed using the TIMER database. Correlation analysis reveal that GBP5, BICC1, CYSLTR1, and P2RY6 were negative correlated with the tumor purity, and the expression level of SLC7A14, VENTX and RAB39B exhibited a slight, negative correlation with tumor purity, which indicated that the 7 gene signatures of the PI model were closely associated with the PAAD microenvironment. The 7 genes were positively correlated with several types of TIICs. Both GBP5 and RAB39B were significantly associated with all types of TIICs including B cells, CD4+ T cells, CD8+ T cells, neutrophils, macrophages and dendritic cells. SLC7A14 and BICC1 were most significant associated with macrophages in 6 types of TIICs. CYSLTR1 exhibited the most significantly positive correlation with dendritic cells. Both P2RY6 and VENTX were significantly associated with a greater number of CD4+ T cells. Nevertheless, further research is needed to better understand the immunological features of the PAAD microenvironment.
Although survival-related genes and a 7-mRNA signature PI model were identified and generated from the PAAD microenvironment in this study, several limitations still exist. First, even with strict standards, information bias was still likely. Second, some of the cohorts utilized showed small sample sizes for critical clinical parameters like survival time and tumor stage. Furthermore, multi-centered validation is still required before the model can be applied to clinical practice. Finally, more evidence concerning the interaction between immune-related genes and the PAAD microenvironment is needed to be confirmed using both in vivo and in vitro studies.
This study identified a list of the tumor microenvironment-associated genes. Many of these genes might be closely correlated with clinical outcomes of PAAD patients, which could likely become novel biomarkers for PAAD. Additionally, a novel 7-mRNA signature PI model was identified and validated, which has the ability to predict prognosis. Furthermore, additional studies of these genes might be helpful in the comprehension between the tumor microenvironment and the PAAD prognosis.
5. Conclusion
In conclusion, a list of the prognosis-correlated genes was generated from the microenvironment of the PAAD and a 7-mRNA PI model may be utilized to predict the prognosis of PAAD patients.
Author contributions
Conceptualization: Shan-yu Qin
Data curation: Qing-lin He, Xiang-lian Zhang
Formal analysis: Qing-lin He, Xiang-lian Zhang
Funding acquisition: Shan-yu Qin, Hai-xing Jiang
Investigation: Qing-lin He, Shan-yu Qin
Methodology: Qing-lin He, Hai-xing Jiang
Project administration: Qing-lin He, Shan-yu Qin
Resources: Hai-xing Jiang, Shan-yu Qin
Software: Qing-lin He, Xiang-lian Zhang
Supervision: Shan-yu Qin
Validation: Xiang-lian Zhang
Visualization: Qing-lin He
Writing – original draft: Qing-lin He
Writing – review & editing: Hai-xing Jiang, Shan-yu Qin
Footnotes
Abbreviations: AUC = area under the curve, DEGs = differentially expressed genes, ESTIMATE = estimation of stromal and immune cells in malignant tumours using expression data, PAAD = pancreatic adenocarcinoma, PI = prognostic index, TCGA = the cancer genome atlas, tROC = time-dependent receiver operating curve.
How to cite this article: He Ql, Jiang Hx, Zhang Xl, Qin Sy. Relationship between a 7-mRNA signature of the pancreatic adenocarcinoma microenvironment and patient prognosis (a STROBE-compliant article). Medicine. 2020;99:29(e21287).
This study was supported by the research grants funded by the Scientific Research Projects of Guangxi Health and Family Planning Commission (grant number: Z2016322 and S2017024, respectively), Guangxi Medical High-level Key Talents “139” Training Program (grant number: G201903004) and National Natural Science Foundation of China (grant number: 81960439).
The authors have no conflicts of interest to disclose.
The datasets generated during and/or analyzed during the current study are available from the corresponding author on reasonable request.
References
- [1].Bray F, Ferlay J, Soerjomataram I, et al. Global cancer statistics 2018: GLOBOCAN estimates of incidence and mortality worldwide for 36 cancers in 185 countries. CA: a cancer journal for clinicians 2018;68:394–424. [DOI] [PubMed] [Google Scholar]
- [2].Ottenhof NA, Milne AN, Morsink FH, et al. Pancreatic intraepithelial neoplasia and pancreatic tumorigenesis: of mice and men. Arch Pathol Lab Med 2009;133:375–81. [DOI] [PubMed] [Google Scholar]
- [3].Hu D, Ansari D, Zhou Q, et al. Low P4HA2 and high PRTN3 expression predicts poor survival in patients with pancreatic cancer. Scand J Gastroenterol 2019;54:1–6. [DOI] [PubMed] [Google Scholar]
- [4].Pelster MS, Amaria RN. Combined targeted therapy and immunotherapy in melanoma: a review of the impact on the tumor microenvironment and outcomes of early clinical trials. Ther Adv Med Oncol 2019;11:1758835919830826. [DOI] [PMC free article] [PubMed] [Google Scholar]
- [5].Hanahan D, Coussens LM. Accessories to the crime: functions of cells recruited to the tumor microenvironment. Cancer cell 2012;21:309–22. [DOI] [PubMed] [Google Scholar]
- [6].Wang X, Luo G, Zhang K, et al. Hypoxic tumor-derived exosomal miR-301a mediates M2 macrophage polarization via PTEN/PI3K ( to promote pancreatic cancer metastasis. Cancer Res 2018;78:4586–98. [DOI] [PubMed] [Google Scholar]
- [7].Ye C, Zheng L, Yuan CH. Pancreatic ductal adenocarcinoma immune microenvironment and immunotherapy prospects. Zhonghua wai ke za zhi [Chinese journal of surgery] 2019;57:10–5. [DOI] [PubMed] [Google Scholar]
- [8].Roma-Rodrigues C, Mendes R, Baptista PV, et al. Targeting tumor microenvironment for cancer therapy. Int J Mol Sci 2019;20:840. [DOI] [PMC free article] [PubMed] [Google Scholar]
- [9].Gao S, Yang D, Fang Y, et al. Engineering nanoparticles for targeted remodeling of the tumor microenvironment to improve cancer immunotherapy. Theranostics 2019;9:126–51. [DOI] [PMC free article] [PubMed] [Google Scholar]
- [10].Yoshihara K, Shahmoradgoli M, Martínez E, et al. Inferring tumour purity and stromal and immune cell admixture from expression data. Nat Commun 2013;4:2612. [DOI] [PMC free article] [PubMed] [Google Scholar]
- [11].Vincent KM, Findlay SD, Postovit LM. Assessing breast cancer cell lines as tumour models by comparison of mRNA expression profiles. Breast Cancer Res 2015;17:114. [DOI] [PMC free article] [PubMed] [Google Scholar]
- [12].Vincent KM, Postovit LM. Investigating the utility of human melanoma cell lines as tumour models. Oncotarget 2017;8:10498–509. [DOI] [PMC free article] [PubMed] [Google Scholar]
- [13].Shah N, Wang P, Wongvipat J, et al. Regulation of the glucocorticoid receptor via a BET-dependent enhancer drives antiandrogen resistance in prostate cancer. Elife 2017;6:e27861. [DOI] [PMC free article] [PubMed] [Google Scholar]
- [14].Alonso MH, Aussó S, Lopez-Doriga A, et al. Comprehensive analysis of copy number aberrations in microsatellite stable colon cancer in view of stromal component. Br J Cancer 2017;117:421–31. [DOI] [PMC free article] [PubMed] [Google Scholar]
- [15].Jia D, Li S, Li D, et al. Mining TCGA database for genes of prognostic value in glioblastoma microenvironment. Aging 2018;10:592–605. [DOI] [PMC free article] [PubMed] [Google Scholar]
- [16].Ritchie ME, Phipson B, Wu D, et al. limma powers differential expression analyses for RNA-sequencing and microarray studies. Nucleic Acids Res 2015;43:e47. [DOI] [PMC free article] [PubMed] [Google Scholar]
- [17].Li T, Fan J, Wang B, et al. TIMER: a web server for comprehensive analysis of tumor-infiltrating immune cells. Cancer Res 2017;77:e108–10. [DOI] [PMC free article] [PubMed] [Google Scholar]
- [18].Bo L, Eric S, Jean-Christophe P, et al. Comprehensive analyses of tumor immunity: implications for cancer immunotherapy. Genome Biol 2016;17:174. [DOI] [PMC free article] [PubMed] [Google Scholar]
- [19].Tang Z, Li C, Kang B, et al. GEPIA: a web server for cancer and normal gene expression profiling and interactive analyses. Nucleic Acids Res 2017;45(W1): [DOI] [PMC free article] [PubMed] [Google Scholar]
- [20].Uhlen M, Zhang C, Lee S, et al. A pathology atlas of the human cancer transcriptome. Science 2017;357: [DOI] [PubMed] [Google Scholar]
- [21].Shenoy AR, Wellington DA, Kumar P, et al. GBP5 promotes NLRP3 inflammasome assembly and immunity in mammals. Science (New York, NY) 2012;336:481–5. [DOI] [PubMed] [Google Scholar]
- [22].Xia W, Wu J, Deng FY, et al. Integrative analysis for identification of shared markers from various functional cells/tissues for rheumatoid arthritis. Immunogenetics 2017;69:77–86. [DOI] [PubMed] [Google Scholar]
- [23].Hamby ME, Coppola G, Ao Y, et al. Inflammatory mediators alter the astrocyte transcriptome and calcium signaling elicited by multiple G-protein-coupled receptors. J Neurosci 2012;32:14489–510. [DOI] [PMC free article] [PubMed] [Google Scholar]
- [24].Padoan A, Plebani M, Basso D. Inflammation and pancreatic cancer: focus on metabolism, cytokines, and immunity. Int J Mol Sci 2019;20: [DOI] [PMC free article] [PubMed] [Google Scholar]
- [25].Wang CJ, Xu RH, Yuan QY, et al. Bioinformatics method to analyze the mechanism of pancreatic cancer disorder. J Comput Biol 2013;20:444–52. [DOI] [PubMed] [Google Scholar]
- [26].Zheng J, Hernandez JM, Doussot A, et al. Extracellular matrix proteins and carcinoembryonic antigen-related cell adhesion molecules characterize pancreatic duct fluid exosomes in patients with pancreatic cancer. HPB (Oxford) 2018;20:597–604. [DOI] [PMC free article] [PubMed] [Google Scholar]
- [27].Gebauer F, Wicklein D, Horst J, et al. Carcinoembryonic antigen-related cell adhesion molecules (CEACAM) 1, 5 and 6 as biomarkers in pancreatic cancer. PloS One 2014;9:e113023. [DOI] [PMC free article] [PubMed] [Google Scholar]
- [28].Lenk L, Pein M, Will O, et al. The hepatic microenvironment essentially determines tumor cell dormancy and metastatic outgrowth of pancreatic ductal adenocarcinoma. Oncoimmunology 2017;7:e1368603. [DOI] [PMC free article] [PubMed] [Google Scholar]
- [29].Arima K, Komohara Y, Bu L, et al. Downregulation of 15-hydroxyprostaglandin dehydrogenase by interleukin-1β from activated macrophages leads to poor prognosis in pancreatic cancer. Cancer Sci 2018;109:462–70. [DOI] [PMC free article] [PubMed] [Google Scholar]
- [30].Chen H, Kong Y, Yao Q, et al. Three hypomethylated genes were associated with poor overall survival in pancreatic cancer patients. Aging 2019;11:885–97. [DOI] [PMC free article] [PubMed] [Google Scholar]
- [31].Song J, Xu Q, Zhang H, et al. Five key lncRNAs considered as prognostic targets for predicting pancreatic ductal adenocarcinoma. J Cell Biochem 2018;119:4559–69. [DOI] [PMC free article] [PubMed] [Google Scholar]
- [32].Wu B, Wang K, Fei J, et al. Novel three-lncRNA signature predicts survival in patients with pancreatic cancer. Oncol Rep 2018;40:3427–37. [DOI] [PMC free article] [PubMed] [Google Scholar]
- [33].Cerqueira DM, Gomes MTR, Silva ALN, et al. Guanylate-binding protein 5 licenses caspase-11 for Gasdermin-D mediated host resistance to Brucella abortus infection. PLoS pathogens 2018;14:e1007519. [DOI] [PMC free article] [PubMed] [Google Scholar]
- [34].Fujiwara Y, Hizukuri Y, Yamashiro K, et al. Guanylate-binding vprotein 5 is a marker of interferon-(-induced classically activated macrophages. Clinical & translational immunology 2016;5:e111. [DOI] [PMC free article] [PubMed] [Google Scholar]
- [35].Qian J, Wang C, Wang B, et al. The IFN-(/PD-L1 axis between T cells and tumor microenvironment: hints for glioma anti-PD-1/PD-L1 therapy. Journal of neuroinflammation 2018;15:290. [DOI] [PMC free article] [PubMed] [Google Scholar]
- [36].Patil PA, Blakely AM, Lombardo KA, et al. Expression of PD-L1, indoleamine 2,3-dioxygenase and the immune microenvironment in gastric adenocarcinoma. Histopathology 2018;73:124–36. [DOI] [PubMed] [Google Scholar]
- [37].Deryusheva IV, Tsyganov M, Garbukov EY, et al. Genome-wide association study of loss of heterozygosity and metastasis-free survival in breast cancer patients. Exp Oncol 2017;39:145–50. [PubMed] [Google Scholar]
- [38].Osman J, Savari S, Chandrashekar NK, et al. Cysteinyl leukotriene receptor 1 facilitates tumorigenesis in a mouse model of colitis-associated colon cancer. Oncotarget 2017;8:34773–86. [DOI] [PMC free article] [PubMed] [Google Scholar]
- [39].Savari S, Chandrashekar NK, Osman J, et al. Cysteinyl leukotriene 1 receptor influences intestinal polyp incidence in a gender-specific manner in the ApcMin/+ mouse model. Carcinogenesis 2016;37:491–9. [DOI] [PubMed] [Google Scholar]
- [40].Gao H, Wu X, Sun Y, et al. Suppression of homeobox transcription factor VentX promotes expansion of human hematopoietic stem/multipotent progenitor cells. J Biol Chem 2012;287:29979–87. [DOI] [PMC free article] [PubMed] [Google Scholar]
- [41].Wu X, Gao H, Bleday R, et al. Homeobox transcription factor VentX regulates differentiation and maturation of human dendritic cells. J Biol Chem 2014;289:14633–43. [DOI] [PMC free article] [PubMed] [Google Scholar]
- [42].Le Y, Gao H, Bleday R, et al. The homeobox protein VentX reverts immune suppression in the tumor microenvironment. Nat Commun 2018;9:2175. [DOI] [PMC free article] [PubMed] [Google Scholar]


