Abstract
The primary objective of the study is to analyse the relationship between COVID-19 and nitrogen dioxide in New York City during the global pandemic. Notably, the study has investigated the direct influence of lockdown circumstances (due to COVID-19) and plunge in the population of New York on its environmental contamination. The study utilized the Non-Linear Autoregressive Distributed Lag (NARDL) model to ascertain the asymmetric impact of COVID-19 on the environmental quality of the USA. The results reveal that lockdown has played a significant role in the environmental quality of the USA. Notably, an escalation in the registered cases of COVID-19 has a meaningful and indirect relationship with environmental pollution in the UAS. Besides, as the lockdown state goes normal, it results in an explosion in the environmental pollution in the USA. Also, deaths due to COVID-19 substantively improve the environmental quality in the short-term period as well as in the long-term period.
Keywords: COVID-19, Climate, Nitrogen dioxide, Air pollution, NARDL
Introduction
The social uptake and mortality from coronavirus have led to aroused public awareness of the anxiety that has been widespread among experts in the field of infectious diseases for decades. Increasing explosions and coercive measures to prevent a new dangerous disease, which could become a pandemic, is becoming the number one problem for the whole world from HIV to swine flu, from SARS to Ebola. According to experts, the haste caused by a new infectious disease is the result of the destruction of human ecological activity. Poaching, deforestation and forest degradation have led to a closed link between wildlife and the urban population (Smith 2020).
The novel coronavirus (COVID-19) crisis is unparalleled because the world has never faced a health crisis that spreads so quickly across countries, destroying complex health systems and jeopardizing the entire economy. But this is not the first and probably not the last pandemic that the world has encountered. Humanity was on the verge of many uncertainties arising from various inexorable viruses. But despite the problem, which could be the Spanish flu in 1918, the HIV/AIDS crisis, West Nile, SARS, swine flu and Ebola, there is much more to learn (Alex Scimecca 2020).
With the increase of coronavirus cases, a comparison with other viruses in history is becoming apparent. Ebola was an extremely deadly disease with a 50% chance of taking the lives of infected people. It predominantly spread through bodily fluids like sweat and blood. Therefore, during the last stages of the disease, it was not as catching as COVID-19. Ebola virus appeared in Guinea during December 2013. It showed an outbreak in March 2014. The disease spread to 10 countries, and it infected 28,652 people before the end of the outbreak. The pandemic resulted in 11,325 deaths at a 50% rate. The most affected groups were children with up to 20% of cases (Ries 2020).
In November 2002, severe acute respiratory syndrome (SARS) appeared in Guangdong, China. The virus separated rapidly through respiratory drops, and it affected 29 countries. The last case was reported in May 2018. This virus affected 8098 people with 15% mortality (774 cases). Studies have shown that the cause of the disease was civet cat, and the virus was transmitted to human (Uras 2020). The coronavirus (Covid-19) expanded throughout the world since its first appearance at the end of last year in China. The World Health Organization has announced a novel coronavirus pandemic. There are 3,939,281 confirmed COVID-19 cases, 274,932 deaths and 1,094,728 patients have been recovered until 9 May 2020 (Gutiérrez 2020).
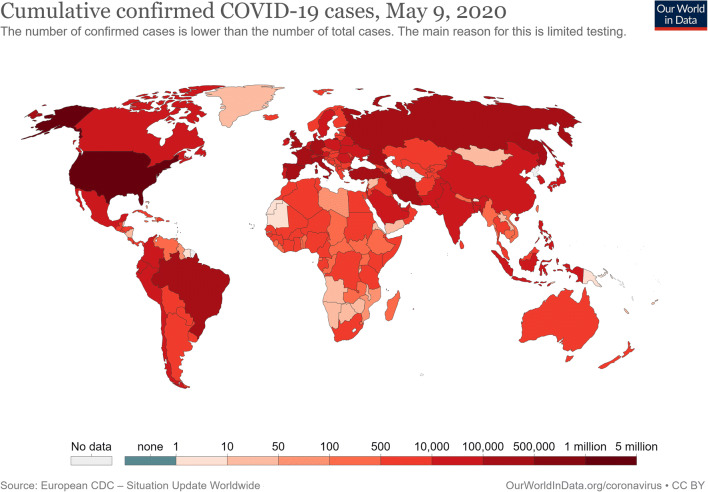
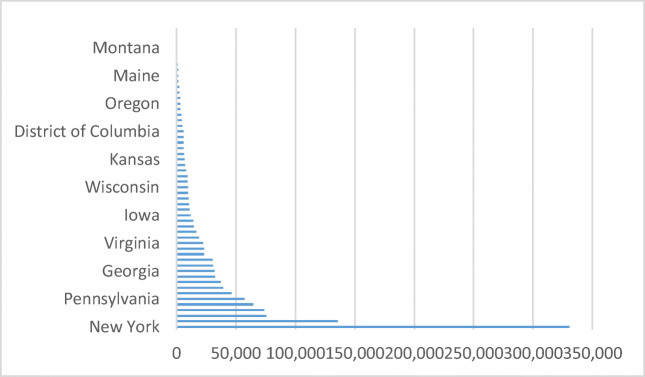
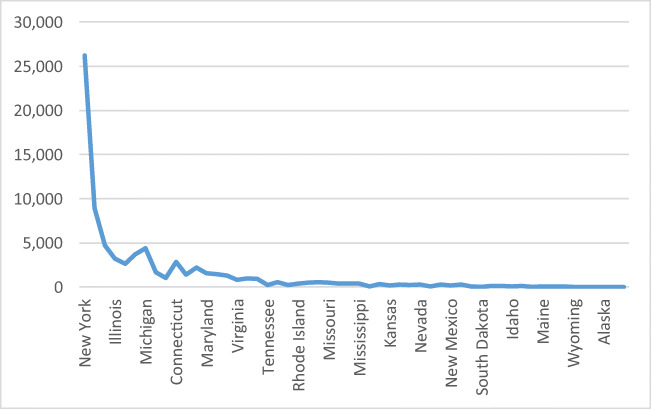
Figure 1 represents the COVID-19 worldwide cases from 21 January 2020 to 9 May 2020. A considerable proportion of confirmed cases is noted in the USA. To date, the country reported about 1,283,762 cases and 77,175 deaths. New York leads the states in 330,407 confirmed cases and 26,243 deaths (Niko Kommenda 2020). Hence, New York is significantly affected by the COVID-19, and it can be utilized as the substantial exponent of the whole USA (Figs. 2 and 3).
Fig. 1.
COVID-19 cases vs deaths (worldwide)
Fig. 2.
COVID-19 confirmed cases in New York (last updated 9 May 10:25 am EDT). Source: Johns Hopkins CSSE
Fig. 3.
Deaths due to COVID-19 in New York (last updated 9 May 10:25 am EDT). Source: Johns Hopkins CSSE
The world has experienced a significant reduction in carbon dioxide emissions which is the primary source of global warming. Countries are aiming to control and reduce mortality due to COVID-19; at the same time, all changes cause unforeseen effects (Brad Plumer 2020). The closure of industrial enterprises, transportation networks and businesses reduces are a significant source of carbon emissions. Air pollution interrupts the energy equilibrium of the earth (Gautam and B. Bolia 2020).
China implemented a lockdown policy on the 23 January 2020 in response to COVID-19. Air pollution has been reduced significantly in the northern areas of China due to air transport restrictions. The air quality index decreased by 7.80% in the 44 cities in north China (Bao and Zhang 2020). In China, emissions were reduced by 25% at the beginning of the year due to factories shut down and people movement restriction. Air pollution is reduced due to COVID-19, and it has a positive impact on health (Bherwani et al. 2020). COVID-19 has improved air quality in different regions (Gautam 2020). There is a negative relationship between humidity and COVID-19 deaths (Fareed et al. 2020). In 2020, the global economy will still grow according to the Organisation for Economic Co-operation and Development prediction, although growth forecasts have halved due to the coronavirus. According to the researchers, global emissions can still be reduced by 0.3% by the end of 2020 but also with the possibility of less recovery if incentive efforts economies will be concentrated on sectors such as clean energy (Henriques 2020). Whether people can continue to apply more carbon-friendly behavioural changes after the pandemic is another question. People around the world have seen the bluer sky and less smog. The air quality is getting better over time. Still, nitrogen dioxide can be observed, but it is due to lightning and soils. The pollution produced by traffic such as cars, aeroplanes and ships has been reduced significantly. The similar impact has been observed in the USA.
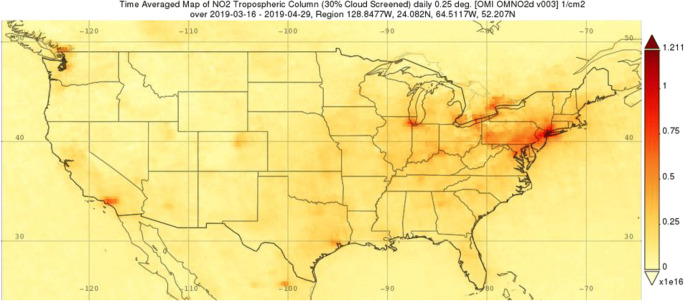
Figure 4 represents the nitrogen dioxide over the USA from 16 March 2020 to 29 April 2019. The pollution level is too high in the urban areas of the USA.
Fig. 4.
Nitrogen dioxide over the USA (16 March 2019 to 29 April 2019). Source: Daniel Cohan, via NASA Giovanni, CC BY-ND
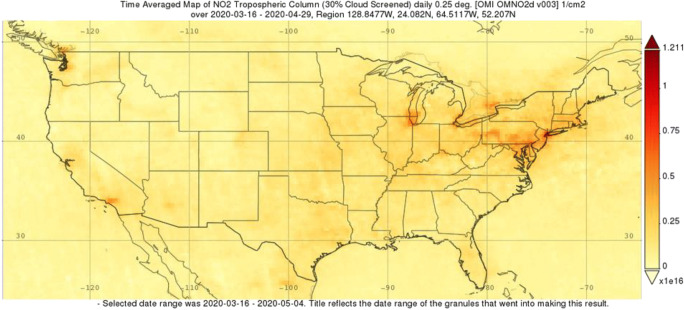
Figure 5 shows the nitrogen dioxide over the USA from 16 March 2020 to 29 April 2020. It shows pollution is decreasing significantly and rapidly in urban areas of the USA.
Fig. 5.
Nitrogen dioxide Over the USA from 16 March 2020 to 29 April 2020. Source: Daniel Cohan, via NASA Giovanni, CC BY-ND
New York city pollution levels have fallen by almost 50% since last year due to measures for control the spread of the virus (Henriques 2020). The data show that restrictions on unnecessary trips have a significant impact on New York pollution. Traffic levels fell 35% compared to a year earlier (McGrath 2020). According to researchers from Columbia University, carbon monoxide emissions dropped down about 50% in a couple of days due to road traffic restriction. They also found that in New York, CO2 and methane decreased by 5–10% (McGrath 2020). This information revealed that New York has significantly affected by COVID-19 as compared with other states of the USA. Consequently, the investigation utilized the parameters of New York to ascertain the impact of COVID-19 on environmental quality. This examination assumed that increase in the registered cases of COVID-19 results in extreme lockdown condition. Likewise, an upsurge in the deaths because of COVID-19 dramatically decline the total population. The primary objective of the study is to determine the impact of lockdown circumstances on environmental quality in the USA. Also, the investigators evaluated the substantial effect of the decline in the total population of the USA on its environmental pollution. The study considers the following questions. First, did the lockdown clean the environment of New York? Second, did nitrogen emission in New York decline due to population decrease because of COVID-19? Third, did COVID-19 prove to be a blessing for climate conditions? Fourth, did the lockdown have a negative or positive effect on nitrogen emission? Fifth, did the decrease in population have more impact or did the lockdown show a more significant impact on environmental quality?
Data and methodology
Data
This examination employed daily figures of nitrogen dioxide (NO2) emission as the nomination factor of climate change in New York. Moreover, the registered cases of COVID-19 represent the lockdown condition in New York. As the number of registered cases increased, it means lockdown is getting stronger. Whereas, an upsurge in registered deaths due to COVID-19 denotes the diminution in the population of New York. Study data has been retrieved from the database of New York city health and USA Climate data from March 17, 2020 to April 30, 2020.
Methodology
The study has used the nitrogen dioxide (NO2), and New York COVID-19 registered cases as the dependent variable to check the environmental quality in New York. Deaths due to COVID-19 is the independent variable in this study. This investigation applied the log form of independent variables. The ordinary equation form of this model is as follows:
| 1 |
here Δ and ∝0, ∝1, ∝2 respectively represent the first difference factor and independent coefficients. Additionally, nitrogen dioxide (NO2), COVC and COVD nominate the daily nitrogen emission, registered cases of COVID-19 and deaths happened due to COVID-19 in the New York state. For the estimation of asymmetries, which occur as a result of positive and adverse shocks in COVID-19, the on-hand examination utilized the Non-Linear Autoregressive Distributed Lag (NARDL) model presented by Shin et al. (2014). NARDL is an asymmetric version of the linear ARDL model (Pesaran et al. 2001). It is more suitable for a small set of data, and it also permits nonlinearity and integration in one equation. Moreover, the NARDL can be used apart from either the data is stationary at level, first difference or else varied of integration (Ahmad et al. 2018). Because of these particular features, this model combines the short period changes to long-term symmetry after taking the long-run information into account (Shin et al. 2014). Further, this methodology avoids the elimination of any liaison among variables that can be skipped in linear ARDL setting. Thus, NARDL model differentiates the linear integration and non-linear cointegration. Several studies have used this model due to multiple benefits of the NARDL model (Ahmad et al. 2018; Luqman et al. 2019; Rahman and Ahmad 2019; Ur Rahman et al. 2019).
First, this study follows and re-adjust Eq. 1 into an error correction model to check the long-term and short-term outcomes (Pesaran et al. 2001). The complete version and error correction form of ARDL method are defined as follows:
| 2 |
| 3 |
Here, i designates the lag value and ∆ postulates the first difference factor. ρ0 − ρ5 embodies the short-run factors and ς1 − ς5 denotes the long-run measurements. μt and ϕ1ECTt − 1 indicate the residual parameter and error correction parameter. Besides, ACCOVC and ACCOVD represent the accumulated registered cases and deaths as results of COVID-19 in New York. These variables are included as a control variable to ascertain the net impact of the daily condition of COVID-19 in New York. The above-presented equations are based on the assumption that COVC and COVD have an asymmetric effect on nitrogen dioxide (NO2). This study splits COVC and COVD into two categories i.e. , , by following the method of Shin et al. (2014). The first category captures the positive shocks in COVC and COVD, while the second category measures the impacts of adverse shocks in COVC and COVD:
| 4 |
| 5 |
| 6 |
| 7 |
For NARDL equations, this study reinstate the COVCt and COVDt with , , and in Eqs. 2 and 3.
| 8 |
| 9 |
The examination will test the long-term cointegration among the variables in Eq. 8 by analysing the joined allusion of lagged levels by using the F test model. Notably, the null hypothesis ϕ1 = ϕ2a = ϕ2b = ϕ3 = ϕ4 = ϕ5 = ϕ6 = ϕ7 = ϕ8 = 0 is tested. Hence, the investigation examined the null hypothesis of no assimilation exists against the alternative assumption of integration exists. The decision is made after comparing the F statistics values with critical values that are generated by following the methodology of (Pesaran et al. 2001). The alternative hypothesis is accepted when the F statistics value is higher from the upper bound values. However, when the value of calculated F statistics is lesser from lower bound values, then no long-term affiliation exists among the variables. Finally, when the estimated F statistics value lies between the upper and lower bound values, subsequently the results are inconclusive. After the estimation of Eqs. 8 and 9, the study investigates the Wald test to discover the long-term// ς1, // ς1 and short-term //// ρ1 asymmetric impacts of COVC and COVD on the environmental quality of New York, respectively. The lag selection of this investigation is based on the Akaike Information Criterion. Breusch and Pagan (2006) model were applied to evaluate the Serial Correlation and Heteroscedasticity effect in the residuals of the NARDL model. Moreover, the Ramsey approach is employed to ascertain the misspecification error in the model. At the same time, the cumulative sum (CUSUM) of recursive residuals and a square of CUSUM (CUSUMSQ) test are used to evaluate the stability of the model.
Results and discussions
Descriptive parameters, spearman correlation and unit root techniques
Table 1 shows the descriptive factors of the variables applied in this study. These statistics elaborate that the mean value of COVC is higher than COVD, while the average value of nitrogen dioxide (NO2) of New York during COVID-19 is 2.3. The Jarque-Bera test represents that COVC and COVD factors are not normally distributed, but nitrogen dioxide tends to be normal. However, the non-normality problem can be solved through the NARDL model. The investigation analysed the Spearman correlation among COVC, COVD and nitrogen dioxide (NO2). The findings exhibited in Table 2 designate that COVD has a significant correlation with nitrogen dioxide (NO2) and COVC. Nonetheless, COVC showed an insignificant relationship with nitrogen dioxide (NO2).
Table 1.
Statistics summary
| NO2 | COVD | COVC | |
|---|---|---|---|
| Mean | 2.310569 | 5.166213 | 8.07267 |
| Median | 2.302585 | 5.583496 | 8.184514 |
| Maximum | 3.044522 | 8.513185 | 8.925454 |
| Minimum | 1.386294 | 0 | 6.109248 |
| Std. dev. | 0.389582 | 1.614761 | 0.541497 |
| Skewness | − 0.05093 | − 0.905296 | − 1.315309 |
| Kurtosis | 0.576890 | 4.469541 | 5.637021 |
| Jarque-Bera | 3.292911 | 10.19586 | 26.01381 |
| Probability | 0.192732 | 0.006109 | 0.000002 |
| Observations | 45 | 45 | 45 |
Source: Author’s calculation
Table 2.
Spearman rank-order correlation
| Variables | NO2 | COVD | COVC |
|---|---|---|---|
| NO2 | 1 | ||
| Probability | – | ||
| COVD | 0.661379 | 1 | |
| Probability | 0 | – | |
| COVC | 0.153821 | 0.509454 | 1 |
| Probability | 0.313 | 0.0004 | – |
Source: Author’s calculation
The study employed the augmented Dickey-Fuller test (Dickey and Fuller, 1979) and Phillip Perron (PP) test (Phillips and Perron 1988) to ascertain the stationary level of COVC, COVD and nitrogen dioxide. The outcomes of these techniques are demonstrated in Table 3. The probability values described that some variables are stationary at the level I (0) and others are stationary at 1st difference I (1), while no variable is stationary at the second difference I (2).
Table 3.
Fallouts of augmented Dickey-Fuller and Phillip Perron models
| Augmented Dickey-Fuller | Phillip Perron | |||||||
|---|---|---|---|---|---|---|---|---|
| Level | 1st diff | level | 1st diff | |||||
| T statistics | P value | T statistics | P value | T statistics | P value | T statistics | P value | |
| COVC | − 3.490549 | 0.0129 | − 7.968193 | 0 | − 3.490549 | 0.0129 | − 9.668048 | 0 |
| COVD | − 2.627763 | 0.0953 | − 16.59242 | 0 | − 6.57761 | 0 | − 17.73099 | 0 |
| TEPC | − 1.071194 | 0.7186 | − 8.884835 | 0 | − 1.006223 | 0.743 | − 8.979611 | 0 |
| ACCOVD | − 0.592206 | 0.8617 | − 3.578144 | 0.0104 | 0.098576 | 0.9621 | − 3.578144 | 0.0104 |
| ACCOVC | 3.188322 | 1 | − 12.61809 | 0 | 1.926934 | 0.9998 | − 3.840301 | 0.0052 |
Source: Author’s calculation
Cointegration analysis (Bound test approach)
Table 4 disclosed the statistics of the Bound test. The figures show that COVC, COVD and nitrogen dioxide (NO2) are expressively cointegrated with each other at a 5% level of significance. Hence, this study can further move to analyse long - and short-run affiliations among these variables. This investigation engaged the Wald test to evaluate the asymmetric response of study variables. Table 5 denotes the fallouts of long-and short-run asymmetries in study variables. The Wald test exposed that COVC has an asymmetric effect in the long run as well as in the short-term period. Nevertheless, COVD possesses an asymmetric impact on the short-term period only. Consequently, Non-Linear Autoregressive Distributed Lag (NARDL) model perfectly fits the investigation.
Table 4.
F Bound test
| Value | Significance | I (0) | I (1) | |
|---|---|---|---|---|
| F statistic | 3.605546 | 10% | 1.99 | 2.94 |
| K | 6 | 5% | 2.27 | 3.28 |
| 2.5% | 2.55 | 3.61 | ||
| 1% | 2.88 | 3.99 |
Source: Author’s calculation
Table 5.
Long-run and short-run asymmetric parameters
| Long-run asymmetry | Short-run asymmetry | |||
|---|---|---|---|---|
| F statistic | Probability | F statistic | Probability | |
| COVD | 0.478959 | 0.6264 | 7.021484 | 0.0049 |
| COVC | 6.20392 | 0.008 | 8.377253 | 0.0023 |
Source: Author’s calculation
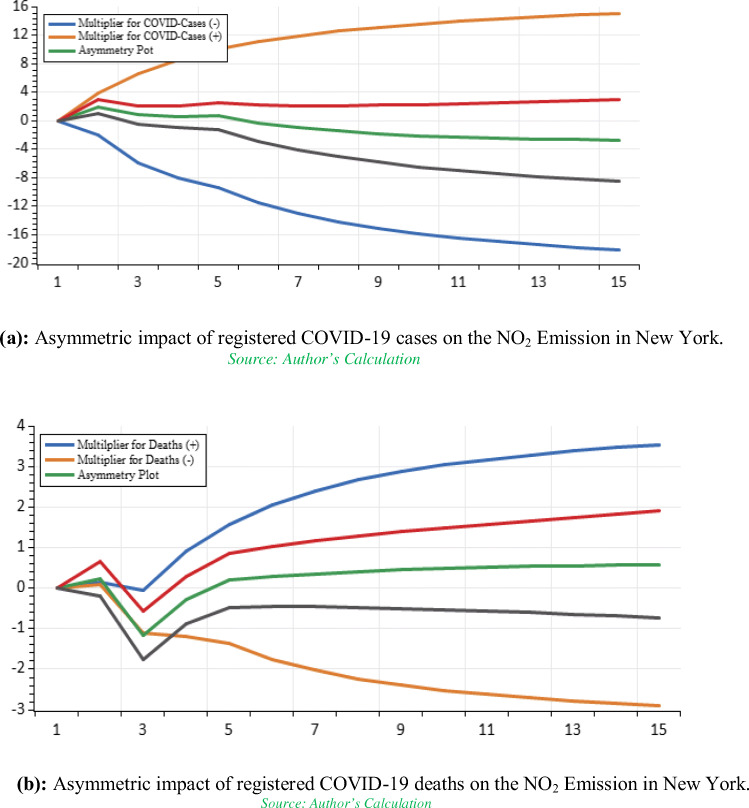
Table 6 unveiled the consequences of the NARDL approach over a long horizon. The results show that a positive (negative) shock in COVC emphatically decreases (increase) the nitrogen dioxide (NO2) in New York. These aftermaths endorsed that as the lockdown condition goes strict, it imperatively decreases air pollution, which results in better environmental quality in the New York state and vice versa. Moreover, an upsurge in the COVD significantly abridged the nitrogen dioxide (NO2), implying that a slump in the total population has a substantial and positive impact on environmental quality over the long time horizon in the New York. However, adverse shocks in COVD specified an insignificant association with nitrogen dioxide (NO2). Also, ACCOVC and ACCOVD revealed an inconsequential linkage with nitrogen dioxide (NO2). Figure 6 recounted the adjustment of the asymmetric impact of COVC and COVD on the nitrogen dioxide (NO2) in New York. The asymmetric plots exhibited the combination of the dynamic multiplier as a result of negative and positive shocks to nitrogen dioxide (NO2). The information revealed that positive shocks of COVC have a higher impact on nitrogen dioxide (NO2) than negative shocks in COVC. However, adverse shocks in COVD have a more significant influence on nitrogen dioxide (NO2) than positive shocks in COVD.
Table 6.
Long-run NARDL findings
| Variable | Coefficient | Std. error | t statistic | Probability |
|---|---|---|---|---|
| COVC_POS | − 14.58371 | 7.904214 | − 1.845055 | 0.0799 |
| COVC_NEG | − 12.25483 | 6.11629 | − 2.003638 | 0.0588 |
| COVD_POS | − 2.44072 | 1.382654 | 1.765243 | 0.0928 |
| COVD_NEG | 2.948702 | 1.79176 | 1.645702 | 0.1155 |
| ACCOVC | 0.000119 | 8.53E-05 | 0.139865 | 0.8902 |
| ACCOVD | 0.000126 | 0.000844 | 0.148861 | 0.8832 |
| C | 14.68738 | 5.372949 | 2.733579 | 0.0128 |
Source: Author’s calculation
Fig. 6.
a Asymmetric impact of registered COVID-19 cases on the NO2 Emission in New York. Source: Author’s calculation. b Asymmetric impact of registered COVID-19 deaths on the NO2 Emission in New York. Source: Author’s calculation
Long-run parameters of NARDL model
Short-run analysis of NARDL model
Short-run upshots of the NARDL model are given in Table 7. The statistics confirmed that an expansion in COVC ominously condensed the nitrogen dioxide (NO2). These results are matched with long-run outcomes, which confirmed that lockdown in New York has considerably improved environmental quality. However, the second and third lag values of COVC represent the positive and significant relationship with nitrogen dioxide (NO2). The parameters of COVD in the short horizon show the mixed behaviour. The first lag value of COVD_POS signified that a positive shock has an indirect association with nitrogen dioxide (NO2) in New York, which ratified that depletion in the total population intensely dilutes the environment pollution in the short run.
Table 7.
Short-run NARDL findings
| Variable | Coefficient | Std. error | t statistic | Probability |
|---|---|---|---|---|
| D(COVC_POS) | − 1.974524 | 0.656809 | −3.006236 | 0.007 |
| D(COVC_POS(-1)) | 0.264835 | 0.398602 | 0.664409 | 0.514 |
| D(COVC_POS(-2)) | 0.80879 | 0.252634 | 3.201429 | 0.0045 |
| D(COVC_POS(-3)) | 1.042709 | 0.240923 | 4.32797 | 0.0003 |
| D(COVD_POS) | 0.144354 | 0.141323 | 1.021448 | 0.3192 |
| D(COVD_POS(-1)) | − 1.10534 | 0.174225 | − 6.344307 | 0 |
| D(COVD_NEG) | − 0.084419 | 0.08684 | − 0.972128 | 0.3426 |
| D(COVD_NEG(-1)) | 0.375324 | 0.148974 | 2.5194 | 0.0204 |
| D(COVD_NEG(-2)) | − 0.343474 | 0.168109 | − 2.043164 | 0.0544 |
| D(COVD_NEG(-3)) | − 0.254827 | 0.148573 | − 1.715165 | 0.1018 |
| D(ACCOVC) | 0.000408 | 9.34E-05 | 4.366523 | 0.0003 |
| D(ACCOVD) | 0.002026 | 0.000624 | 3.247769 | 0.004 |
| ECTt-1 | − 0.323446 | 0.051833 | − 6.240184 | 0 |
| R squared | 0.680546 | |||
| Adjusted R squared | 0.538566 | |||
| Durbin-Watson stat | 2.265198 |
Source: Author’s calculation
Moreover, the first lag value of COVD_NEG shows that the adverse shocks in COVD decrease nitrogen dioxide (NO2). Conversely, the second and third lag values of COVD_NEG verified that a negative shock in the COVD impressively upsurge the nitrogen dioxide (NO2) in the New York, inferring that significant increase in the total population harms the environmental quality in the New York. Indeed, ACCOVC and ACCOVD revealed a direct connection with nitrogen dioxide (NO2) in New York. The negative and significant coefficient of error correction term entitles that the current day’s instability befallen in nitrogen dioxide (NO2) due to COVID-19 and it will move back to equilibrium with the speed of 0.32 units on a subsequent day. The R squared and adjusted R squared parameters define that COVID-19 explored the 68% variation in the nitrogen dioxide (NO2) of New York, and 53% instability is generated because of significant instruments employed in this examination, respectively. The value of Durbin-Watson is 2.2, which intimates that the model is free from serial correlation.
Diagnostic model aftermaths
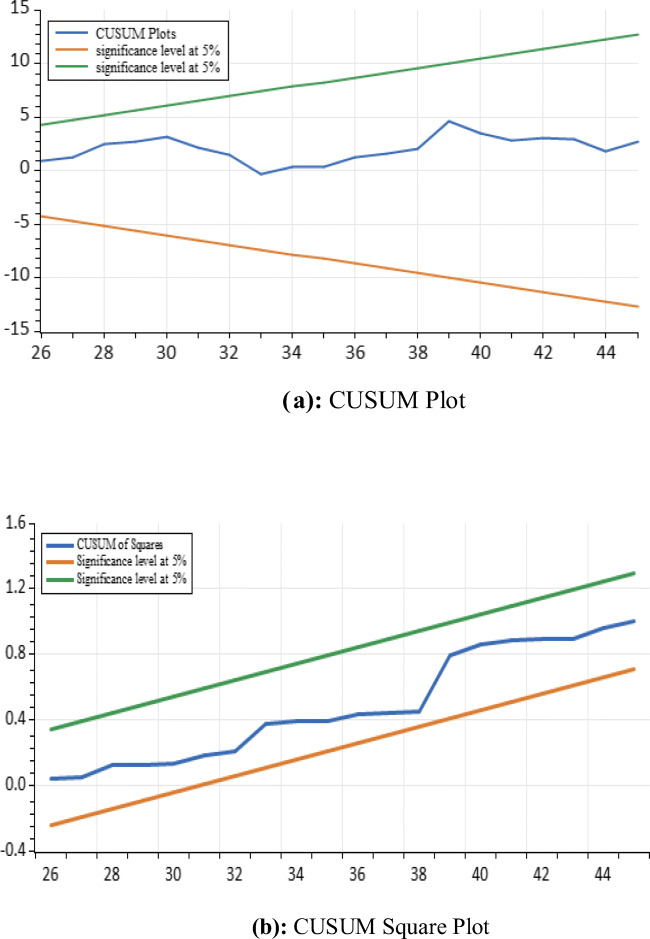
The findings of diagnostic models are represented in Table 8. Breusch and Pagan (2006) stated that there is no evidence of Serial correlation and heteroscedasticity in the residuals of the model. Moreover, the insignificant F statistic value of the Ramsey test confirmed that the NARDL model does not contain a misspecification problem. Also, Fig. 7 exhibited that CUSUM and CUSUMSQ plots are within the boundaries of a 5% level of significance, concluding that the model is stable.
Table 8.
Diagnostic test results
| Breusch-Godfrey heteroscedasticity results | Breusch-Godfrey serial correlation LM results | ||||||
| F statistic | 1.017007 | Prob. | 0.4838 | F statistic | 0.61389 | Prob. | 0.5522 |
| Obs*R squared | 19.65574 | Prob. | 0.4156 | Obs*R squared | 2.554178 | Prob. | 0.2788 |
| Ramsey RESET results | |||||||
| F statistic | 1.790043 | Prob. | 0.1954 | ||||
Fig. 7.
a CUSUM plot. b CUSUM square plot
Conclusion
The main objective of the study is to evaluate the impact of COVID-19 on the environmental quality in the New York state. The study has analysed the direct effects of lockdown (due to COVID-19) and contraction in the population of New York on its environmental pollution. The study utilized the day-wise data of average nitrogen dioxide; the registered number of COVID-19 cases and deaths occurred as a result of COVID-19. In contrast, an increasing number of deaths owing to COVID-19 nominates the drop in the total population of New York and vice versa. The study found that lockdown has played a substantial role in environmental quality in the USA. Notably, an intensification in the registered cases of COVID-19 has a momentous and indirect association with the environmental pollution in the USA. Besides, as the lockdown situation goes normal, it results in an increase in the environmental pollution in the USA for the long-term period. These consequences are also confirmed for a short-term period in the USA.
Furthermore, a drop in the population because of COVID-19 substantively improve the environmental quality over the long-term period as well as the short-term period. A decrease in the number of deaths directed an insignificant impact on climate change in the USA for the long run. However, in the short run, it explored noteworthy and indirect bonding with the environmental pollution of the USA. Yet, this study has certain limitations. Firstly, the study has considered the New York state COVID-19 data, but future research can be conducted in different regions. Secondly, this study has neglected carbon dioxide emission, which prospective study can contemplate empirically. Lastly, the impact of lockdown on environmental pollution and its relationship with sustainability will be a new direction for future research.
Compliance with ethical standards
Conflict of interest
The authors declare that they have no conflict of interest.
Data availability statement
The data that support the findings of this study has been derived from the database of NYC health (https://www1.nyc.gov/site/doh/index.page) and Climate Data For Cities Worldwide (https://en.climate-data.org/).
Footnotes
Publisher’s note
Springer Nature remains neutral with regard to jurisdictional claims in published maps and institutional affiliations.
Contributor Information
Muddassar Sarfraz, Email: muddassar.sarfraz@gmail.com.
Khurram Shehzad, Email: 233189917@seu.edu.cn.
Awais Farid, Email: awais@ust.hk.
References
- Ahmad M, Khan Z, Ur Rahman Z, Khan S. Does financial development asymmetrically affect CO 2 emissions in China? An application of the nonlinear autoregressive distributed lag (NARDL) model. Carbon Manag. 2018;9:631–644. doi: 10.1080/17583004.2018.1529998. [DOI] [Google Scholar]
- Alex Scimecca, N. G. (2020) Photo essay: how the world has overcome pandemics over the last century.https://fortune.com/2020/04/29/coronavirus-pandemics-history-spanish-flu-polio-aids-sars-swine-flu-ebola/.
- Bao R, Zhang A. Does lockdown reduce air pollution? Evidence from 44 cities in northern China. Sci Total Environ. 2020;731:139052. doi: 10.1016/j.scitotenv.2020.139052. [DOI] [PMC free article] [PubMed] [Google Scholar]
- Brad Plumer, N. P. (2020) The coronavirus and carbon emissions. https://www.nytimes.com/2020/02/26/climate/nyt-climate-newsletter-coronavirus.html.
- Breusch TS, Pagan AR. A simple test for heteroscedasticity and random coefficient variation. Econometrica. 2006;47:1287. doi: 10.2307/1911963. [DOI] [Google Scholar]
- Bherwani H, Nair M, Musugu K, Gautam S, Gupta A, Kapley A, Kumar R. Valuation of air pollution externalities: comparative assessment of economic damage and emission reduction under COVID-19 lockdown. Air Qual Atmos Heal. 2020;13:683–694. doi: 10.1007/s11869-020-00845-3. [DOI] [PMC free article] [PubMed] [Google Scholar]
- Dickey DA, Fuller WA. Distribution of the estimators for autoregressive time series with a unit root. Journal Am Stat Assoc. 1979;74:427–431. [Google Scholar]
- Fareed Z, Iqbal N, Shahzad F, Shah SGM, Zulfiqar B, Shahzad K, Hashmi SH, Shahzad U. Co-variance nexus between COVID-19 mortality, humidity, and air quality index in Wuhan. China: New insights from partial and multiple wavelet coherence Air Qual Atmos Heal. 2020;13:673–682. doi: 10.1007/s11869-020-00847-1. [DOI] [PMC free article] [PubMed] [Google Scholar]
- Gautam D, B. Bolia N. Air pollution: impact and interventions. Air Qual Atmos Heal. 2020;13:209–223. doi: 10.1007/s11869-019-00784-8. [DOI] [Google Scholar]
- Gautam S (2020) COVID-19: air pollution remains low as people stay at home. Air Qual Atmos Heal. 10.1007/s11869-020-00842-6 [DOI] [PMC free article] [PubMed]
- Gutiérrez, P. (2020) Coronavirus world map: which countries have the most cases and deaths? https://www.theguardian.com/world/2020/may/07/coronavirus-world-map-which-countries-have-the-most-cases-and-deaths.
- Henriques, M. (2020) Will Covid-19 have a lasting impact on the environment? https://www.bbc.com/future/article/20200326-covid-19-the-impact-of-coronavirus-on-the-environment.Accessed 14 May 2020
- Luqman M, Ahmad N, Bakhsh K. Nuclear energy, renewable energy and economic growth in Pakistan: evidence from non-linear autoregressive distributed lag model. Renew Energy. 2019;139:1299–1309. doi: 10.1016/j.renene.2019.03.008. [DOI] [Google Scholar]
- McGrath, M. (2020) Coronavirus: air pollution and CO2 fall rapidly as virus spreads. https://www.bbc.com/news/science-environment-51944780 .
- Niko Kommenda, P. G. (2020) Coronavirus map of the US: latest cases state by state. https://www.theguardian.com/world/ng-interactive/2020/may/05/coronavirus-map-of-the-us-latest-cases-state-by-state.
- Pesaran MH, Shin Y, Smith RJ. Bounds testing approaches to the analysis of level relationships. J Appl Econ. 2001;16:289–326. doi: 10.1002/jae.616. [DOI] [Google Scholar]
- Phillips PCB, Perron P. Testing for a unit root in time series regression. Biometrika. 1988;75:335–346. doi: 10.1093/biomet/75.2.335. [DOI] [Google Scholar]
- Rahman ZU, Ahmad M. Modeling the relationship between gross capital formation and CO 2 (a)symmetrically in the case of Pakistan: an empirical analysis through NARDL approach. Environ Sci Pollut Res. 2019;26:8111–8124. doi: 10.1007/s11356-019-04254-7. [DOI] [PubMed] [Google Scholar]
- Ries, J. (2020) Here’s how COVID-19 compares to past outbreaks. Healthline https://wwwhealthlinecom/health-news/how-deadly-is-the-coronavirus-compared-to-past outbreaks#20022004-severe-acute-respiratory-syndrome-(SARS) Accessed 14 March 2020
- Shin Y, Yu B, Greenwood-Nimmo M. Festschrift in Honor of Peter Schmidt. New York, NY: Springer New York; 2014. Modelling asymmetric cointegration and dynamic multipliers in a nonlinear ARDL framework; pp. 281–314. [Google Scholar]
- Smith, J. E. (2020) HIV, Ebola, SARS and now COVID-19: why some scientists fear deadly outbreaks are on the rise. https://www.latimes.com/california/story/2020-04-06/ebola-sars-zika-covid-19-deadly-outbreaks-on-the-rise.
- Ur Rahman Z, Chongbo W, Ahmad M. An (a)symmetric analysis of the pollution haven hypothesis in the context of Pakistan: a non-linear approach. Carbon Manag. 2019;10:227–239. doi: 10.1080/17583004.2019.1577179. [DOI] [Google Scholar]
- Uras, U. (2020) Coronavirus: comparing COVID-19, SARS and MERS. Aljazeera. https://www.aljazeera.com/news/2020/04/coronavirus-comparing-covid-19-sars-mers-200406165555715.html.
Associated Data
This section collects any data citations, data availability statements, or supplementary materials included in this article.
Data Availability Statement
The data that support the findings of this study has been derived from the database of NYC health (https://www1.nyc.gov/site/doh/index.page) and Climate Data For Cities Worldwide (https://en.climate-data.org/).


